Power BI vs Excel: which tool fits your business needs

Often, companies that analyze data with Excel spreadsheets consider this tool the best option for this task. Power BI fans, on the other hand, are sure that their favorite rocks. To make the right decision on which Microsoft product to choose for your company, you need an unbiased view of them both.

This article encompasses a very detailed comparison of the two business analytics tools. The insights are based on the facts of the fast-growing big data market size.
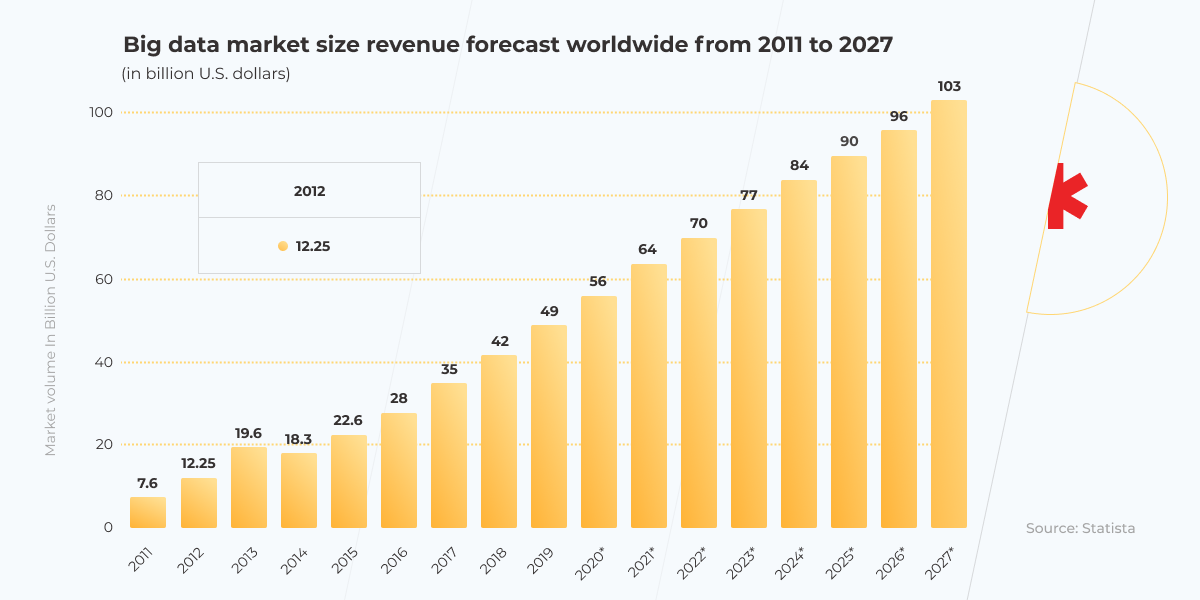
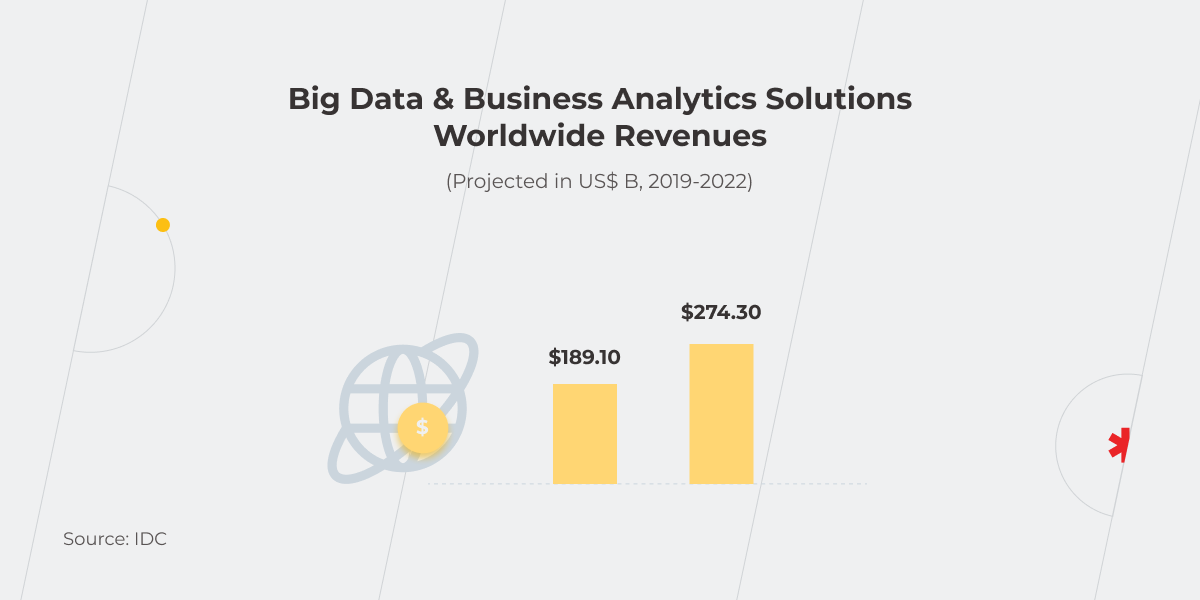
big data market size revenue

So, if your company faces the issues connected with the efficient processing of big data and is looking for an option of how to cope with data volume growth, keep reading this article and find the best solution to meet your needs.

Power BI vs Excel: A comprehensive comparison

This section analyzes the difference between the two reporting tools based on the exact tasks you manage in your ordinary working life. This will help you understand the Power BI advantages over Excel and vice versa, depending on what you need, and consider it in your BI strategy.

Multiple sources input

Task: you need to connect multiple data sources for automating data inputs in real time.

Power BI vs Excel comparison: both reporting tools can address this issue almost with the same efficiency. For this, they use Power Query and get data from almost anywhere in real time.

However, for the process automation and exclusion of manual inputs, Microsoft Power BI uses Direct Query, whereas Excel has data connectors.

As for the ease of the data entry process, it is similar in both cases. The advantage of Excel, though, is the possibility to use unstructured data sets from unstructured sources and their manual or macros-driven processing afterward. However, people looking for Power BI benefits over Excel sometimes say that it’s not effective enough for steady dataflows, although it may be helpful for the operational work of the back office.

Data transformation

Task: you need to automate the data conversion from one format or structure to another for data processing at a later date.

Power BI vs Excel comparison: both business analytics tools efficiently handle this task thanks to Power Query. The latter allows for about 350 data transformation types. For instance, you get data from SQL Server, CSV file, OData, or any other data sources and convert them into a format convenient for data processing in Power BI or Excel. Power Query will do this transformation for you automatically.

Big Data Performance

Task: you need to analyze big data and build pivot tables for better data performance.

Power BI vs Excel comparison: both tools claim they work with millions of data rows, but Power BI still benefits over Excel in this task. *instinctools’ analysts who are experienced in using both Microsoft Power BI and Excel deny the two have a similar efficiency level.

According to the tests we’ve run, Excel effortlessly handles about 200-300 thousand rows, with one Excel sheet covering a bit more than one million rows. If you want to process more, you need to compile data from different sheets, which is time-consuming and not very convenient at all. Meanwhile, Power BI is more efficient when it comes to a data volume of up to 50-100 million rows, which is 100-200 times more than you can do in Excel.

— Dzianis Yushkevich, Senior Business Intelligence Analyst, at *instinctools.

Another drawback of Microsoft Excel is that the Power Pivot data model is not available in all the Excel versions. Apart from building pivot tables as the standard Excel does, Power Pivot creates the more sophisticated data models, with filtering data, renaming columns while importing data, and much more.

Data refresh

Task: you need to update your data regularly to support its relevance.

Power BI vs Excel comparison: both reporting tools allow for automatic and scheduled data refreshing. Although some sources say that Excel automates data updates only with VBA, the pre-scheduled data refresh is also available.
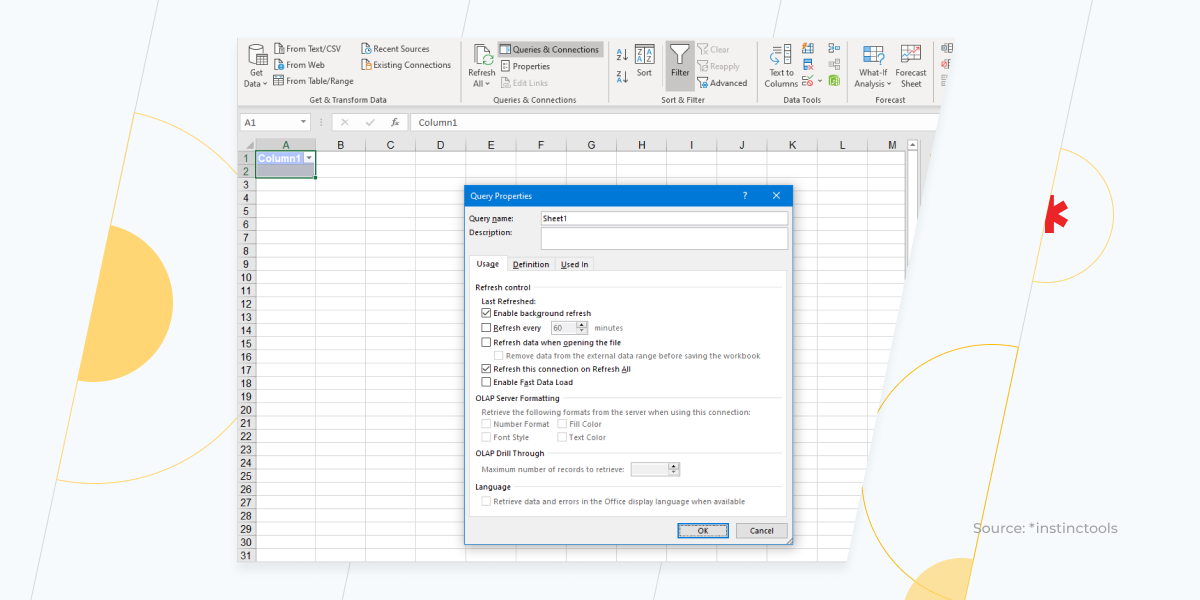
automated data refresh in Excel

When it comes to VBA usage, it cannot automate the data refresh process entirely because sometimes it will require a user to confirm certain steps. Apart from the inconvenience, the key stopper here is that users without basic knowledge of VBA cannot do this effectively. 

Data modeling

Task: you need to do data calculations.

Power BI vs Excel comparison: in Power BI, the only option for data modeling and calculations is to use data analysis expressions (DAX). This is a library encompassing functions and operations that can be used for building expressions and formulas. In Microsoft Excel reports you can operate both DAX and standard Excel formulas, which is easier for people not acquainted with DAX.

Data visualization

Task: you need to visualize datasets for a better understanding of trends and fluctuations.

Power BI vs Excel comparison: the visualization toolset is very similar in Power BI and Excel. Users highlighting Power BI advantages over Excel may not know that the extra modules and add-ons can be used in Excel, too. Excel even has a module for building advanced business diagrams. Although both data analytics tools utilize the functionality of Power Query (to automate the processing of raw data), Power Pivot (to handle big data), and DAX (to make advanced calculations), Power BI forces users to get acquainted with this toolkit, whereas Excel does not.

Generally, Power BI is like a combination of Excel and Access in one application, but with more powerful options for data processing and a broad portfolio of ready-to-use visualization solutions. Power Query is also integrated better into Power BI thanks to its more powerful internal memory and processing.

— Dzianis Yushkevich, Senior Business Intelligence Analyst, at *instinctools.

If you are looking for a tool with better interaction opportunities, Microsoft Power BI will come in handy here, too.

When it comes to diagrams, Power BI benefits over Excel because it is more convenient in use, there is less room for error, and since the diagram is connected to the dataset directly, the transformation of data into visual happens almost instantly.

— Dzianis Yushkevich, Senior Business Intelligence Analyst, at *instinctools.

Flexible analytics

Task: you need to aggregate data in different ways depending on the task.

Power BI vs Excel comparison: Power BI automates the reporting process and can work with multiple dataflows. Meanwhile, Excel allows for versatile advanced modeling and solving non-trivial analytic tasks. Taking a helicopter view, Power BI utilizes matrix tables, decomposition trees, insights, and key influencers. But, only in Quick Insights are there up to 32 insight cards.
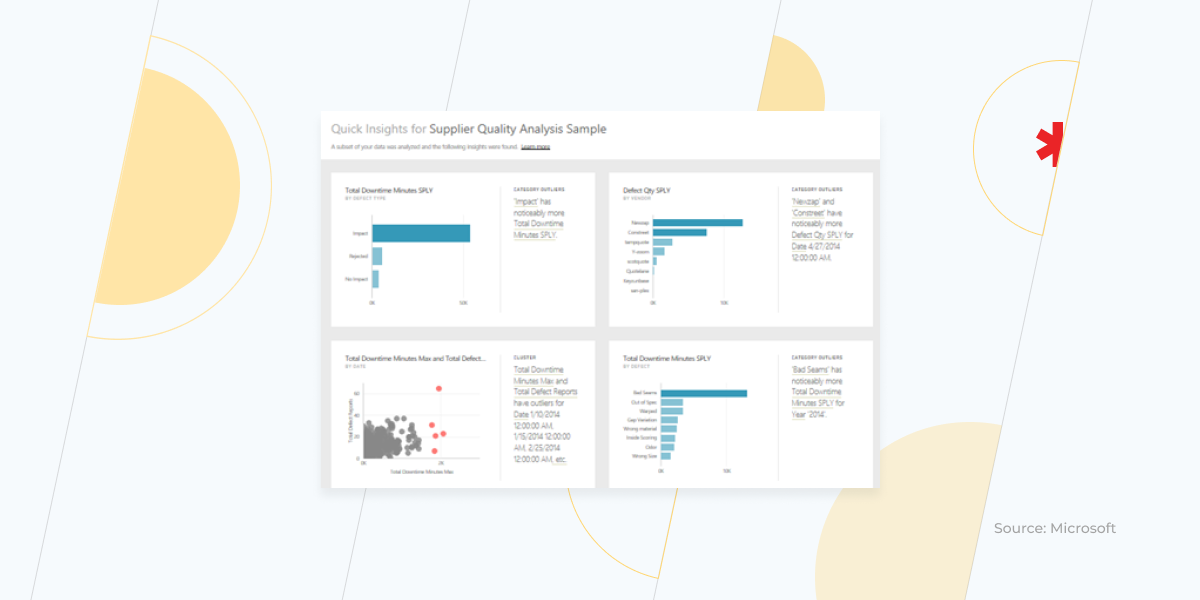
Quick Insights Example

As for Microsoft Excel, you can create dashboards and easily analyze data with Pivot Tables, using formulas anywhere you want, entering data, or applying visualization templates.
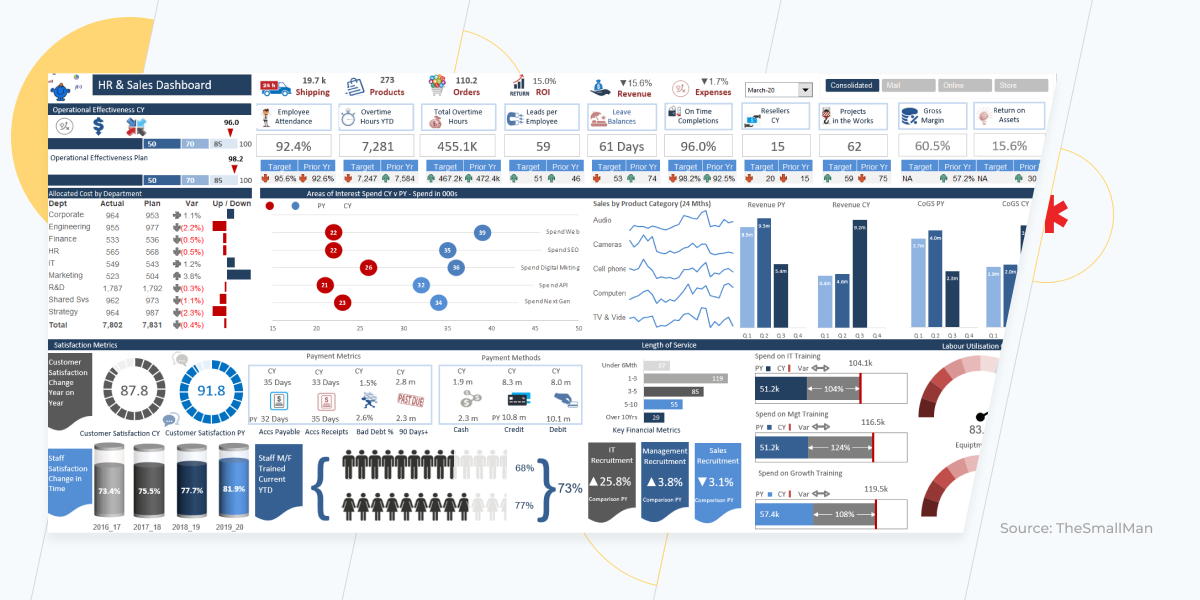
data visualization Excel

Data security

Task: you need to share your reports inside or outside your organization, and still prevent any hijacking associated with the fraudulent activities of third parties.

Power BI vs Excel comparison: generally, Power BI is considered a more secure tool than Excel because of its highly secure password access and restricted access to roles.

Mobile reports

Task: you need to access reports on a smartphone.

Power BI vs Excel comparison: Power BI benefits over Excel reports in this question because Power BI allows for much easier interactions with its mobile-driven version. As for Excel, although it claims to have the same functionality as the desktop version has, actually, it is only convenient for the report reviewing. If you’d like to make any on-the-go changes, Power BI is a better option for any mobile device.

Cost 

Task: you want to choose a cost-efficient tool for your data analysis.

Power BI vs Excel comparison: since Power BI and Excel use different approaches to pricing, it’s better to calculate the total cost of each tool. Power BI has two plans, Pro and Premium. The Pro plan for $9/user/mo allows for a 1GB model size limit, 10GB/user data storage, and standard Power BI functionality. However, if you need paginated reports, advanced AI, dataflows, or application lifecycle management, you need to choose one of the Premium options, for $20/user/mo or at a flat rate of $4,995/capacity/mo, which is more relevant for an enterprise-scale level organization. More detail on the plan difference is available here.

Microsoft Excel comes at a flat rate of $135 if you buy a standalone version or $6.99/mo if it is a part of Office 365 Suite.

What are Power BI benefits over Excel?

To summarize the benefits of Power BI, let’s use the following list:

  • It processes larger data volumes.
  • It has more functionality for data visualization.
  • It automates the processing of data coming from multiple sources.
  • It assures higher data security.
  • It is more convenient to use on a mobile device. 

Power BI and Excel: the perfect combination of both

If you are still undecided about whether to switch to Power BI, you can benefit from using both tools at once. Although Excel will remain your main tool, you can connect Power BI for some of its functionalities. For instance, you can build Power BI dashboards with multiple workbooks in a single view.
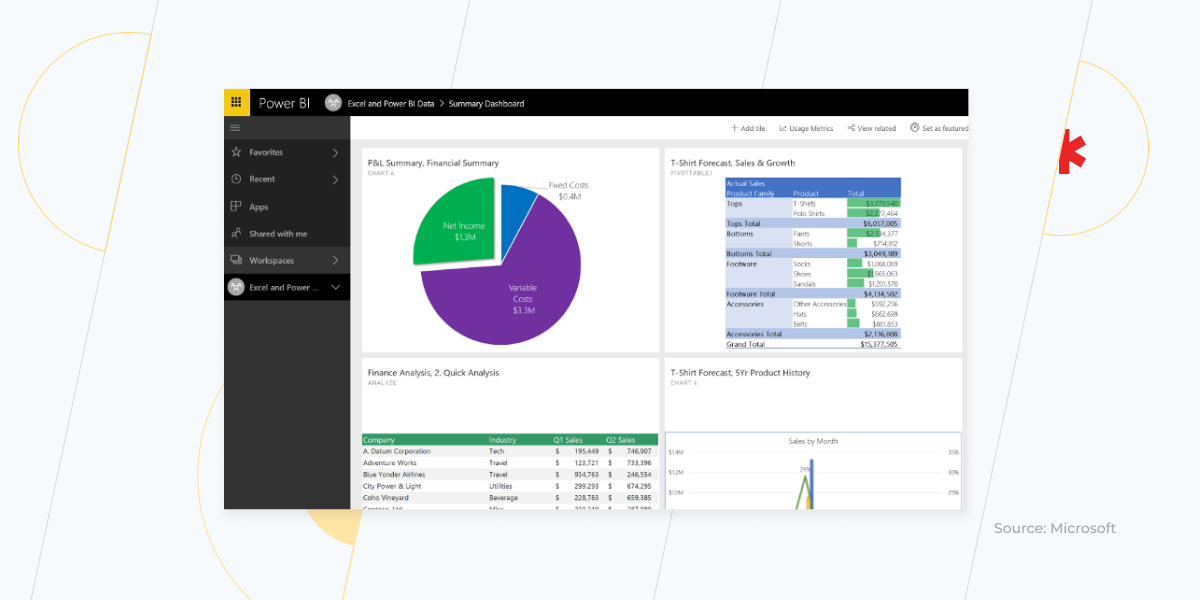
Power BI add-on for Excel

Also, you can easily discover insights with Power BI reports. 
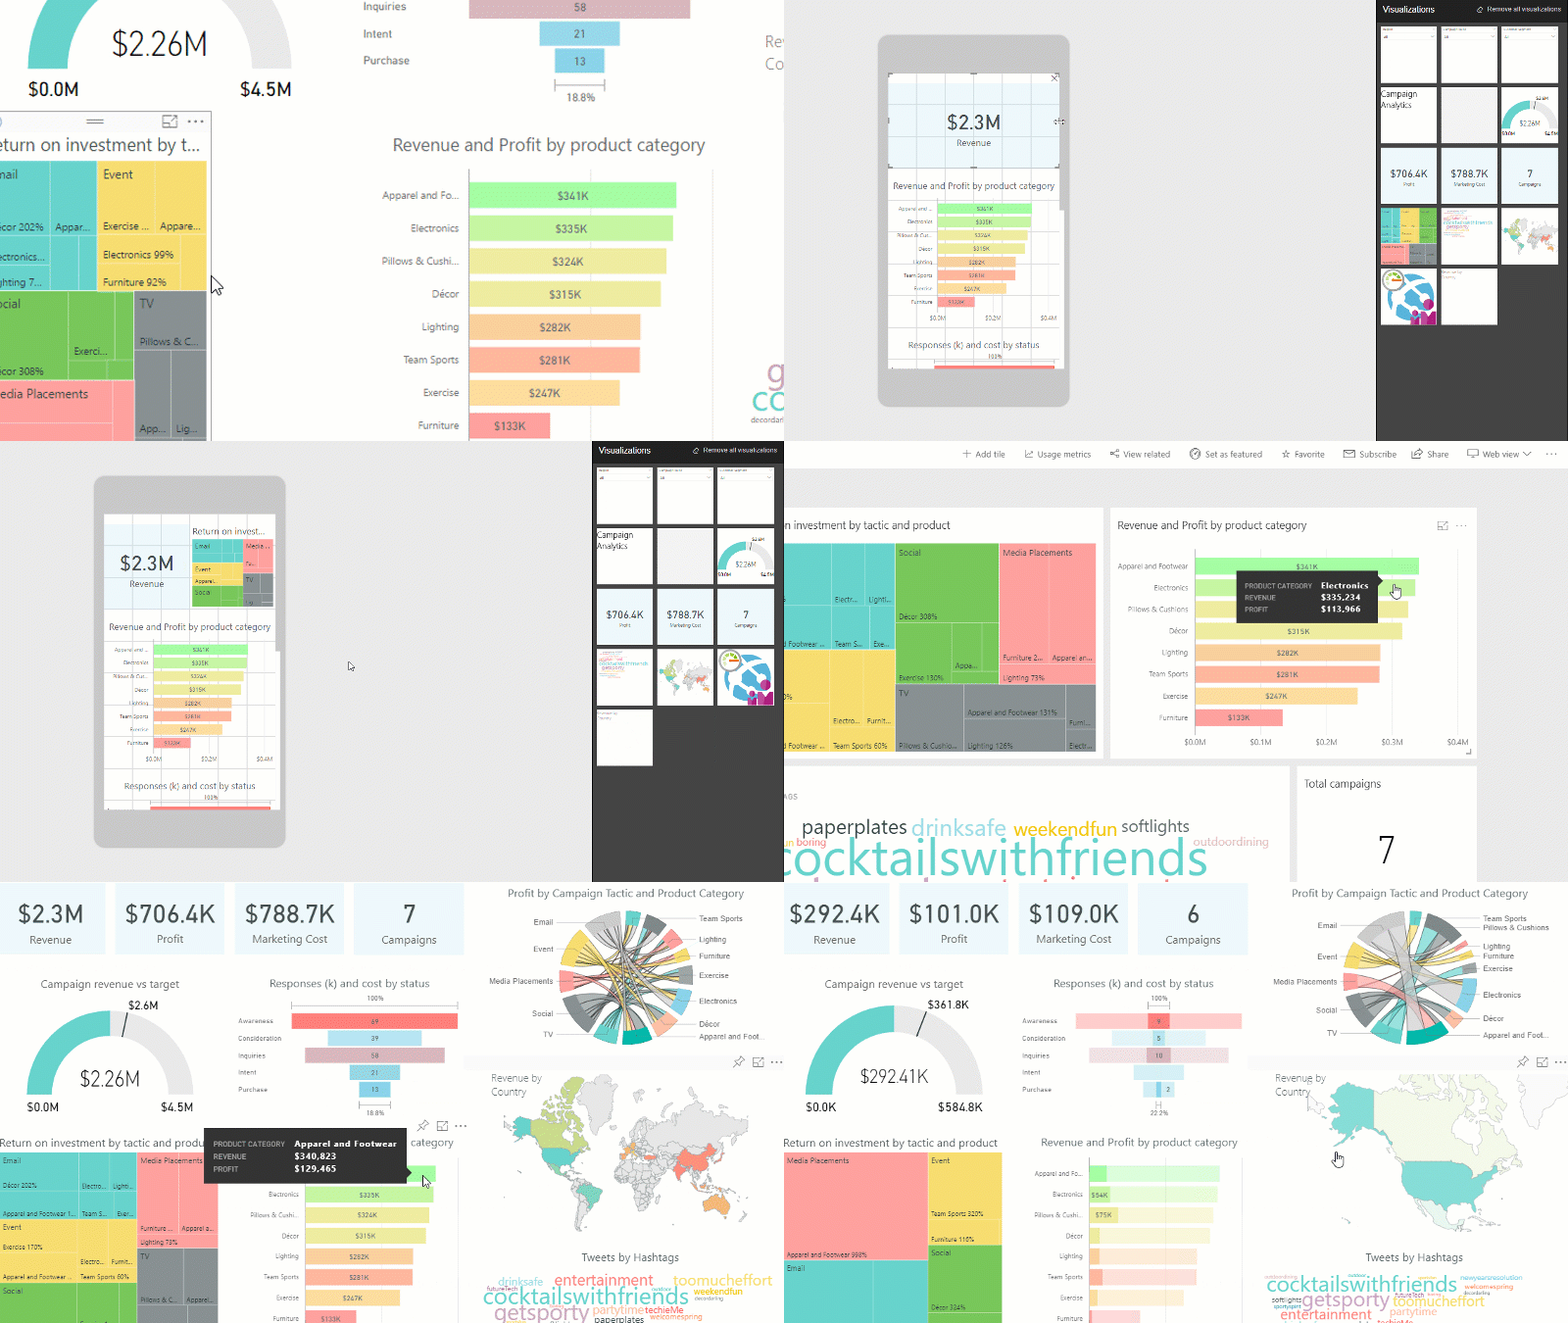
Self-service data visualization
Self-service data visualization. Source: Microsoft

In addition, you can enrich your analytics and maintain the flexibility you need.

When is the right time to move forward?

It’s time to start thinking about Power BI refresh data from Excel if your data volumes are growing and you need an efficient tool that can cope with such datasets. This migration will let you process big data, use data on the go, and make your reports more secure. If you don’t know where to start or how to tune up the data analysis process in your company, turn to *instinctools — we’ll provide you with an efficient and cost-saving Power BI service.

How is business intelligence changing the retail industry?

The customer is always right. That’s the first rule of the retail industry, isn’t it? But how do you know what your customer wants, even before they do, and keep them satisfied? After all, customer demand is constantly evolving with new trends emerging every day. That’s where business intelligence (BI) comes in. BI is a small tool for analyzing your business and getting you the results you need. So, how is business intelligence changing the retail industry? And, what can we expect from the future of smart retail? 

What is business intelligence?

In a nutshell, business intelligence is a powerful tool used by companies to understand their target customers and market better. Otherwise known as BI, this software takes raw data and turns it into valuable information. This is then transformed into actionable insights that lead to future business decisions. 

To understand the value of BI for the retail businesses today, we just need to ask one simple question: which of the following is an example of technology’s impact on the wholesale/retail trade industry?

  • Amazon
  • Blockbuster

We’ll give you a hint. One is a company with a market cap of over 1.5 trillion USD, and the other is a nostalgic memory from the past. The difference? One was future-focused, the other looked only at the current market. The results speak for themselves. 

Today’s business intelligence tools provide companies with new opportunities and allow them to take advantage of data not only to predict current sales but to see future potential, trends and understand customer demand on a deeper level. But how does BI work and why is it so effective?

Fuelled by data: how would the retail industry use business intelligence?

One does not simply BI and win. Reaping its benefits of a BI tool implementation can only be achieved when the application of business intelligence in the retail industry forms an integral part of the company’s overall BI strategy. 

From product to inventory management, sales, marketing, and beyond, business intelligence solution should underline everything. It helps develop that closer customer connection essential to dominating the marketing and predicting future trends. Below are some of the crucial techniques that BI has at its core.

Data analysis visualization. This is all about how you see your data. Data analysis visualization presents data in dashboards and uses customized metrics relevant to your retail company to make informed decisions quicker and based on facts. Moreover, BI tools can be embedded into your existing applications to empower users with immediate access to data. 

Reporting. When the bottom line is finance, making sure your business is in the black is vital. BI tools for reporting gather data from all over your company and process it to allow better data analytics and reporting and financial decision-making with a cool head and rational mind.

Predictive analytics. How do you know a strategy will work? The truth is you can’t, not 100%. However, with business intelligence, you can make an evidence-based decision to drive business further. BI allows you to analyze data and make a reasonable guess at the latest trends and customer behaviors that drive sales and impact the company’s future growth.

But, most of all, all that data tells you one important thing – all about your customer and the market. This is what those statistics really mean. 

Data tells meaningful stories: benefits of business intelligence in the retail industry

Your customer is an individual. They are not a statistic. Not a market segment. And not a group. In today’s market, they expect to be treated as such. Brands that can tap into personalization and good customer service can deliver 5.7 times more revenue than competitors. 

But how do you know who your customer is and what they desire? This is where business analysis steps up to the plate. It allows retail companies to absorb mass amounts of data about their business and customer data – from sales to market trends, consumer behavior and needs, and more – and using BI transforms it to tell meaningful stories. 

It is these stories that help you connect with your company’s bottom line – your customers. After all, isn’t how good you think your product or service is. It is how good your client thinks your product or service is.

Need to make sense of the sea of data to get closer to your customers?

Drop us a line

Here are the six advantages of business intelligence in the retail industry

Instead of just witnessing how business intelligence is changing the retail industry, be an active player in the process. With the technology in place, your employees will be able to rely on meaningful information when making decisions, uncover pain points in your business processes in the early stages, gather data about your customers from heterogeneous sources to create deeply personalized offers, and identify the most appropriate way to connect with each consumer.

Improve your decision-making

Data isn’t just numbers. It’s behavior. By engaging data in a meaningful way, businesses can better understand their market and capitalize on it. Utilizing all that big data and transforming it into easy-to-digest actionable steps allows retail companies to plan and strategize more effectively based on actual market need, not presumed ideals. 

Optimize your processes

No business strategy is perfect from the start. What’s important is to identify and eliminate those errors early on. BI solutions empower companies to continuously assess how their business operations run to gain operational efficiency. By identifying pain points early on, these can be quickly eliminated, and improvements made.

Know your customer

Business is driven by market demand. If no demand exists, what you have is a hobby, not a business. BI tool allows you to gather data about your customers, like never before. And this applies whether you are a brick and mortar store or an online platform.

Here’s an example of a visualization of a customer’s decision-making process that helps you simulate customer-switching and estimate the likelihood of switching from one need state to another.

BI tools enable your business to take both structured and instructed data and transform it into actionable insights. These tell not only about your sales process and any issues but who your customer is. This allows you to optimize for them and their needs, increase customer engagement or predict customer churn and mitigate the impact of this process. 

Personalize to perfection

As we said, consumers now expect businesses to interact with them on an individual level. This is crucial to client satisfaction. After all, a satisfied customer is four times more likely to refer a friend and five times more likely to make a repeat purchase. But, can a business do so without jeopardizing profit? 

Business Intelligence, of course. This solution helps you to identify areas within your business and customer journey that can be personalized, and cost-effectively. For example, it may be the purchase process on your app or how your staff interacts with clients.  

Keep your staff in-the-know

Henry Ford once said, “The only thing worse than training your employees and having them leave is not training them and having them stay.” One of the key benefits of business intelligence is helping your staff better understand your clients and their needs. 

Empowered with knowledge, your team can better trouble-shoot issues, adapt to customer needs and behaviors, and, thus, increase customer satisfaction level and improve sales. For example, this could be as simple as allowing shoppers to shop independently or providing assistance. Knowing that your shoppers prefer home delivery over pick up or having an option to do so. Or even as complicated as offering recommendations based on previous choices. 

Connect the right way

Sales and marketing probably make up a significant chunk of your budget. That’s why it’s vital that they’re effective. No longer are sales and marketing campaigns merely targeted to customer segments or around special occasions, such as the holidays. Your sales and marketing need to directly connect with an individual customer as 96% of consumers expect a seamless shopping experience across channels. 

BI empowers your retail business, first to understand what makes your customer tick, and utilize it in a meaningful way to connect on their level. What platforms do they use? Where do they shop? And could will they know about your business? Saving you time, money, and allowing you to plan effectively.

Want to reap these benefits of BI adoption?

We’ll help

So then, how is business intelligence changing the face of the retail industry?

This is retail, but not as we know it. Data is driving everything, and only those who can lasso the great bull of ones and zeros can hope to control the market. Smart retail is here to stay. It is data-driven, efficient, and, most of all, customer-focused. 

In the digital world, the bottom line of business is the ability to adapt, be future-focused, and personal. And the tool to achieving it is business intelligence. BI is changing how retail is done, making it forward-facing and customer-focused in a way unlike ever before.

Keep up with BI adoption trend and leverage the technology to the fullest!

Get in touch

BPM vs RPA: The Duet You Can’t Miss

When you have a huge goal in front of you, approaching it might seem challenging. With digital transformation as your top business concern, how should you start? 

Trying to refine processes you don’t quite understand is the path to nowhere. In other words, improving only certain activities is not enough; you need to see the entire picture behind them to understand how the workflow can be upgraded.

There are many ways to ensure better organizational performance. In this article, we’ll take a closer look at BPM (Business Process Management) and RPA (Robotic Process Automation) and what they mean for your business. 

As a process, BPM can be compared to life. There are a lot of tasks to do within this process. Some of them require your participation, but others can be delegated to a virtual assistant such as a smart house system that facilitates certain operations — just as RPA does. With some of the house system’s sensors, you can adjust the temperature and humidity in the rooms so you can sleep better, or synchronize turning on the electric coffee machine and the multicooker with your alarm clock and breakfast will already be prepared by the time you wake up. Doing these and many other things without manual effort streamlines your routine and helps you focus on more important stuff. The same goes for business. With BPM and RPA at its service, you’ll reap tons of benefits you’ve probably haven’t thought of, yet.

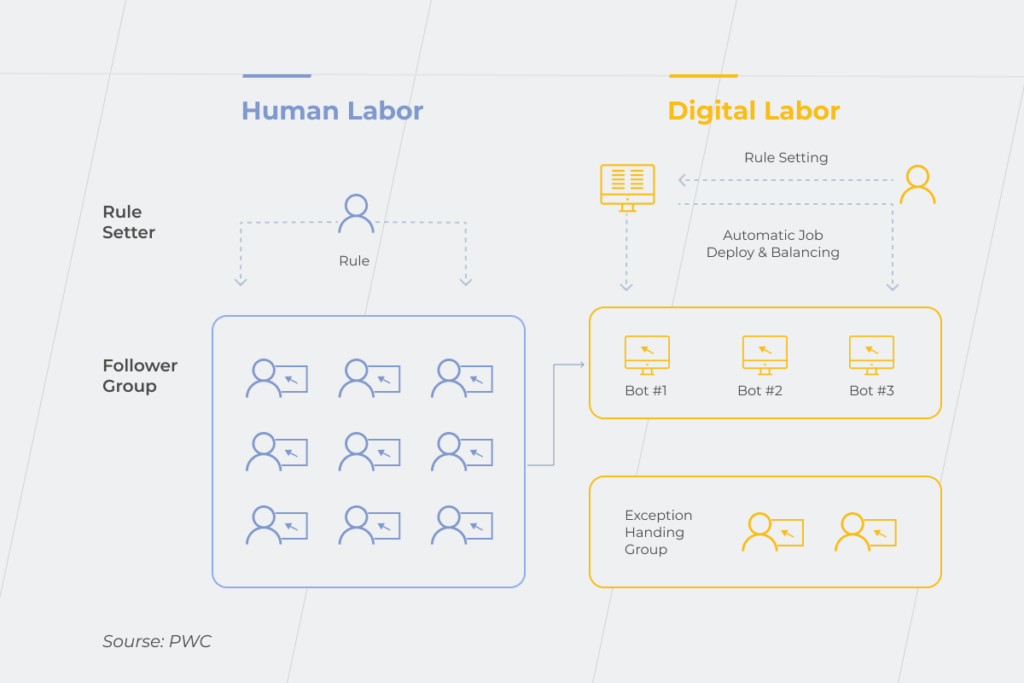
Business process management is a global process-focused approach that forms the skeleton of a procedural flow in a company. BPM establishes the game rules for a particular business — how its parts should perform to produce the right outcomes. Meanwhile, RPA is a task-focused form of automation. It focuses on decreasing the number of dull, repetitive operations. RPA is one of the technologies that put BPM’s ideas into practice. 

Implementing RPA alone won’t put your business on the fast track to success because it just enables processes to run faster and/or makes them frequent, even if the processes themselves are inefficient and need reengineering. On the other hand, BPM determines the processes that need to be streamlined and explains how it could be done to facilitate the whole workflow. 

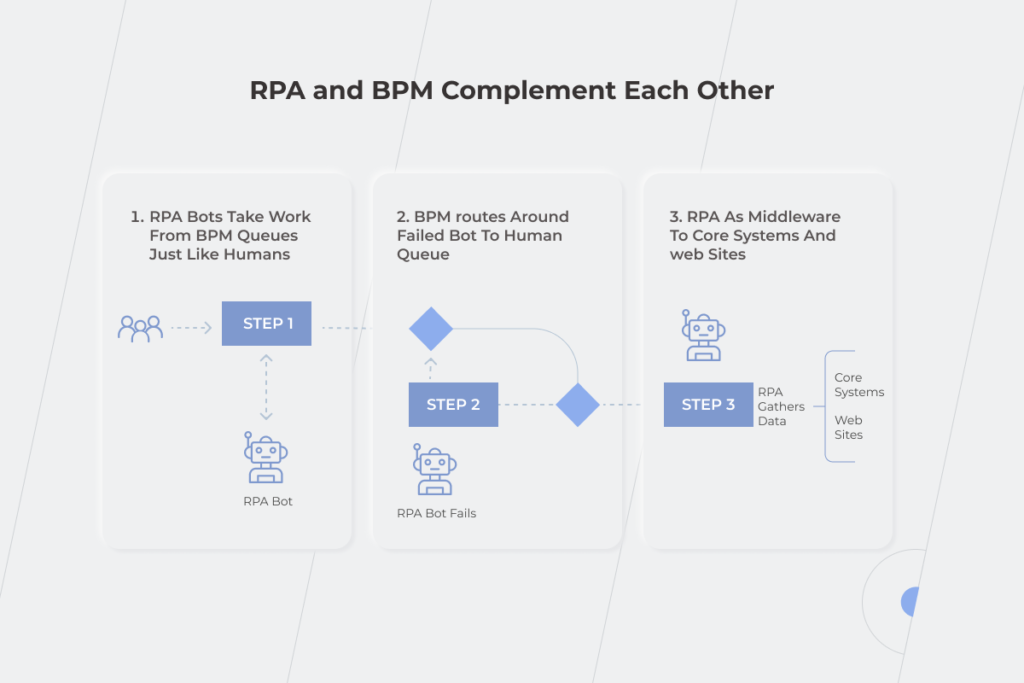
Let’s investigate the relationships between those concepts. In the example, you can see the online appointment registration in a clinic. All the patients have to do is log in, and choose the doctor, date, and time slot. If there are no schedule changes, they’ll receive a pre-appointment reminder from the RPA bot. It’s easy to send notifications when everything goes as planned, you might think, but how to automate unplanned changes? That’s what BPM is for — it controls the whole process and uncovers possible bottlenecks. For instance, if the appointment before yours takes more time than expected, clinic staff has to notify you and other later patients about the schedule changes. However, managing it manually would be exceptionally time-consuming. Thanks to well-established BPM, an RPA bot takes into account several conditions such as patient’s data and available doctors to estimate appointment duration and remove relevant time slots from the doctor’s schedule on the online booking portal.

RPA and BPM

In 2020, the need for RPA technology in healthcare skyrocketed. When the pandemic hit, manual patient registration seemed like a chaotic deadlock that either had to be broken or could break everything else. The situation was remedied by the adoption of RPA bots that managed patient data registration in 14-16 seconds error-free. This is compared to the three minutes it used to take humans to perform the same task.

How do BPM and RPA influence your business?

Replacing tedious manual labor with automation and revamping business processes are crucial components of digital transformation. With 87% of senior business leaders saying digitalization is a priority, its successful completion becomes a predominant concern. You won’t achieve expected results without a holistic view of the company’s workflow and a clear understanding of how to make the best use of your employees’ talents. And here RPA and BPM come to the rescue. RPA helps solve the issue of automating similar actions without human intervention. Meanwhile, BPM provides you with a plethora of opportunities to enhance your organization’s efficiency.

Visualize your business processes and identify their productivity 

At this point, you can also benefit from Business Intelligence (BI) with its data visualization tools. Combine awareness with action – together with BPM, business intelligence increases processes transparency and provides you with analytics, and this is the pillar of prudent decision-making. BPM is a good choice for pinpointing drawbacks, and BI is a great opportunity to predict the potential outcomes after process adjustments. Take advantage of making your business process management more intelligent. 

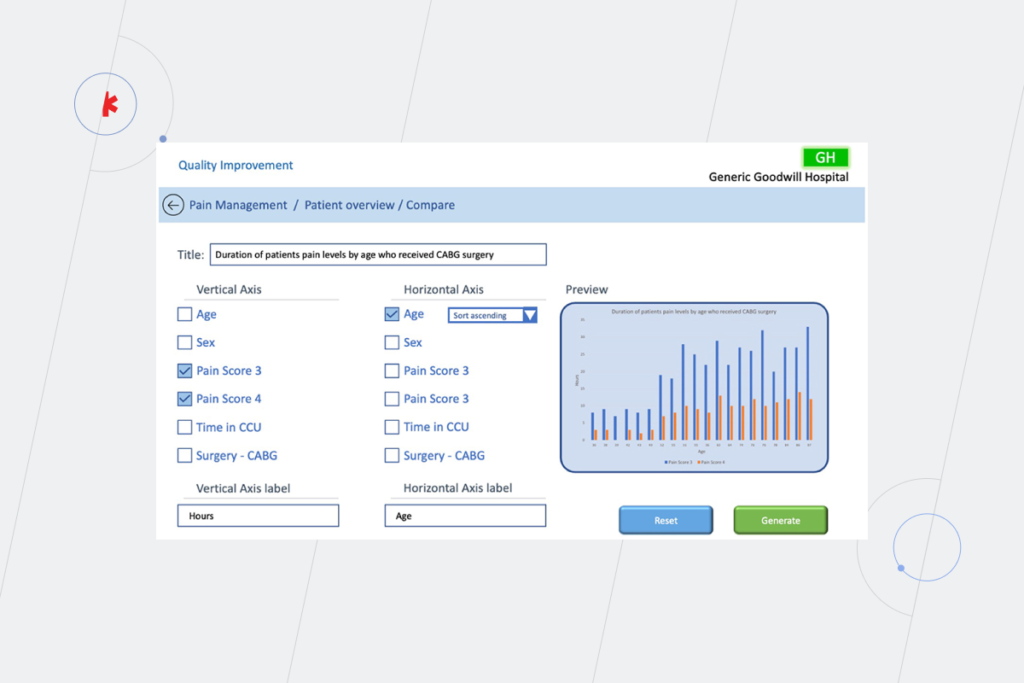
Here’s an example of how BPM approach and BI tools can be united for a deeper understanding of such a healthcare process as a hospital treatment after CABG surgery. Thanks to up-to-date data from BI tools, doctors can predict the need for pain management using patients records and dividing them according to their age and other parameters.

data visualization tools

Find bottlenecks that are hampering the speed of the processes and reducing their efficiency 

Here’s an example of an operational bottleneck caused by people’s inability to match work volume during the multilayered approval process. Imagine that several stakeholders are interested in a set of reports. Employees who work directly on these reports can notify them when the work is done. Still, to avoid wasting employees’ time on minor mechanical tasks, it’s more profitable to set up an automatic notification to email — an RPA bot can easily do this task.

Redesign the processes

After defining the weak points, it’ll be easier to find ways to make them more results-oriented and effective. If we continue with the example from the previous paragraph, set up the RPA bot to resend the notification if the stakeholder didn’t open the email within a certain time period.

Execute automated processes 

Decrease the need for human involvement in drudge operations through robotic process automation. Respondents of the Deloitte RPA Survey Report estimate that RPA bots can deliver at least 20% of capacity in their operations. That said, this number could potentially reach up to 52% in different organizations. 

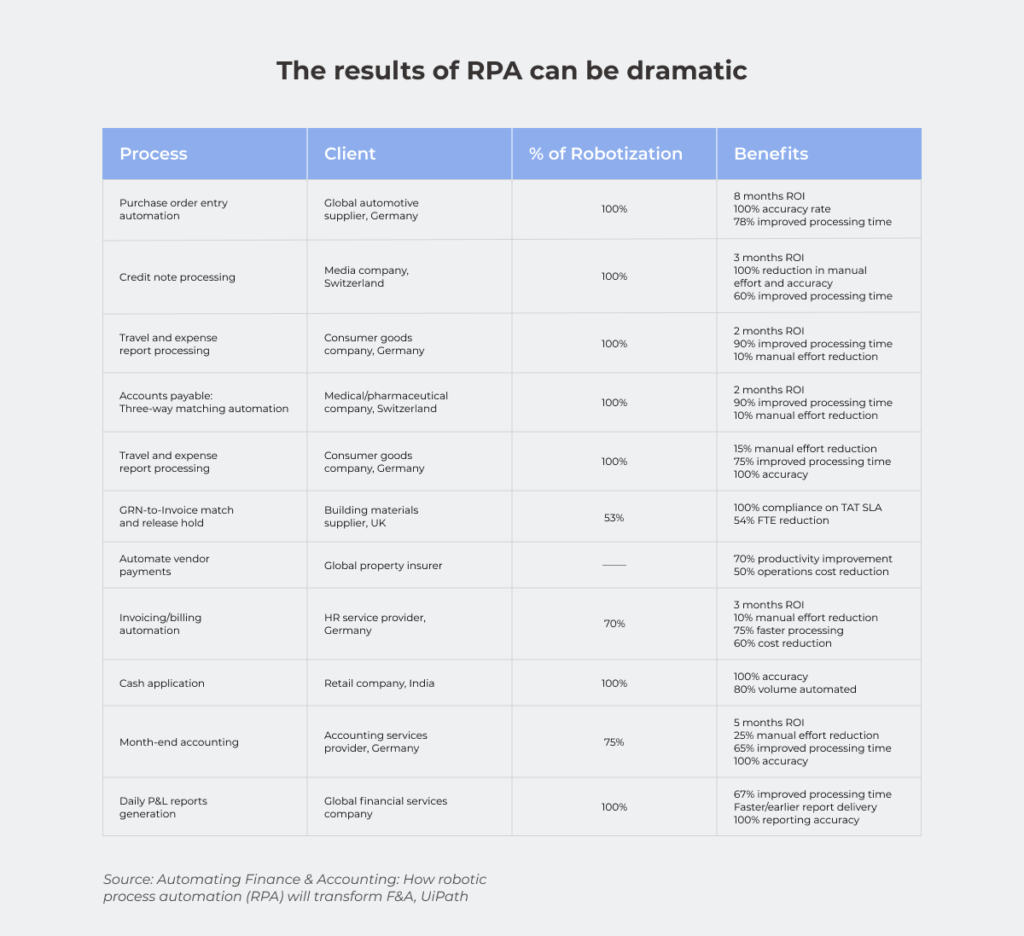
However, the real RPA benefits lie in improving organizational KPIs. According to the UiPath research, robotic automation significantly accelerates processing time (up to 78%), reduces operation cost (50-65%), ensures 100% compliance with regulations and the same level of accuracy.

RPA

Handle specific scenarios 

Robotic process automation can deal with repetitive tasks, but it relies on BPM to manage exceptions to RPA rules. If your RPA bot states that 900 employees should be fired because they worked less than they were supposed to, would you agree with this decision without thought? Or would you rather review the conditions for performance evaluation and set specific KPIs for employees from different departments as, for example, development and sales teams’ tasks can’t be measured in the same way, can they?

In a nutshell, BPM helps you to choose business processes that may be worth improvement, for instance, automating. And RPA is one of the most cost-effective possibilities to put it into action.

How difficult is it to adopt BPM and RPA?

The key issue of BPM implementation is the postponement of the result because it’s a heavyweight solution that should be integrated with the other systems — more than half of BPM projects fail to deliver the results hoped for. Indeed, BPM doesn’t produce an immediate payoff, but it’s never a useless task to understand your business processes clearly and find out how you can enhance them. Implementing RPA as part of your software development plan is easier because it’s a particular technology, but if you implement RPA without BPM, your digital transformation efforts might go down the drain as there is a possibility that you’ll just end up with poorly organized activities.

Another challenge when adopting RPA and BPM is the industry skill shortage. Even if you have an in-house IT department, the responsibilities of your staff may be limited to the system’s maintenance or your employees may think in terms of the tasks instead of processes. That’s why it makes sense to take advantage of a dedicated teams’ expertise.

One more indispensable condition for the success of BPM and RPA adoption is the involvement of all the stakeholders — from C-suite to general employees. You may face resistance to change at some level as employees will be afraid of losing their jobs to robots. So resolve this misunderstanding and turn your specialists from possible digital transformation bottlenecks into the supporters of new processes and technologies before starting your journey. 

When to use BPM and RPA? 

If the employees involved in the process are drowning in operations, this is the primary signal that BPM implementation is needed. Its adoption helps to figure out how effectively the team works, and pinpoint the weak spots.

Thanks to RPA software, you can decrease the overwhelming number of tedious operations. Automate repetitive parts leaving final decision-making to your employees if you don’t trust the robots enough to delegate some processes completely. 

Compare two approaches to the processes execution — without implementing RPA and with it. In the first case, your staff is buried under the workload of similar monotonous actions and eventually experiences burnout that causes slacking, job dissatisfaction, and even depression. The question about the performance level in this situation hardly needs to be asked. In the second case, employees don’t have to waste most of their working time on mundane operations. Thus, they can focus on dealing with higher-value tasks that require their talent and expertise.

RPA implementation

One of the reasons to consider implementing BPM is the necessity to connect your legacy and modern systems. Let’s take a look at an example from the fintech industry. When a person comes to the bank to open a deposit, basic banking legacy systems are sufficient. But what if he/she isn’t ready to waste time going to the bank and wants to open a deposit in a mobile app? In this case, outdated systems have to be connected with modern online banking. BPM uncovers this weak spot, and RPA can solve it by creating a bot that will enable legacy and modern systems to exchange data without a hitch. 

The fruitful partnership of BPM and RPA: a breakthrough in your digital transformation?

RPA and BPM differences don’t make them rivals. It’s cooperation, not competition. Implementing BPM ideas and RPA technologies together can lead you to advanced outcomes and much more profitable business processes with people involved only in activities that require their skills and expertise while the rest is automated. Adopting only RPA makes sense if you have the proper level of confidence in the machines. Going back to the example of firing a huge number of employees because of the automatic analysis of their activity during the working day — are you ready for this level of trust? It’s more advantageous to combine RPA technologies and BPM ideas so that you can supervise the results of the bots’ work. If you are still on the fence about implementing BPM and RPA solutions into your organization, schedule a consultation with our specialists and we’ll be happy to talk you through it.

DevSecOps: How to Integrate Security into DevOps

With data shaping the business landscape today more than ever before, security issues are at the forefront of everything a business does. Being ignorant about the risks of system vulnerability is detrimental no matter which industry you’re working in, but especially when you’re dealing with large amounts of consumer data. Financial, healthcare, and many other organizations are required to undergo obligatory security certification processes to prove they are compliant with all the necessary industry standards and regulations. 

However, security checks are often considered a bottleneck to deployment because they typically happen at the end of the delivery lifecycle or even after release. These checks are often manual; detecting issues means unplanned work for dev, test, and ops teams, causing delays and frustration.

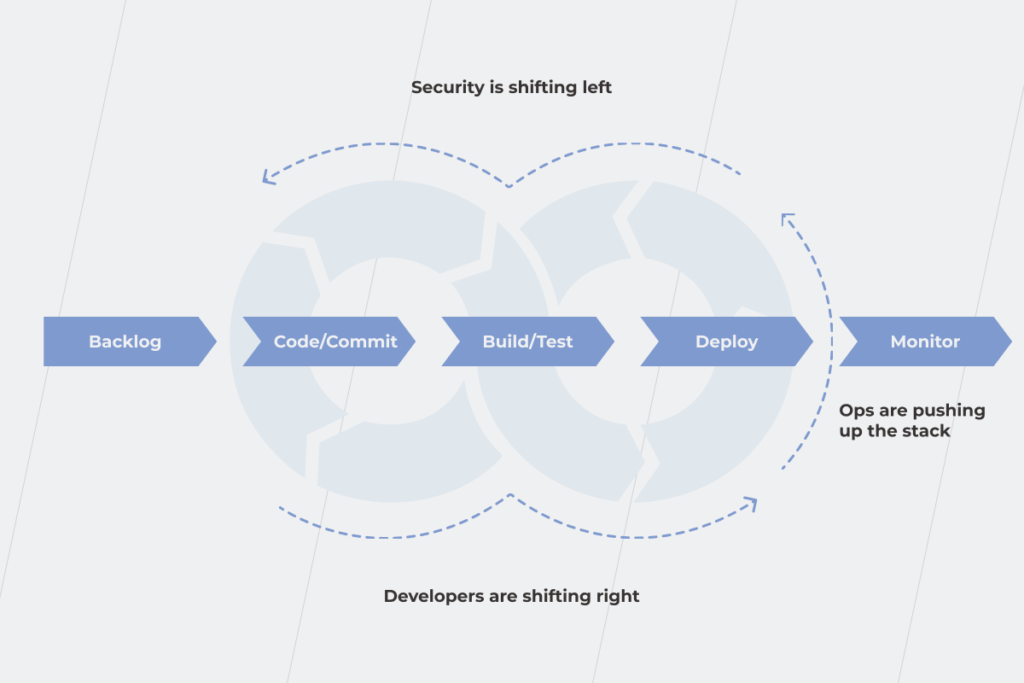
Fortunately, there’s a way to make security cheaper and, at the same time, avoid time-consuming processes and hindering system development. The solution is DevSecOps. It aims to achieve a secure SDLC and a CI/CD pipeline all the way through from start to finish by shifting security “left” to the earliest stages of the project so that the reliability of your system is no longer an area of concern.

DevSecOps vs DevOps: a fresh look at the security problem or the same thing with another name?

There are two opinions on the term DevSecOps and its place in DevOps.The first one is that to include security in the software development lifecycle from the very beginning, we need an explicit call to action. Many people take the “DevOps” label too literally and think that it encompasses only development and operations. Hence, creating “DevSecOps” looks like a good opportunity to highlight the importance of the security role.  

Good symbols, labels, and stories change the world. The pithiness of “DevOps” drove mass adoption and actual improvement far more than the “Agile System Administration” movement that preceded it. DevSecOps is fine.

— Nigel Kersten, Field CTO, Puppet  

The second view is that DevSecOps shouldn’t exist as a separate label because security is an integral part of DevOps already. 

If we keep putting every responsibility people should do in the name, we’ll run out of room for the hashtag. “DevSecOps” is dumb. #DevSecITSMTestAutomation­­MonitoringObservability­­­PeopleFinanceMarketingQAOps.

— Michael Stahnke, Director of Engineering, Puppet

Sometimes the idea of shifting security to the left may go as far as contradicting SecDevOps vs. DevSecOps. Perhaps you’re thinking: “What?! Are you kidding me?” No, we aren’t actually. Anyway, let’s not juggle the words and just agree with Bill, not Gates, but Shakespeare, “…that which we call a rose by any other name would smell as sweet.” The real issue to solve here is how to deal with the silos between security and DevOps teams? Because perhaps, only in a parallel universe could engineers and developers be okay with waiting for 48 hours while the security team runs their tests. So, then what are the middle ground solutions that DevSecOps practices can offer? 

Fighting against the deadly waterfall: why DevSecOps is a savior

With a traditional development method, such as the waterfall model, you usually can’t go back to the previous steps to modify a project. Security testing is tucked at the end of the SDLC. 

But, what are the consequences of such an approach? Significant security problems are detected only at the last stage of software development. Fixing them is painful for the team, and costly for the business owners as it results in delayed delivery. To deal with this problem, the agile methodology was invented. It allows businesses to minimize risk when adding new functionalities. And with an iterative method, it’s easier to be aware of security during the whole development process because you can go back to the previous stage and quickly fix a bug, monitor cost overruns, or change requirements earlier. With such an approach, you minimize the risk of a small mistake turning into a snowball that cripples the whole project, as it happened with SolarWinds. The company reported that up to 18,000 of its clients installed insecure updates and became vulnerable to hackers. Considering SolarWinds has many high-profile customers, such as agencies in the US government and Fortune 500 companies, the situation was quite critical for the organization and incredibly beneficial for its competitors. 

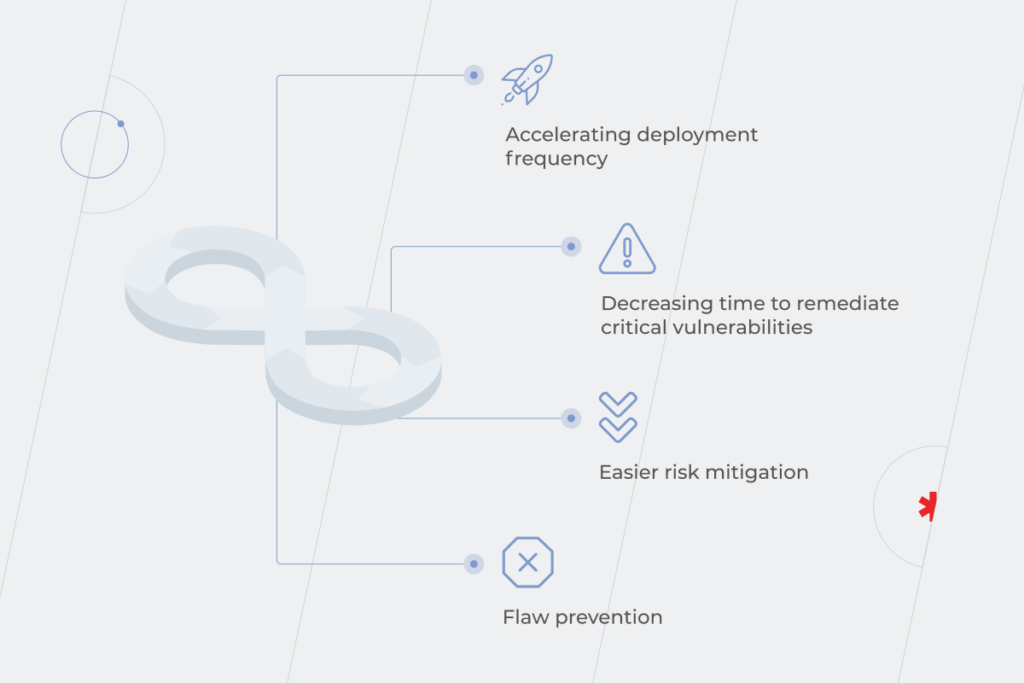
Outcomes of integrating security into DevOps in the long term:

  • Accelerating deployment frequency. Even if initially it doesn’t seem like that, the more you learn how to interact with security throughout the entire SDLC, the more frequent your deployments to production become. The case of NIAID proves that DevSecOps practices such as IaC (infrastructure-as-code) and automated testing are helpful in shortening the lead time to deliver software and patch critical defects. But as usual, when you’re changing how you work, things get worse before they get better. Early stages of integration are troublesome as security practices are introduced into stages where they weren’t before. Delivery speed takes a hit, too, and that’s frustrating for all involved. After all, who is happy about deployment time being increased by a third? These problems eventually go away as teams collaborate more smoothly to embed security in the delivery cycle, refine their processes, and see the positive outputs of their work. 

Do you need expert's advice on how to implement DevSecOps into your SDCL?

Let's talk
  • Decreasing time to remediate critical vulnerabilities thanks to DevSecOps automated security testing. Meanwhile, without DevOps or DevSecOps integrated into an organization’s development lifecycle, error fixing is manual or, at most, only semi-automated.
  • Easier risk mitigation and flaw prevention. You are more likely to stop a known-vulnerable code being pushed to production by giving this responsibility not to a centralized security team but to a delivery team. Thus, you make the process faster by removing a bureaucratic constituent and improve decision-making by relying on people from the delivery team who use their knowledge of both the technology and the business to do what is best for the company and the customer. When responsibility for security is shared across delivery teams, rather than siloed within one team, security issues are caught earlier — there are more eyes looking for potential security threats. It costs much more to fix a bug found during regular maintenance than to fix one identified during the design.
DevSecOps integration

Building a DevSecOps pipeline within a SDLC: theory and reality 

Efficient security implementation into the DevOps pipeline is a tricky task. According to the GitLab global survey results, 72% of 4,300 respondents described their security level as good or strong. Simultaneously, in almost a third of organizations (30.73%), only the security team is in charge of security. So, organizational silos are still a relevant problem.

There are two options for creating a DevOps security pipeline:

  • Using a traditional DevOps pipeline with security checking tools implemented at every stage: Plan – Code&Build – Test – Release – Deploy – Operate&Monitor.
  • Building a DevSecOps pipeline: Threat modeling – Scan – Analyze – Remediate – Monitor. 

In theory, it’s easier to create a pipeline with integrated security when you are only starting the project rather than implementing security checks into the existing DevOps pipeline as security becomes a matter of routine from the beginning. But let’s face the reality, the thing is that barely anyone truly cares about security before the preproduction stage.

According to the Sonatype survey, 48% of developers know security is important but don’t have enough time to spend on it. It doesn’t mean that it’s deemed unnecessary, but a lot of other issues with a high business priority and value are waiting to be resolved. So, then how does the process work?

When you start building a pipeline, you only have an idea of the final product. So you have to code and build something as fast as possible. It means, first of all, a business owner invests money in development, operational, and sales teams. DevOps security, at this stage, is only a rainbow unicorn perspective. Security implementation from the start is too costly for businesses. It requires specific tools and specialists to set them up. It’s hard to find additional thousands of dollars just for security when you don’t know if the product will be successful. 

The desire to turn a blind eye to security checks when you are caught in the crossfire of deadlines and frustrated employees is totally understandable. You may sleep well for many years with your software functioning just fine until one day you awaken to mind-boggling downtime instead of peace and quiet.

DevSecOps integration

Basic actions you can take for DevOps pipeline security in any case 

Underlining the obvious importance of integrating security into DevOps is a kind of “thanks, Captain Obvious” advice. It’s easy to say and hard to master. That’s why our goal is to show how to integrate security into the DevOps pipeline seamlessly without creating a drag in release times and hold up the deployment cycle, and, of course, without spending a huge part of the project’s budget on it. 

Do threat modeling and risk assessment

This practice will help you deepen the understanding of the weak points in your DevOps security, the types and sensitivities of your assets, and how to protect them. You can do threat modeling even before you shift to DevSecOps. It’ll provide you with:

  • Inventory of sensitive data
  • List of vulnerabilities with possible migration options
  • Summary of potential attack scenarios

With threat modeling, you kill two birds with one stone: eliminate vulnerabilities in the DevSecOps pipeline and improve the security knowledge within the development and operational teams. At first sight, threat modeling may seem quite a time-consuming process that affects the speed of deployment. But it won’t be an obstacle if you analyze which types of attacks are more likely to happen beforehand and choose the appropriate security checking tools. 

Tools to check how secure your SDLC and CI/CD pipeline

Automated security testing is a key component of the successful implementation of DevSecOps. With that, the speed of deployment will be affected minimally. Specially designed tools can provide you with static, dynamic, and interactive analysis of CI/CD pipeline’s security.

What are these tools specifically?

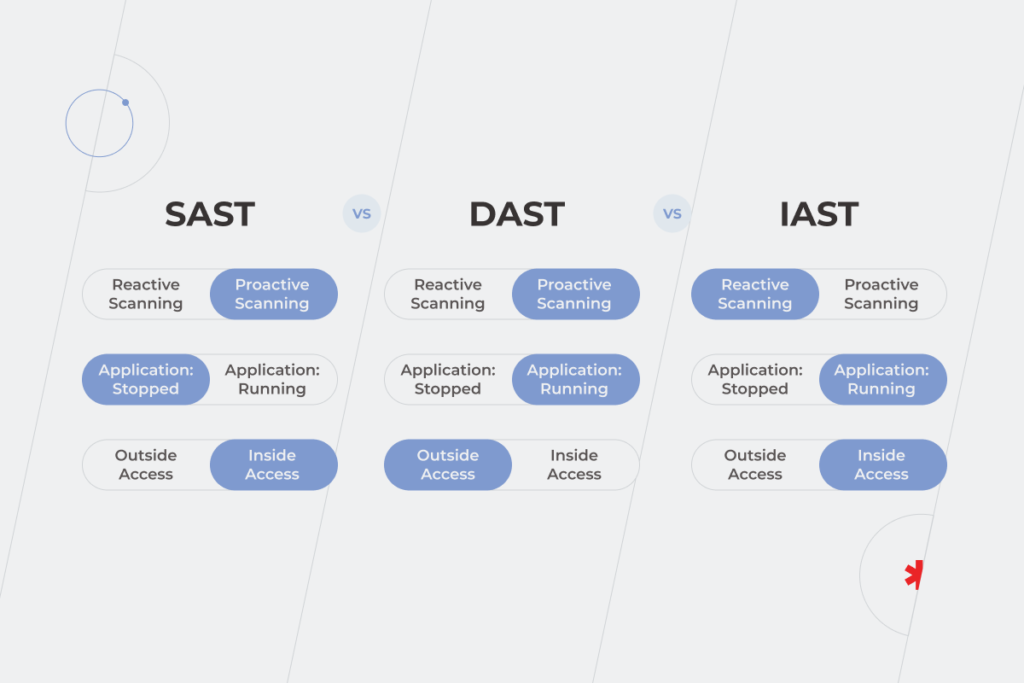
  1. SAST (static analysis security testing) software is used for white-box security testing (the “developer approach”) to check the security of the DevOps pipeline from the inside out during the building phase. You have access to the underlying framework, design, and implementation of the software. 
  2. DAST (dynamic analysis security testing) tools are needed for black-box security testing (the “hacker approach”) to prove the system’s security from external attacks outside its environment during the testing phase. In this case, you don’t have access to the underlying framework, design, and implementation of the software.
  3. IAST (interactive analysis security testing) works inside the product and analyzes code for security vulnerabilities in real-time during the QA or testing phase. It may seem like a win-win situation as far as you check security and don’t add extra time to your CI/CD pipeline. But remember that IAST tests aren’t always suitable for testing a codebase or an entire application. They only check whatever is exercised by the functional test, so you can select the activity that is a part of continuous integration, and check how secure it is. The best use for IAST tools is in combination with QA tests. 
SDLC pipeline

Define why your company needs continuous security monitoring for DevOps because security for security’s sake is a trap and a waste of time and money. First of all, specify your security priorities, choose testing tools accordingly, and decide on the phases of the DevOps pipeline where you’d like to implement them.

DevSecOps automated security testing is a heavy hitter in any sphere but there are three industries where security plays a crucial part: Finance, Healthcare, and Politics. The worst thing that can happen to a bank or a medical lab isn’t downtime. It’s data leakage. That’s why bank staff may not even have permission to install unrequired programs on computers. And if a database of a medical laboratory is attacked, executives are likely to shut down the whole infrastructure until the breach is found. It means that customers won’t get the results of their analyses or be able to book an appointment for 1-2 days minimum. But the risk of a hacker publishing customers’ data or using it against them is much worse than negative reviews.

Finding the middle ground between security level and deployment speed 

By putting speed-to-market on a pedestal while ignoring other DevSecOps objectives, you risk leaving a lot of value on the table and, more importantly, you imperil your entire business by jeopardizing customers’ data. Without security incorporated into your SDLC, users will suffer from repercussions caused by the unreliability of your system. That’s why prioritizing security is the key to better outcomes overall.

In theory, the ways of seamless integration security into the DevOps pipeline are clear and understandable. But once you start putting them into practice on your own, reality might kick in. If you have fallen into the trap of security implementation challenges, *instinctools security experts are ready to help.

FAQ:

What is a DevSecOps pipeline?

A DevSecOps pipeline is a set of security practices integrated into different stages of SDLC to recognize the security threats faster and earlier in the workflow and fix them straight away. The steps may differ according to your goals and the peculiarities of the industry. E.g., in healthcare, continuous security monitoring for DevOps is relevant, therefore security requirements are high and implemented from the very first stage. Meanwhile, some companies prefer completing penetration tests at the pre-production stage because security implementation at the very beginning might slow down deployment time.

How is DevSecOps implemented?

Integrating security into DevOps is not as easy as putting two and two together. Firstly, answer the question: “What do you expect from a secure SDLC and CI/CD pipeline?” Solutions will vary depending on the answer. You may build a DevSecOps pipeline from scratch or implement security into your existing DevOps pipeline. In both cases, you’ll need to unite dev, sec, and ops teams’ expertise and use specific tools for security checks.

Speeding Up Time to Insight: Dashboards, Data Visualization Techniques and Tools

According to Statista, from 2018 up to 2020, the percentage of worldwide organizations implementing data-driven decision-making grew from 38% to 50%. Despite a substantial increase, it becomes clear that half of the respondents still make decisions based on personal opinions and gut feelings rather than facts. Thus, if you start using business intelligence solutions to encourage data-driven decision-making, you’ll be able to outperform a significant part of your competitors.

We’ve already discussed the importance of data preparation and a robust data infrastructure for accurate analysis, but are they enough to provide moments of genuine insight? To navigate in an uncharted world of boundless data, you need to visualize the information you have. 

Visual analytics play off the idea that the brain is more attracted to process dynamic images than long lists of numbers. But data visualization is not just a colorful alternative for traditional text reports and another way of presenting the information. It is about wrapping large volumes of data in a way that helps you know exactly how to act to help your business thrive. 

Why is data visualization important?

Do you struggle to understand what is hidden behind your reports due to tons of confusing, indigestible numbers they’re flooded with? If the answer is yes, then it’s time to make use of data visualization techniques and tools, which help to bring advanced analytics to non-technical users in an approachable format. Customized dashboards could save your employees from manual monitoring and analyzing the data flow. Instead, the process is automated, and the results are presented in easy-to-understand visual models quickly and efficiently. 

  • Grasping large volumes of data in the blink of an eye

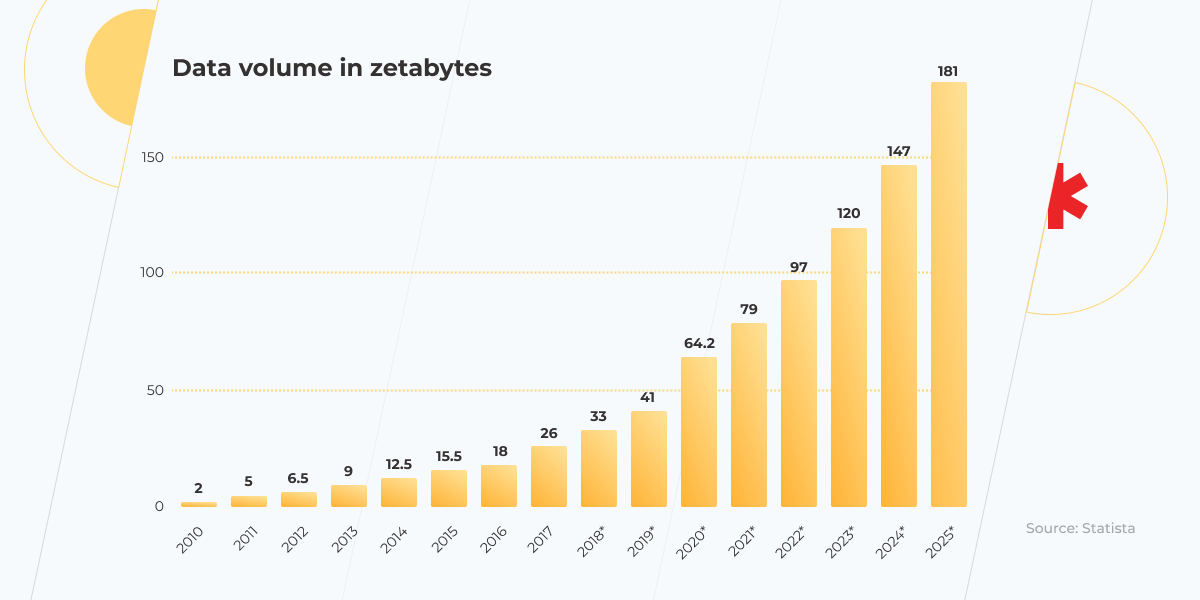
From 2010 to 2020, the volume of data worldwide increased by more than 32 times. In the next five years, it’ll triple. It’s getting tougher not to drown in this enormous amount of information and define which data is overriding and valuable for a particular business, and which can be left behind. With well-thought-out dashboards and appropriate techniques for data visualization, a single graph can perfectly illustrate a complex data set.

data vizualization

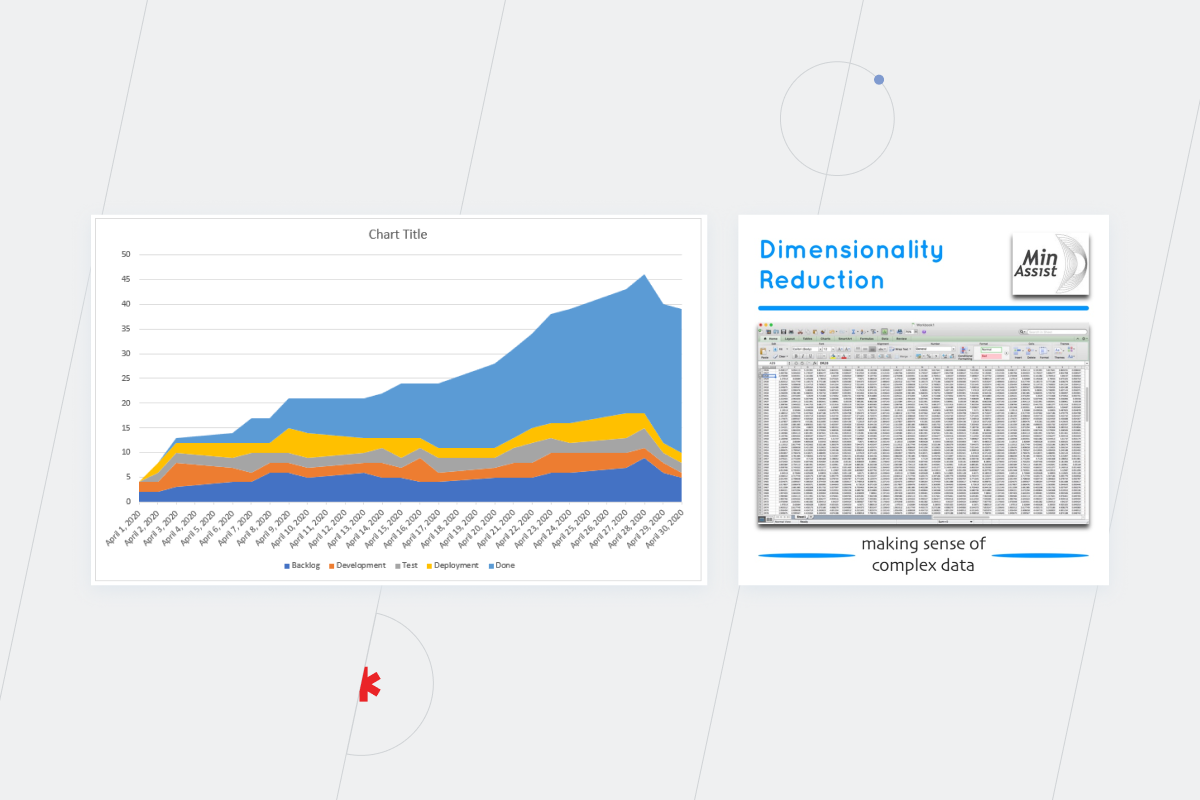
If you want to benefit from big data, make sure that your employees can work with basic visualization models for one/two-dimensional information and complex solutions for multidimensional data.

  • Real-time reporting

There is no need to wait for a monthly or quarterly report to check how things are going on a project or in the company’s departments. You can monitor multiple organizational metrics using real-time analytics techniques to analyze and visualize streaming data. Such transparency enables almost instant decision-making capacity. The faster you understand your data, the quicker you can act and succeed from it.

  • Encouraging communication and collaboration 

Do reports in a raw tabular format appeal to all the stakeholders on your project? The answer is probably no. Visual methods of data presentation will help you be more persuasive, engage all the team members in discussion, and make the viewers feel comfortable speaking and acting. 

  • Improving and accelerating decision-making

Imagine that you are testing a new market with an application and planning to profit from it over a certain period of time. There is no need to wait to understand whether the project is worth continuing to invest in. Using visualization techniques, you can track data changes in near real time and uncover trends and patterns. 

It’s also far easier to analyze dependencies and determine risks at every project stage, even with basic data visualization techniques. You don’t need to waste your time looking through numerous reports with specific categories but, instead, can combine them into one report. Above all, thanks to multidimensional data visualization techniques, you’ll be able to create visualizations of various possibilities and select which one will work for your business. 

  • Uncovering hidden patterns that could be barely deciphered from numerical data

Data in a visual format speaks louder than alternatives. Unobvious interrelationships, weaknesses that need to improve, and anomalies to correct — everything that used to be hidden behind tons of Excel rows becomes crystal clear when visualized in the right way.

What are data visualization techniques and how to choose the right ones?

There are more than 160 types of data visualization techniques out there. The only way not to get lost in such diversity is to know exactly what you are looking for. To choose a data visualization model that fits your requirements and expectations, first, you need to decide on the type of dashboard. 

Types of dashboards: correct choice helps to upswing the effectiveness of each department and employee

Operational, Analytical, Strategic — these are three types of dashboards that can be identified according to a decision-making level. But how do you know which is the best fit for you?

  • Operational dashboards

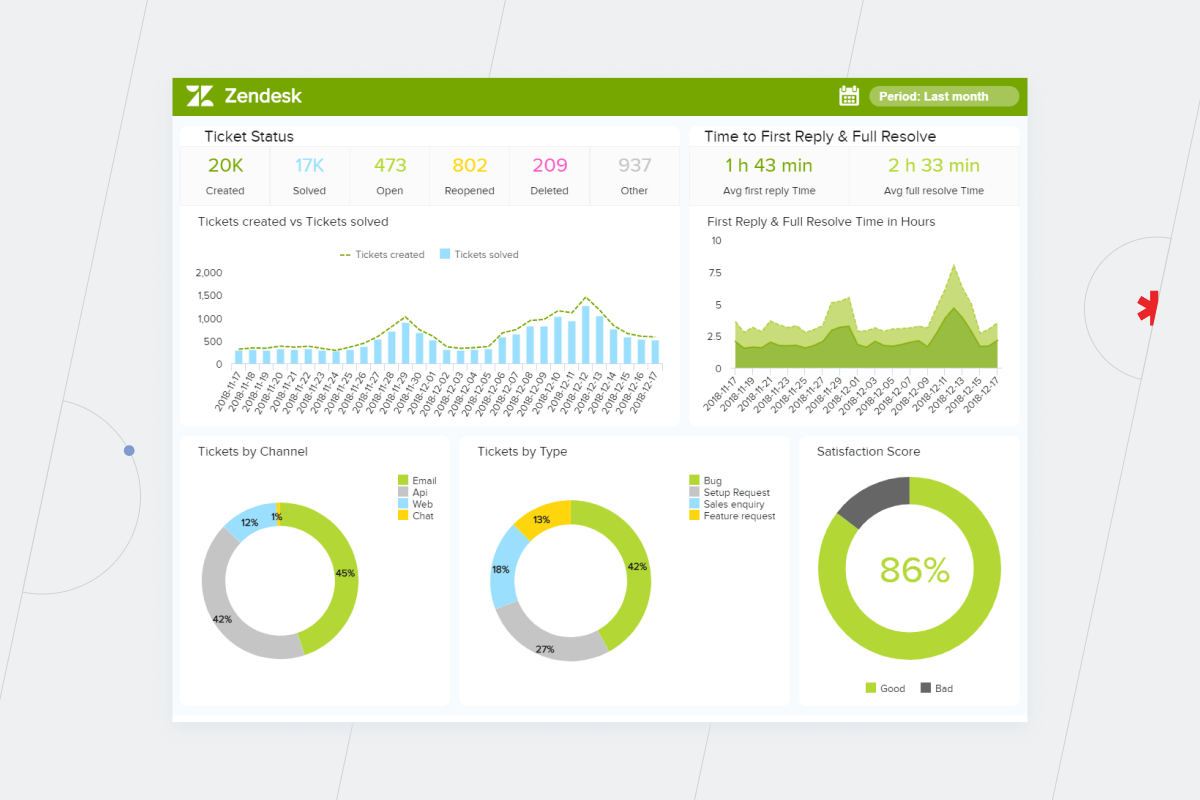
Employees from different departments within an organization use operational dashboards to track a present state of a project, manage their current activities, etc. Such tasks require detailed visualizations that update in near real-time. E.g., a help desk dashboard can contain the number of tickets for the day, the number of resolved issues, and the percentage of requests by type and channel.

data visualization
  • Analytical dashboards

Analytical dashboards supply a business with a comprehensive overview of crucial data. Without them, the amount of time an analyst wastes on collecting the information grows exponentially. Dmitriy Borovik, a BI analyst at *instinctools, proves the point:

We were approached by a media-services provider about optimizing the speed and flexibility of their report generation. Before deploying self-service BI, an average day in the life of their data analyst was filled with addressing advertisers’ requests for information such as “What types of content are popular and where? How many users came from which countries? When was the viewing peak during a certain period?” 

To give proper answers, the analyst needed to assign a task to the programmer to write a new SQL query into the database. It took forever because every additional query might overload the server. When the data finally arrived, the programmer sent it back to the analyst. And this was still not the end of the highway to hell. After receiving the data, the analyst converted it into Excel and added explanations to the numbers. Altogether, these types of tasks used to take a couple of weeks!

With the custom analytical dashboard that the *instinctools’ team created for our client, these processes were automated, and time spent on the report preparation was reduced to a few minutes. 

Analytical dashboards provide a comparison of periods and categories, so they are more complicated than operational ones. When department leaders make decisions, they might need more elaborate solutions created with multidimensional data visualization techniques.

Expanding the number of dimensions and transforming the perspective from 2D to 3D allows users to see that reality is more complex than it initially seems, so there’s a small chance of making inaccurate decisions or missing key insights.

  • Strategic dashboards

Representatives of senior-level management may be honestly interested in each department’s operational details. Yet, if they run a large enterprise, they are unlikely to have time to delve into them. That’s why C-suites need dashboards that contain only the most important statistics. 

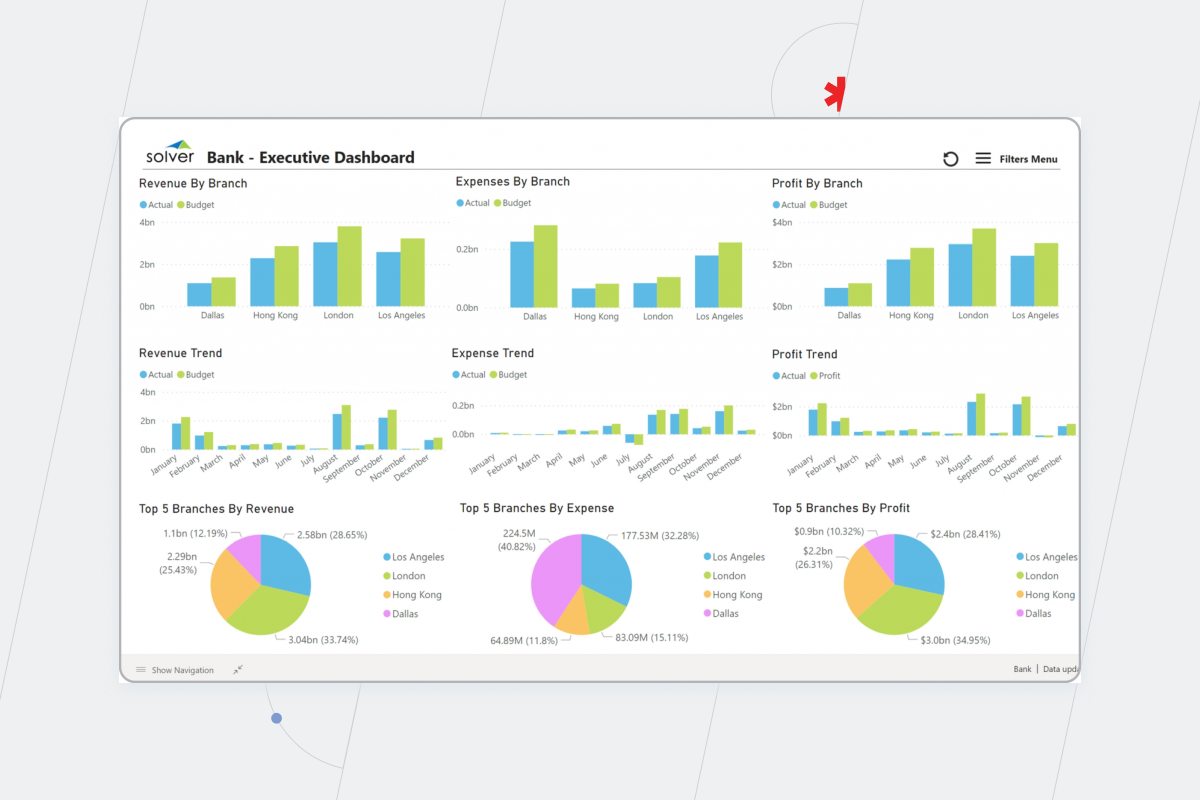
Essentially, the higher the decision-making level is, the less cluttered the data visualization should be. Here is an example of an executive dashboard for a bank with the key metrics such as revenue and expenses by branch, and top-5 branches by profit. The CEO can understand the state of an organization in a bat of an eye and decide which branches are worth investing in for the next quarter.

data visualization

Data visualization techniques

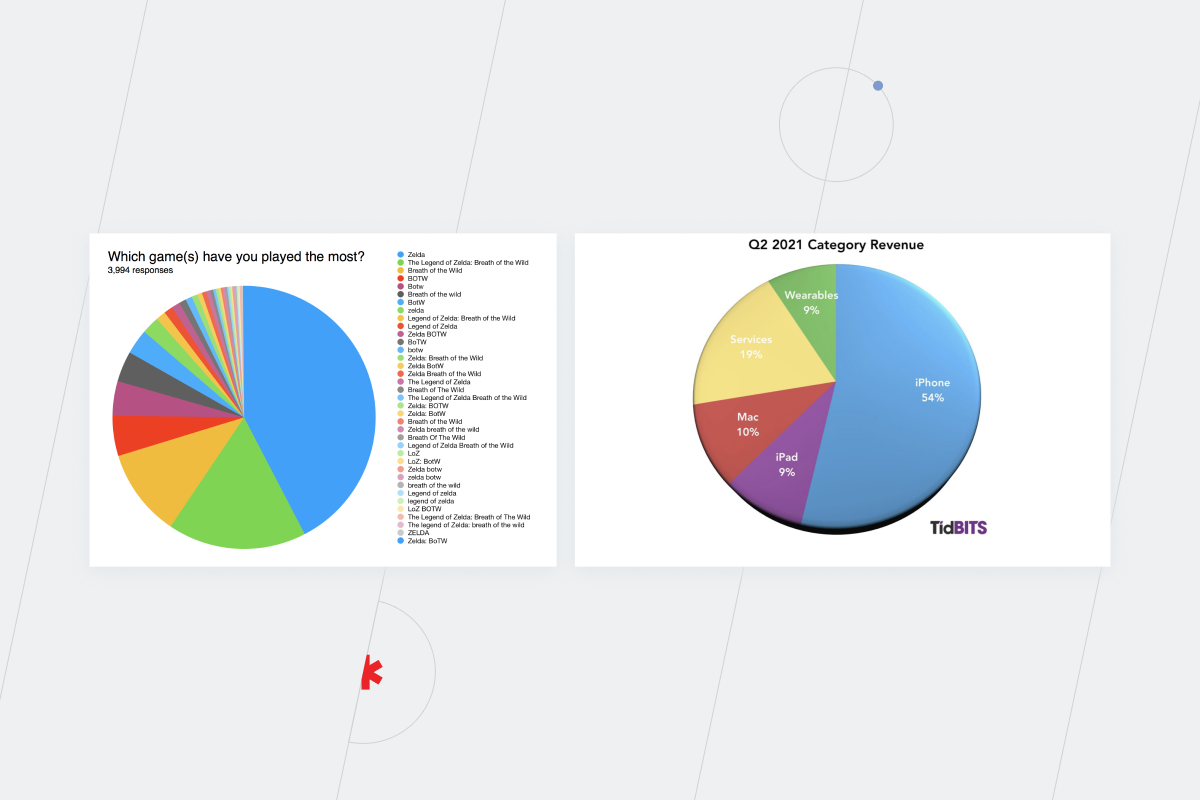
Data visualization is only helpful only when it’s thought-provoking and not just filled with data for data’s sake. Take a look at those two data visualization examples of pie charts. 

Which games have you played the most

They are both analytical and illustrate the audience by country. However, the first chart contains the most valuable data, while the second visualization tangles the users up with too many variables. The central concept of data visualization is to illustrate only essential information. There is no need to pack your reports with all the data you have. If visualization is inconvenient, it’s incomprehensible and useless. Make sure not to make these common mistakes in data visualization.

Top-3 data visualization tools. *instinctools version

Three BI platforms have been leading in the last four years (2018, 2019, 2020, 2021), according to the Gartner Magic Quadrant for Analytics and BI platforms — Power BI, Tableau, and Qlik.

  • Power BI

Power BI evolved from Excel, which is its fundamental advantage over other data visualization tools. It’s far easier for employees to implement data visualization concepts in their everyday tasks because the Power BI is similar to Excel and integrates with other Microsoft applications. Also, Power BI has a data preparation tool — Power Query, but it is available only inside the Power BI ecosystem. Take into consideration that the maximum amount of data for a premium account is 100 TB, and the maximum number of data points is 3,500 and you’ll see just how powerful it is.

Power BI is a good choice for organizations that are about to start their data-driven journey and need a reliable tool to do the job.

  • Tableau 

Tableau is a powerful and rapidly growing visualization software in its philosophy and architecture. Tableau also has a data preparation tool — Tableau Prep. With it, even non-technical users can select, prepare and visualize data. The information can be uploaded wherever you need it, to Excel or a separate database. 

The tool is unlimited by the number of data points and volume of data but keep in mind that it’s not as intuitive as Power BI. Tableau is a top solution for organizations that regularly work with big data sets and need multidimensional data visualization techniques and tools.

  • Qlik

You can combine different Qlik products to deepen the data discovery process. It also integrates with a broad range of data sources such as Amazon Vectorwise, Redshift, Hadoop, etc.

Qlik Sense can be deployed in the cloud or on-premise. The interface is intuitive; you can drag-and-drop items to manipulate dashboards and apply visualizations instead of writing a code.

The Qlik platform offers a data preparation tool — Qlik Replicate. It provides automated, real-time data integration across data lakes and DWH, databases, streaming, and mainframe systems. 

There are no rigid limitations about how much data Qlik can handle, except two billion distinct values in each field. The number of fields and data tables is limited only by RAM. 

Tips to get started 

  • Determine what kind of information you want to communicate to choose an appropriate technique for presenting your data. Take into account the stakeholders’ needs as well.
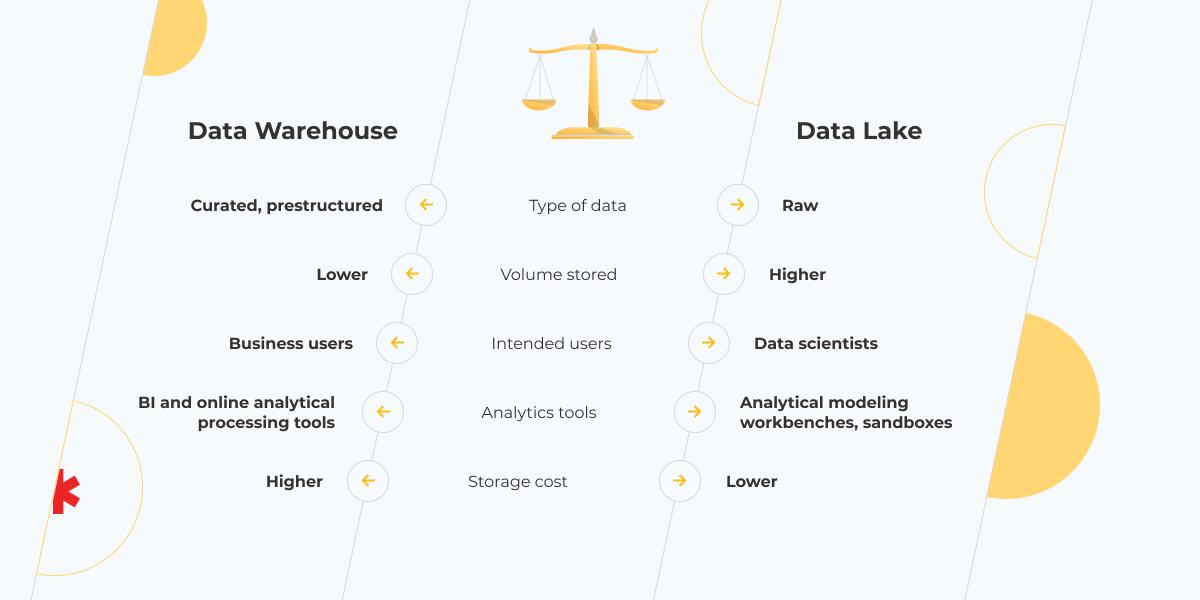
  • Understand the data you are going to visualize, including its size and cardinality, and consider (honestly) the data preparation effort that will be required. In the technology stack, data visualization goes after a data warehouse or data lake. So, fast and insightful data visualization is only possible when paired with a solid data infrastructure that supports it.
  • Define the goal you are trying to achieve with your data visualization. For example, a complex analysis requires data to be compiled into controlled, dynamic dashboards, while if you just want to highlight a single data insight every now and then, one graph or chart might be enough. But don’t go to extremes and don’t get in the trap of presenting any information as visualization. Sometimes building a chart or diagram for each tiny table in a report is a waste of time and a simple sheet in Excel is enough.
  • Figure out how your audience processes visual information and adjust data presentation to their needs. Despite all the principles and theories about effective data visualization, the reality is that the most effective visuals are the ones the audience connects with.

A well-thought-out choice of data visualization techniques and tools support building data-driven decision-making

Choosing the proper data visualization techniques from a wide array of options as well as deciding on a suitable tool for their implementation might turn out to be more tricky than it initially seems. You should consider the decision-making level of employees that will use data visualization models, quality and quantity of data, types of visuals that are the simplest for the company’s audience.  

Our designers and data consultants will make an effective contribution to your data visualization project so that you get a high-resolution view of your actual business state.

FAQ:

What are the key components of data visualization?

Data purity is a primary condition for effective data visualization. You can’t appropriately select techniques for data visualization and get actionable insights if data is messy and unstructured. And the proper choice of techniques and tools depends on the type of dashboard according to the decision-making level of a person who will use it — a C-suite, department leader, or an ordinary employee.

Where is data visualization used?

You can use data visualization basic techniques and tools in any department of your organization and on any level of decision-making. Businesses of any size, from start-up to enterprise, need BI solutions. After all, data is the future. The only question that remains is how to choose the appropriate type of dashboard and models of data visualization.

It’s Never Too Late Until It Is: Making Most of Cloud Computing Performance Testing

Cloud computing delivers significant benefits to its users. It enables the scalability, speed, and agility crucial for delivering exceptional digital experiences. However, does this mean that you can gain all these advantages by simply moving to the cloud? No. Your cloud provider simplifies many details, of course. However, to leverage cloud possibilities to their fullest and not to be caught off guard by unanticipated challenges, you shouldn’t overlook a critical component: performance testing of cloud-based applications.

What happens if you don’t test your cloud performance?

What’s the worst that can happen if your cloud performance is not tested in an appropriate way? It depends, but the options are not promising at all. No more than six hours was enough for Facebook to lose about $65 million and taint its reputation — the company’s family of apps, including WhatsApp, Messenger, and Instagram, were unavailable all over the world. The problems that Facebook faced, no pun intended, or maybe, just a little, refer not only to social media giants. Even if your company is not that big and the downtime costs are not that tremendous, losing money and business opportunities is still frustrating and disappointing. 

So, by escaping the testing stage, you jeopardize your business in three ways: operational, financial, and reputational. 

1. Resources need careful monitoring; otherwise, you miss the chance to scale them appropriately to reduce costs

Without regular testing, you won’t be able to prove that your system is reliable and scalable. If you don’t find the bottlenecks in time, you won’t be able to make the right decision to evaluate and change your disaster recovery plan. And this is fundamental for minimizing downtime and the impact on the end-users of the app. 

Using cloud providers such as AWS, Google Cloud, Microsoft Azure, OVHcloud, etc. without understanding the limits of your application might be too costly due to the possibly unnecessary power. Knowing your systems’ “turning points” helps to understand the real capacity needed and, thus, choose an appropriate server. Without performance testing, you won’t find the infrastructure’s limitations, and, in the case of issues, you will most likely have to request a more powerful server from the hosting provider to boost the capacity. But it’s about paying extra money. 

Conversely, adopting performance testing as part of cloud computing allows a business to shorten the time to release new features and improve the system’s flexibility due to cloud providers’ development of new solutions. 

2. Downtimes happen more frequently, and you lose money

Reports indicate that 55% of companies experience downtimes at least once a week. You can look for another statistic in the hope of consolation, but according to Gartner, the average IT downtime costs $5,600 per minute and this money could be used in a much more effective way. Earlier, in the article about the reasons for DevOps failures, we’ve mentioned the case of Knight Capital that went bankrupt in 45 minutes due to failed deployment. It’s a vivid example of when skipping the performance testing phase for the cloud-based application became critical for a business beyond the cloud migration process.

Downtimes might cripple your business, by allowing your competitors to outperform you. E.g., during the six-hour outage of Facebook and WhatsApp, 70 million new users registered in messaging app Telegram, wilfully abandoning the network in favor of quick communication.

Speaking of Facebook, testing is crucial for apps fueled by ads. 98% of its revenue comes from advertisers’ contributions. The outage of the system affects the company by losing advertisers. Also, the organization loses its employee confidence, as they may begin to think of finding a stable company to work in. 

However, it’s not only tech giants who suffer serious repercussions because of system failures. Imagine you roll out a large-scale advertising campaign right before the Christmas season, getting ready for an overwhelming flow of customers and unprecedented revenue increase, but your website or app crashes. Don’t let your opportunities, time, and money go down the drain and ensure a high level of stability for your system.

3. Poor usability pushes customers away, and, guess what, you lose money

The early 2010s, when users could close their eyes to app-related bloopers are long gone. Don’t cross-testing off your priority list if you don’t want to bleed money because of poor performance or suffer public embarrassment after a system crash. 
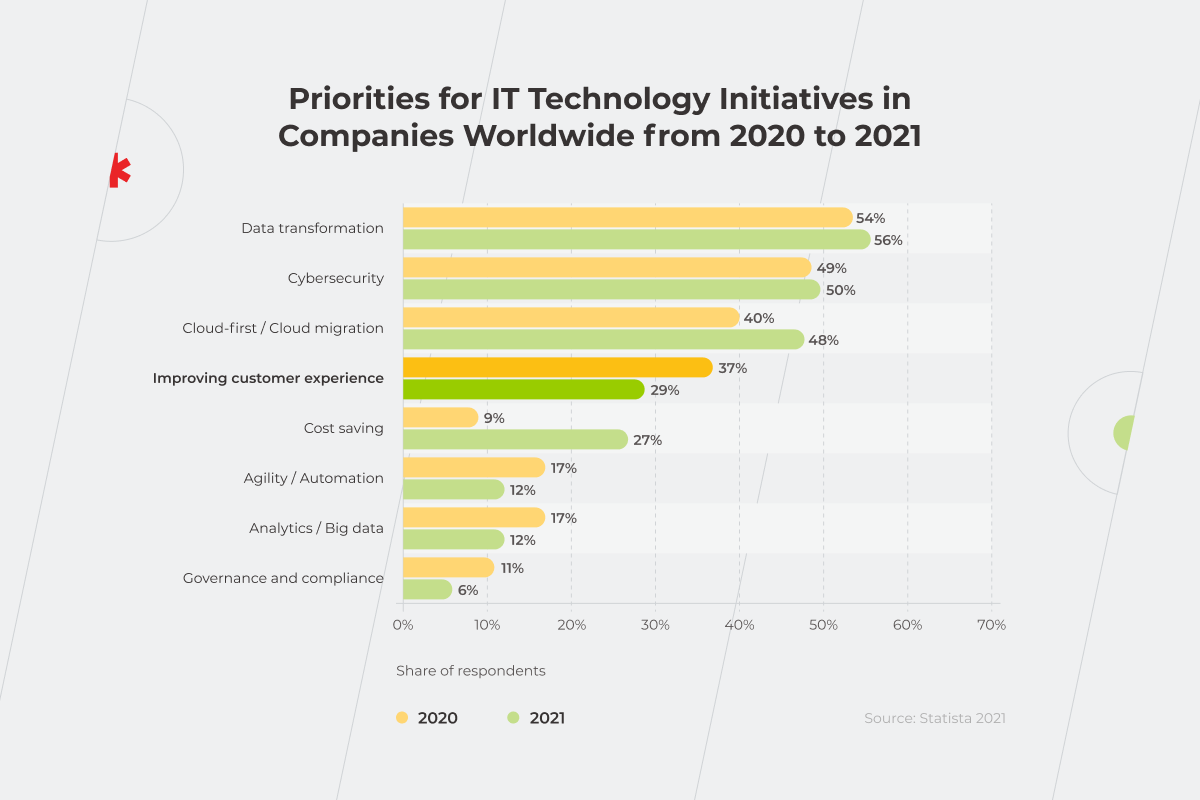
Thanks to performance testing of cloud-based applications, testers can set aside time for in-depth inspections in the security and accessibility of the app for end-users. Don’t miss the chance to make your app more user-friendly and, thus, improve customer experience, which ranks highly as the fourth priority for IT technology initiatives in companies worldwide from 2020 to 2021 after digital transformation, cybersecurity, and cloud migration. 

How to test cloud applications? It’s natural to choose cloud testing instead of in-house performance testing. In this case, you don’t need to pay for the maintenance of a whole infrastructure and pay only for the time of using the infrastructure resources, saving you money overall.

Priorities for IT Technology Initiatives

The cloud performance testing process in six steps

When you’re ready to switch from “Why do we need performance testing?” to “How do we implement it in our workflow?”, it’s time to follow this algorithm. 

  1. Set testing objectives and choose the relevant types of tests 

Speed, scalability, and stability are three key parameters that you should check during testing. Finding bugs is essential, but you should also look for bottlenecks. You can’t see how quickly the app responds, understand the maximum user load it can handle, and check its stability under changeable workload without performance testing. 

Choose the types of tests to run first according to your goals: 

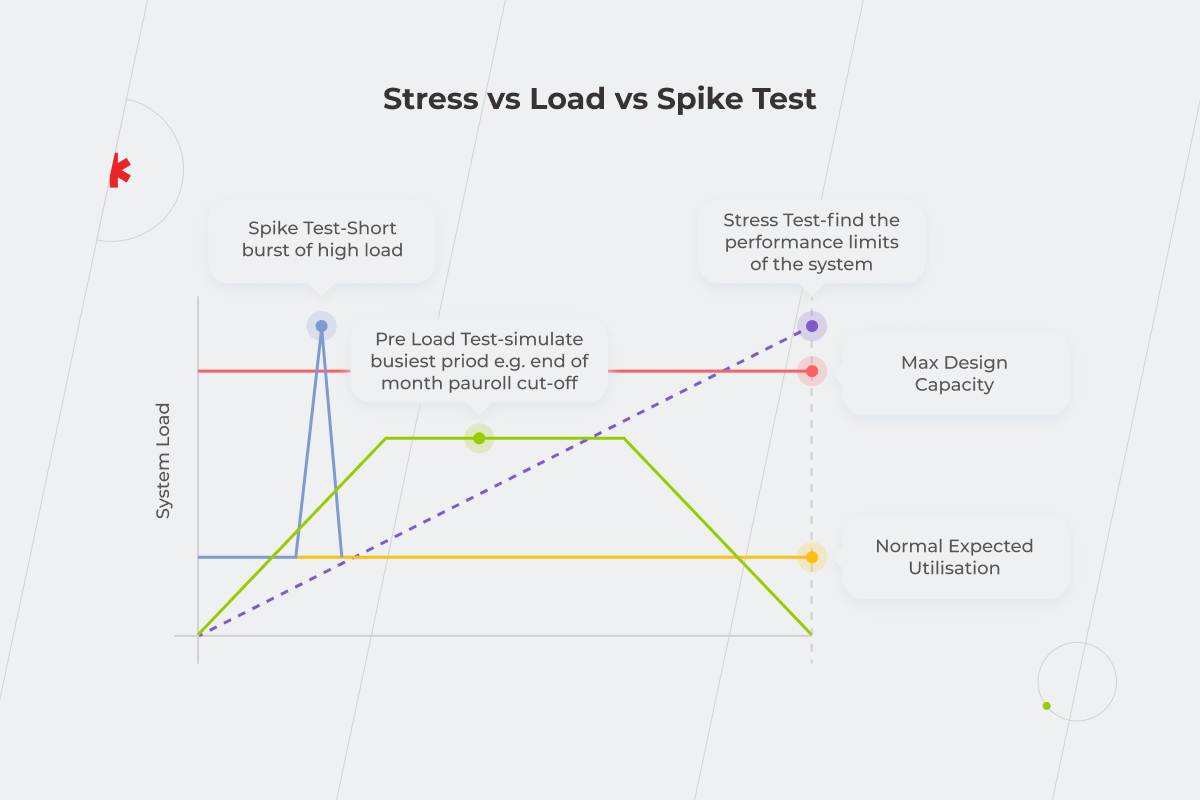
  • Load testing in cloud computing is used to verify the system’s quality criteria. Is your system’s performance on the right level to be used by multiple users simultaneously? Find out with a load test in which testers induce a normal or expected workload to the system and observe its general behavior, throughput, and latency. 
  • Stress testing is about a steadily increasing higher-than-expected workload on the system. To describe the application capacity, QA engineers need to know when, where, and how your system breaks.
  • Spike testing is similar to the previous types, but it identifies how the app can handle rapid traffic overload. Such an approach helps take a fresh look at the usage of the elasticity of the cloud. 
  • Failover testing in performance testing is needed to prove or disprove if the app can provide extra resources and replace a failed component under the heavy traffic load. At the same time, the end user’s experience shouldn’t be affected, and that’s the main focus here. 
  • Scalability testing is a series of stress tests to measure if the system can translate additional resources into additional capacity. So, you can define and remove bottlenecks or just use more resources to temporarily fix scalability issues.
  • Availability & Resilience testing is needed to check specific processes under the load. E.g., testers can audit if database migration, deployments, or automatic scaling environments are doable under variable workload levels.

Take advantage of cloud consulting with *instinctools experts to identify the most relevant types of tests for your business to run.

Test types

2. Design user scenarios

With the help of product owners and stakeholders, you should select relevant user roles for cloud computing performance testing. Based on this information, test engineers design user scenarios for the key user roles. E.g., for an e-commerce solution, you can define the roles of a guest or logged-in user, new buyer, or regular customer. According to this, you can use such basic scenarios as registration or signing into an account, searching for products and viewing detailed information on their pages, adding items to the cart, or reviewing previous purchases to focus the tests on.

3. Identify key performance metrics and design the tests

There are several essential metrics to track:

  • Requests per minute

When should you boost the capacity of the cloud resources to use them most beneficially? To adapt your system to a changeable workload, you first need to define the cyclic increase of requests rate in different periods and predict the following increases. 

  • Time to acknowledge

Knowing the time it takes for your system to respond to a request is necessary to uncover problems with load balancers. Also, a slow time to acknowledge may mark that the system is underprovisioned. Keep an eye on each cloud region since latency issues can differ from one cloud region to another. This approach will save you time and help pinpoint any issues. If the system is running well, you can go the extra mile and think about minimizing latency. For this, compare the time to acknowledge when a given request is handled and not directed by a content delivery network (CDN). 

  • Response duration

 Being defined by load testing in cloud computing, this metric represents the time it takes the system to respond to a request and helps indicate if the application can handle the incoming workload. Apart from that, response duration can uncover issues with internal communication, such as the inability to communicate between different microservices inside the system.

  • Error rates and types of errors

 You can use them to keep track of the application’s overall health and the cloud hosting environment.   

  • Servers and nodes available

You should monitor the number of available servers within the total amount that you have. It’s better not to rely only on cloud orchestration and automation tools. Although they might be good at redistributing workloads from servers that crash to well-functioning ones, you need to ensure that the number of available servers doesn’t fall below 90% of the total deployed. Because if it does, there’s a problem with your cloud server instances that you can’t ignore. 

Note that you don’t necessarily need to constantly keep a check on all these metrics. But instead, focus on the ones most crucial to your business. 

4. Configure the test environment

Performance testing of your cloud-based application won’t be effective if the test environment isn’t as close to the real conditions as possible. At this stage, you should also arrange tools to run near-realistic tests.

Real users’ activity may change the test results and it would be problematic to identify reasons for bottlenecks, and, thus, eliminate them. So, don’t forget to make sure the test environment is isolated.

5. Run the tests

Run the tests, collect the data, and ensure that testing is a mandatory stage of every release of your app. It will save you money and your reputation in the long run. 

6. Analyze. Improve. Retest

Analyze the data to get insights into the robustness, availability, and scalability of the system. To identify bottlenecks, check the results in every iteration, and share them with your team to think of ways to remove barriers, improve performance and the system as a whole. Then, tune the test plan, change the application’s infrastructure if needed, and test again. Still have something to improve? Repeat the cycle.

The reliability of test results: how to ensure them?

There are three tips to be done:

  • Make sure that test and production environments are as close to each other as possible. E.g., the test environment should include the same number of database records as the production environment. Think of a cloud-based test environment because, in that case, setting up a test environment is cheaper and faster — you can reduce costs and save time.  
  • Take care of sufficient network bandwidth. Its low level can undermine the results of testing because of time-out errors due to user requests.
  • Consider removing the proxy server from the network path. While it’s running, the users will get data from the cache and stop requesting the server. This situation can lead to a slower response time. It means you won’t be able to run the near-realistic tests. Cloud computing performance testing is a heavy hitter only if it gives you a valuable result. You can resolve this issue in two ways: transfer the web server to a secluded environment or strike directly to the web server (include server IP address to the HOSTS file).    

Cloud computing performance testing tools: *instinctools suggestions

The tools can differ according to their accessibility. Some are suitable both for small companies and enterprises, and others are targeted mostly at tech giants. So, be aware of your organization’s size and the most frequent types of performance tests. Here are the recommendations of our engineers to help you choose the tools that match your needs:

  • Apache JMeter. With it, you can test Java-scripted and web applications for both static and dynamic resources. Consider this option if you need to simulate a heavy load on a server or a group of servers, objects, or networks to analyze its performance under various load conditions or test its sustainability and scalability. Due to the open-source format, this tool is accessible to software organizations of all sizes, from start-ups to enterprises. 
  • BlazeMeter. It’s an enterprise-ready tool. Except for creating new load tests, it allows you to reuse existing scripts. To improve your software performance, use BlazeMeter’s detailed historical reports. 
  • Gatling. This open-source tool for performance testing of cloud-based applications is able to simulate thousands of requests just with a few load generators. Gatling’s dynamic automated reports can be useful even for employees without data-oriented hard skills because the information is organized in an easy-to-understand way.
  • LoadStorm. Test and manage the performance of your entire cloud infrastructure under excessive load. It’s useful for stress and failover testing. 

Take care of in-depth performance testing of cloud-based applications to secure your business

Here’s the thing with the digital era: performance is EVERYTHING. Whenever your application or a website fails, so does your company. It’s not enough to choose the proper tools for the successful implementation of cloud computing performance testing. Define the goals to select the relevant types of tests to run and metrics to monitor. 

Want to make sure that whatever happens your system can function without any hiccups?

Drop us a line!

FAQ:

What is cloud performance testing?

Cloud performance testing is an alternative to in-house testing. It allows organizations to check how stable and scalable their application is without influencing the end-users experience and usability. Performance testing of cloud-based applications can be used to monitor the general behavior of an application and find bottlenecks and “turning points” to understand the capabilities of the system. 

What performance test tools are not available over the cloud?

Generally speaking, all current performance testing tools are available for testing in the cloud. Otherwise, they’ll lose in the competition for the customers. Here are some tools that support both cloud and on-premises testing:
– WebLOAD
– Kobiton 
– StresStimulus, etc.

Why Every Company Needs a Big Data Strategy and How to Build it

Big Data is gaining traction among various industries. According to IBM, people produce 2,500 trillion bytes of data daily. 50 billion IoT and other connected devices gather, analyze, and share it (as CISCO states). Big Data unlocks an excellent opportunity for big insights — available for companies of any domain and size. And this is where an efficient Big Data strategy becomes pivotal. 

It’s like aiming at a target and getting a 99% hit because you know where, when, and how to shoot in the most optimal way possible. Big Data makes those “shots” laser-focused, which brings about much more appealing results.

Why is a Big Data strategy important?

Big Data Analytics

Big Data should no longer be regarded as an afterthought. Using the information outside your company’s own data sources, it perfectly fits in your business intelligence solutions and expands the comprehension of the market and customers. The companies that will stay afloat — and ultimately lead the pack — will be the ones that put Big Data amongst such priorities as revenue, profitability, and customer experience. 

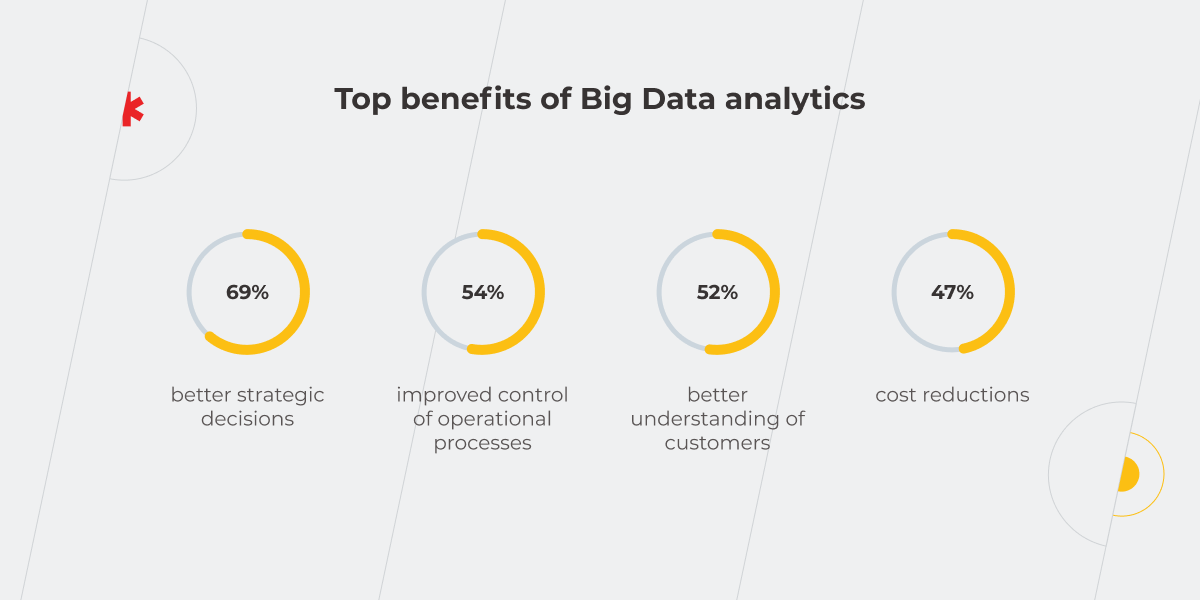
According to the Broadcast Audience Research Council, Big Data solutions contributed to better decision-making (69%), improved customer experience (52%), and significant cost decrease (47%). What’s more, companies bragged about an 8% increase in revenue and a 10% cost reduction because they treated their Big Data properly.

Therefore, adopting a proper Big Data business strategy makes all the difference in the directions that define business success. But how is this exactly? Let’s find out. 

Data-driven decisions

At present, most companies analyze 12% of the information they gather from different sources, while 88% of it stays untapped. Had it been analyzed, it would remove the guesswork and improve the decision-making significantly.

Let’s take an example from marketing. 99% of organizations consider data an integral part of marketing success. Marketers can work out plans strategically based on constant insights from a broad range of meaningful data sources. 

As for sales, an effective Big Data business strategy allows sales leaders to operate with more factual sales forecasting data. There’s an immense value in revamping time use among the sales team, enabling them to concentrate on clients most likely to purchase. 

Improved internal operations

It takes tons of hours or even days for employees to find the necessary data and process it. When asked to retrieve data to make a decision, only 3% of employees can do it quickly. Big Data, herewith, streamlines operations, exposes inefficiencies, enhances quality control, and drives improvements in every line of business. 

Customer service, warehouse management, inventory management, sales — any department can benefit from improved operational processes ensured by a viable Big Data strategy.

Customer-centric approach

Customer-level data sets allow mapping and tracking customer behaviors, needs, and wants across interactions, operations, and transactions. They embrace the whole customer base and span the customer journey, which allows companies to grasp a perfect understanding of customer experiences (CX). That’s why, after scrutinizing its 100 million subscribers, Netflix managed to influence 80% of content consumed by viewers thanks to proper data insights.

When combined with analytics, Big Data sheds light on outcomes such as loyalty, revenue, the cost to serve and helps predict individual customer satisfaction and business efficiency. What’s more, CX management can evaluate the ROI for specific CX investments and align CX initiatives with business outcomes.

The flip side though is that the more available personal data becomes, the more anxiety-provoking the situation is for users. In an age when personal information is the currency that people give for online content and services, innocent competition for customers’ attention has turned into obsessive spying on them. And this is definitely not where Big Data should be headed. 

Apple was one of the tech giants who decided to change the direction and give users the choice of whether to be tracked or not, by introducing a pop-up window for iPhones that asks people for their permission to share their information with third parties.

Meanwhile, Facebook messed up (again). The company’s WhatsApp was fined nearly $270 million for not being transparent about how it uses data collected from people using the service.
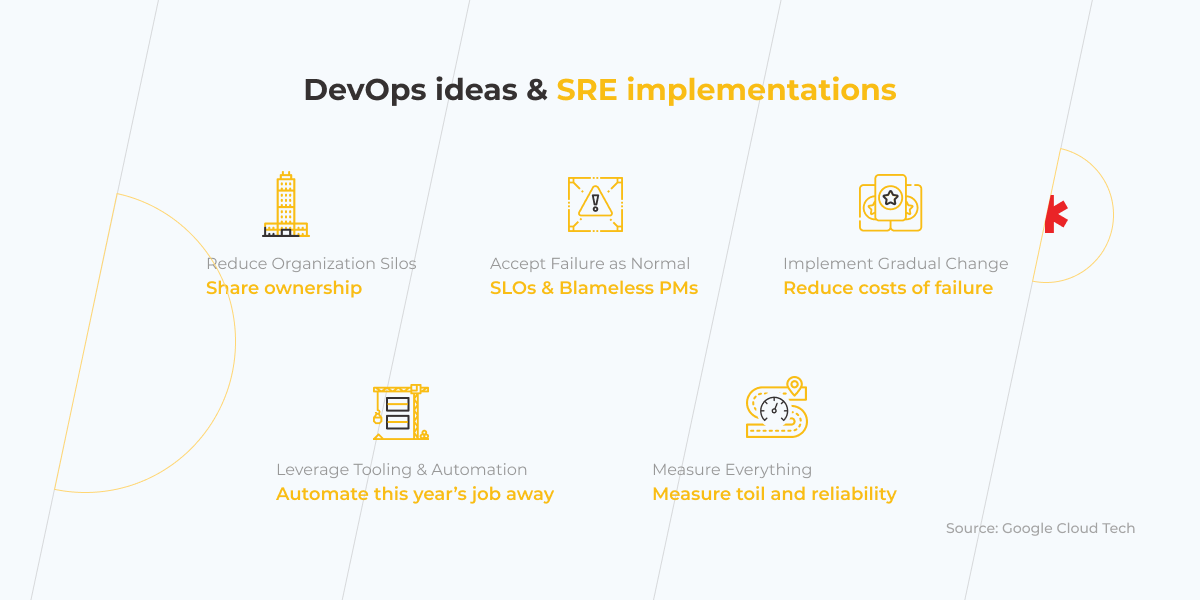
Not to grapple with fallouts of putting users’ personal information at risk, businesses need to be privacy-conscious while implementing Big Data. Partnering with technology companies, which ensure their solutions comply with privacy policies seems like the best bet. 

Reduced costs

Business intelligence strategy and Big Data analytics can change the costs landscape drastically. Executives face storage costs, processing costs, people costs, software costs, etc. Big data deals with these torrents of data in near real-time, pinpoints waste and helps define accurate costs. 

A great example is ad campaigns. It’s always essential to have proper market strategies that appeal to end customers. Big data makes this understanding possible. Otherwise, companies have the risk of wastefully spending their precious ad dollars.

Five key steps to deploying a Big Data strategy

Big Data Strategy

Big Data adoption might seem challenging primarily due to the lack of relevant expertise within the organization. Executives feel anxious over finding, hiring, and training Big Data professionals. Besides, there’s a particular difficulty in aligning a new business trajectory with the existing goals of the organization. Here are five steps that might help with the Big Data implementation project plan.

Define your business goals or business problems you’d like to solve

Before embarking on Big Data adoption across the organization, the C-suite should ask where exactly Big Data is needed in the first place. How does it help with that specific problem? Or, does it contribute to the overall business goals? 

As Big Data is designed to deliver value by leveraging data, the Big Data strategy needs to tackle key business problems and contribute to the corporate business goals. Here are the initiatives where Big Data can be applied:

  • Understanding customer persona
  • Prediction of sales
  • Analysis of data from different sources
  • Identification of financial risks
  • Pinpointing of fraud activities or logs
  • Tracking of feedback on socials, customer loyalty, Ecomm marketing metrics
  • Identification of correlations between many independent data sources

Get a highly skilled team

The right distribution of roles and skill acquisition is integral to Big Data strategy. This is where the HR department is a king. First, it would be wise to assess employee resources. You shouldn’t underestimate your current employees — reskilling and upskilling usually make sense. However, if you feel like you don’t have enough talent to build an in-house Big Data dream team, there’s always the option to attract BI consultants from outside that will help you leverage your data to the fullest. 

Execute a current state assessment

An estimation of your company’s current state might address the organization’s assets, sources, processes, capabilities, policies, etc. It is essential to develop an accurate data strategy roadmap that supports what the company aims to be in the future and describes what it is now. Usually, this process requires consultations or interviews with key employees, especially those from clientele targeting and retention, IT functions, and marketing. 

For instance, it would be reasonable to gain a good understanding of existing and potential customers when it comes to customer outreach. This becomes doable by evaluating business processes, data architecture and assets, data gathering capabilities, and different policies that affect customer attention and retention. 

In the case of data safety, you should start the process of a thorough investigation of current data processes, infrastructure, and policies to build an effective strategy. 

Identify what data you need to answer your questions

Deciding on what data is necessary depends on the blind spots businesses need to uncover. What are they? This could be the lack of a full understanding of a customer profile to appeal to when launching custom campaigns. Or, sales leaders might need answers here and now about current critical aspects of business processes.

The operations side of the company, for example, must answer tons of questions that come down to inventory, production, and the supply chain. This data is being captured in an environment enterprises support and manage. The finance department is going through the same processes. Thus, all departments have different use cases, different information, different questions based on revenue costs and clientele. 

Choose the right technology for every stage of your data strategy roadmap

According to Forbes, 95% of organizations need to do something about unstructured data. This is where Big Data software, CRMs, and different productivity tools come in handy. Here’s what the roadmap includes:

  • Collecting data. The companies gather data from tons of sources like business transactions, industrial gear, socials, IoT devices, and so on. Thus, finding the right technology for this very step is crucial.
  • Storing data. Big Data projects require powerful resources for storage. This is where Big Data technologies meet cloud computing for a better, cost-efficient way to deal with all kinds of data. 
  • Processing data. The tools that allow this could be a real-time distributed tool for capturing data streams, open-source NoSQL database, etc.
  • Communicating insights from data. Nowadays, the term ‘democratization of data’ has appeared in the arena. This means not only should data be captured, ‘digested,’ and stored, it needs to be available to all involved in the most optimal manner possible. 

Start generating business value with Big Data 

Big Data

The use of Big Data for the competitive advantage of the company is not optional today. It proved its efficiency across departments and processes long ago. That’s why a good Big Data strategy is simply a must to make well-informed business decisions, improve internal operations and customer experiences, and drastically reduce costs in every business line.
Yet, many companies grapple with the lack of expertise in the domain and need proper assistance from the zero phases to freewheeling. 73.4% of organizations confess to having struggles with the integration of Big Data and AI initiatives. So turning to experts, who are good at creating value with big data analytics, might become a game-changer. Our BI team will develop a Big Data strategy that aligns with business goals, capacities, and resources and will be there at every adoption phase.

FAQ:

What is a Big Data strategy?

First and foremost, Big Data is useless without a Big Data strategy. The latter defines the ways data will be exploited in practice and what kind of data management might need to reach particular corporate objectives.

Since more and more data is created and gathered, Big Data is becoming increasingly complex. The only way to benefit from it for particular business goals is to develop a Big Data strategy intentionally.

How is Big Data analytics implemented?

The implementation might comprise the following stages:
1. Deciding on the data analytics strategy
2. Aggregating the right data
3. Selecting the right productive tools
4. Mapping out an analytical process
5. Teaming up with useful services like cloud computing for better storage, etc.
6. Running a pilot initiative
7. Embedding analytics into decision-making
8. Making essential data available to the whole team
Note, the best practices for Big Data analytics might vary according to a business’s particular nature and this is normal. 

How to use Big Data analytics to grow your business?

To make a business shine amongst competitors, you can use Big Data in the following ways:
– To fix inefficiencies and spot opportunities for growth
– To contribute to innovation and improved design
– To revamp customer experience
– To tackle risks and fraudulent activities

How To Build a Robust Data Infrastructure

The world of data is filled with promising quotes, such as “information is the oil of the 21st century” or “data is becoming the new raw material of business.” However, the value ingrained in data only becomes vivid when analytics solutions come into play. 

Before analytics can start, data needs to be prepared. This stage is a foundation for efficient and effective analysis. And this is where data infrastructure enters the battlefield. 

Consisting of data assets and processes about how to manage these assets, data infrastructure plays a significant role in transforming data into usable information and paves the way for it to turn into insights. 

In this article, we navigate you through the practices that ensure your data infrastructure supports your analytics needs so you save your valuable time and resources.

Break down two significant barriers to your data analysis with a robust data infrastructure

Perhaps, in a unicorn and rainbow-like utopia, data is perfect by default. However, in real life, it’s not like that at all. There are a couple of things that can go wrong even at the very first stages of constructing a data infrastructure, these include:

  • Data accessibility
  • Amount of data 

The second occurs when a company scales up, but the first one is relevant for companies with any scope of data, and crucial to ensuring effective data analytics processes.

Data accessibility 

It doesn’t matter how clean and organized your information is if only the engineers that currently work on the product can retrieve it. In this case, reports tend to take weeks. According to Broadcom’s research on the state of Big Data Infrastructure, over half of respondents have already implemented Big Data projects and 29% are planning to start implementing them.  

When you don’t have a business intelligence (BI) platform in place, the interaction with the data goes like this: your engineers extract the information required from a data lake or a data warehouse, or from somewhere else, and pass the data to analysts. Conversely, with mature BI solutions, this stage is automatized, making it easier to get the data you need when you need it. 

That means, if your goal is a data-driven company, you need to build an infrastructure where everyone in the company has access to a particular data network and can analyze it. 

How do you ensure data readiness? You need a well-thought-out data strategy and a clear understanding of how this data will be handled. Security requirements and security policies should always come first during the project and the implementation phase of the data strategy.

Amount of data

The total amount of data created in 2020 reached 64.2 zettabytes. In 2015 it was only 15.5 zettabytes. The data volume growth during the last year is mind-boggling and has only accelerated due to the pandemic, as more people than ever before have started working and studying from home. This situation became a challenge for data engineers, who were expected to build a new infrastructure to handle such a huge amount of data and get ready for exponential growth in the future in such a short space of time. 

The more information you have, the more complex the architecture of the serving infrastructure will be. Data engineers need to seamlessly combine two tasks: rebuild existing data infrastructure and try not to become buried under the ever-increasing data flow. 

The amount of data will naturally grow over time — that’s a fact! According to Statista, by 2025, data creation all over the world is expected to increase threefold (more than 180 zettabytes). Without implementing a proper data infrastructure in your organization, it will be troublesome to grow and stay competitive among other companies. So the best time to start preparing your data infrastructure is now.

amount of data

Five must-do tips for building a robust data infrastructure

There are no ready-made solutions for data infrastructure, but here are five areas to focus on:

  • Define your data infrastructure strategy. You need to have a clear idea of where you’re going to store your data.
  • Choose a repository to collect data. How do you want the information to be presented? 
  • Clean data and optimize data quality. Be prepared for the fact that it’s not realistic to expect to collect only clean data.
  • Build an ETL pipeline. Take into consideration the constantly increasing requests for analysis of new information and make your pipeline ready not only for basic scripts but for more complicated data challenges. 
  • Take care of data governance. This is a key enabler of your data value.

Define your data infrastructure strategy

A concise data infrastructure strategy will save you a lot of effort in the future. First, think of where you will manage your data: in the cloud or on-premises. 

The prospect of maintaining your own data center may seem unprofitable, but this is only applicable to small companies. If your organization has enough resources to contain hardware, it may even prove to be more cost-effective. In terms of reliability, there is no difference between the two options. Talk to our cloud expert to help you decide which option is better for your organization’s needs. 

Choose a repository to collect data

The right data architecture is the backbone of a technically up-to-date BI platform. Here you have a choice between using a data lake or data warehouse as your available solution. So, what are the differences between them, and should you use only one of the options or explore a hybrid solution? 

Sometimes a data lake is understood as a part of a Big Data infrastructure, whereas a data warehouse is shown as a repository for general data. However, it’s not that simple and they differ in many ways.

data infrastructure

Earlier, when the amount of data wasn’t as huge as it is now, data warehouses were the definitive solution to data storage. This was because it didn’t take data engineers that much time to build a repository that met the needs of a particular business. However, when Big Data came on stage, bringing information that was exponentially growing in quantity and deteriorating quality-wise, the days of the data warehouse monopoly were doomed. 

Currently, with so much data generated every day, more time and effort are required to develop a data warehouse solution. Fortunately, you have a choice: invest resources in building a data warehouse that contains structured and certainly easier to analyze data or use a data lake with simpler architecture and raw information.

Indeed, a data lake is oriented more toward big data. Here information is stored in an unstructured format but in much higher volumes. The users of such data are data scientists. This kind of repository is relatively inexpensive, so you can use your data lake not only as a storage space but also for experiments with temporary sandbox areas, where experts can build and train models for any task. It’s genuinely useful when the amount of data scales and you need to deal with it and update the data infrastructure in parallel. Often a data lake solution makes sense for information for use cases that haven’t been defined yet. 

That said, this doesn’t have to be an either-or decision.  There’s also the option to go for a hybrid solution. You can keep the data with minimal business meaning in a lake while storing the useful and relevant data in a warehouse; or use a data lake to collect data and a DWH to structure it. But keep in mind, that these repositories use different technologies: data lake – NoSQL, data warehouse – SQL. So you have to resolve this contradiction when deciding to build your data infrastructure.

Clean the data and optimize data quality

Problems that may arise out of inaccurate data are numerous and the departments within your organization they can affect are no less. That’s why data cleaning must be given the highest priority. To create an appropriate data cleaning process you need to take the following steps:

  • Identify and delete irrelevant and duplicate datasets.
  • Fix errors in the data structure.
  • Come up with organization-wide rules of cleaning incoming data.
  • Invest in data tools that allow you to clean data in real-time.

Last but not least — be aware of your information quality. The data must always satisfy six conditions:

  • Completeness. All data sets and data items must be recorded.
  • Uniqueness. This parameter is kept if data has only been registered once.
  • Timelessness. This is about how useful or relevant your data is according to its age.
  • Validity. The data you’ve recorded must reflect the type of data you set out to record.
  • Accuracy. This metric determines whether the information you hold is correct or not.
  • Consistency. You can compare data across data sets and media, if it’s all recorded in the same way.

Build an ETL (Extract, Transform and Load) pipeline

ETL pipeline

The importance of an ETL process to a company’s data warehousing and analysis, in general, can’t be overstated. A well-engineered ETL pipeline brings structure to your information as well as contributes to its clarity, completeness, quality, and velocity. However, there are a lot of challenges you might need to overcome while working on your ETL project. Here are only some of the most prevalent:

  • data formats changing over time;
  • broken data connections;
  • contradictions between systems;
  • addressing the issues of different ETL components with the same technology;
  • not considering data scaling;
  • failing to anticipate future data needs.

Nowadays, the data engineering space is flooded with a plethora of tools that are supposed to automate, accelerate, and take care of ETL processes for you. New technologies pop up nonstop, making the desire to switch from one tool to another almost irresistible: “Everyone’s using Spark! But, what about Apache Airflow?! Let’s try DBT!” The thing is that being on-trend doesn’t matter as much as fundamentals remain the same. So you’d better focus on getting the basics right. Tools come in second. But if you need a well-designed ETL pipeline and some advice on how to build one, our BI experts are ready to help.

Take care of data governance

All the actions above make little sense without proper data governance. It increases efficiency by giving your business a solid database to work from and saving time on correcting the existing data. Besides, it helps to avoid risks associated with dirty and unstructured data and avoid regulatory and compliance issues.
Once you are ready to embrace data governance, make sure that all the stakeholders and data owners are involved in the process and the goals you’d like to achieve are clear, specific, and measurable.
There’s actually one more thing to keep in mind during data governance implementation: it’s not a project but rather a practice that should consistently evolve and develop.

Solid data infrastructure empowers in-depth analysis 

A strong data infrastructure smooths the road for data science efforts. To benefit from it, you need to care about collecting raw data, cleaning it, and making it accessible. Before you go mainstream and start analyzing your data to get perceptive insights, think about who in the organization will have access to the data, how it will be used? Structured information is more accessible and easier to interpret. A clear data infrastructure strategy is key to measurable business success.

Need some expert assistance with building a strong data infrastructure?

Book a free consultation

FAQ:

What does data infrastructure include?

Data infrastructure is a broad concept. Just like physical infrastructure, it includes a number of components. These are data assets, servers, storage as well as processes, policies, and guides on how to manage the data.

What is the importance of data infrastructure?

Data infrastructure provides a solid basis for data analysis You can’t get valuable insights without suitable tools that prepare your data for analysis.  Although the correlation between Data Infrastructure and business benefits is indirect, without a reliable infrastructure you can’t get the right data and properly analyze it to make it work for your business.

SRE VS DevOps: Rivals or Allies?

The ever-accelerating business world has been obsessed for quite a while with the word “agility” when it comes to IT product development. And it’s not hard to see why: the prospect of getting the much-desired solution to fix your pain points ASAP is and always will be enticing. 

However, the COVID-19 pandemic has shown that simply being Agile may not be good enough anymore: ever since the world was forced to adopt a remote working model, MTTR (mean time to repair) has increased, while downtime rates have grown.  

Now, how does one ensure that agility will no longer hamper reliability? Meet DevOps and Site Reliability Engineering (SRE). These concepts that have been around for quite some time and, considering the challenges posed in the wake of the pandemic, are more relevant than ever. 

The difference between SRE and DevOps

SRE

DevOps and SRE were designed in the early 2000s to find an equilibrium between development agility and system stability. However, they are terms that are often misused: some think these are the same; some think they’re competing ideas. Most believe that a company always has to choose between them. So let’s dig deep into what DevOps and SRE are and whether a DevOps vs SRE debate even makes sense.

DevOps is, at its core, a methodology that reduces silos between development, testing, QA, and operations teams to accelerate application development, improve software quality, increase infrastructure availability, maximize application performance, and reduce costs. Now, all of this sounds awesome. There is one problem, though. DevOps is basically a set of abstract principles, some of which many companies struggled to put them into practice. And, to help everyone end this struggle, in 2016 Google published a book called “Site Reliability Engineering”, shedding light on their internal DevOps practices, but most importantly, giving easy-to-understand practical advice on how to make DevOps work.  
So, in a nutshell, while DevOps is a philosophy, SRE is one good way of implementing that philosophy.

How does SRE add to DevOps methodology?

If you look at the DevOps manifesto, you’ll probably find that there are 5 key categories that DevOps is broken into, the methodology’s mantras, if you like, which could be put as: 

  • Removing organizational silos
  • Accepting failure as normal
  • Deploying small incremental changes
  • Benefiting from tooling and automation
  • Measuring everything

All of these are undoubtedly integral to a team’s success in finding a proper balance between agility and reliability, and we’re about to find out why. But, again, as neat as they sound, they don’t look like concrete instructions (“Measuring everything”? Well, of course!). So let’s go through these principles one by one and see where the difference between DevOps and SRE truly lies. 

DevOps ideas and SRE implementation

Removing organizational silos

DevOps idea: the communication between people who do coding (developers) and people who provide maintenance services (operators) must be seamless so as to prevent quick changes in code from damaging the infrastructure and creating major threats to the system’s stability. Initially aimed to break the wall between dev and ops teams, DevOps has rapidly spread beyond the software delivery pipeline to areas, such as security, finance, HR, marketing, sales, etc., where collaboration is vital.

SRE implementation: you need to build a tight-knit cross-functional team not only by bringing developers and operators together but also by expanding synergy-provoking practices to finance, human resources, executive leadership teams, and more. The culture of better communication and knowledge sharing, that DevOps and SRE inherently demands, can be created via frequent stand-ups, while integration and automation are to be deployed with special toolsets. 

Accepting failure as normal

DevOps idea: no man-made system can be 100% reliable, so a failure of the said system shouldn’t be perceived as a disaster by any company, but instead, should be treated as normality… as long as a lesson is learned in the process. 

SRE implementation: you need to internally agree on the amount of downtime that is acceptable in given circumstances and be prepared to swiftly deal with system failures (since they are inevitable and shouldn’t come as a surprise); one way to do that is to hold so-called “blameless post-mortems,” where time won’t be wasted on seeking whom to blame for the failure. Instead, the team, in a routine manner, figures out ways of improving the system, focusing on the future, not the past.

Deploying small incremental changes

DevOps idea: making frequent, but small changes to the code help react to issues faster and fix bugs easier. Why? It’s simple. Looking for a bug in 100 lines of code is far easier than in 100,000 lines of code. It also enables the development process to be generally much more flexible and alert to sudden changes. 

SRE implementation: you need to note that it’s not the actual number of deploys per day that matters. Striving for an inordinate amount of deploys just for the sake of them is wasted effort. You should indeed deploy often, but also make these deploys count—the more sensible the nature of the deploy is, the easier it is to fix a potential bug, thus reducing costs of failure. 

Benefiting from tooling and automation

DevOps idea: human nature doesn’t allow us to perform massive monotonous tasks efficiently. In the same way that it takes a lot of time and energy to manually address crucial workflows, companies that leverage tooling and automation can improve these processes exponentially.

SRE implementation: you should consider what long-term improvements to the system need to be made and automate the tasks that will be done regularly in a year or a couple of years’ time (SRE calls this “automating this year’s job away”). In doing so, you avoid investing in short-term gains and focus on long-term automation. 

Measuring everything

DevOps idea: having tangible metrics that measure different aspects of your development process not only helps to tell whether the company is working on a certain project successfully but also provides justification for this or that business decision. 

SRE implementation: you should adopt the use of Service-Level Agreement (SLA), Service-Level Objective (SLO), Service-Level Indicator (SLI), keep track of the system’s Mean Time Between Failures (MTBF) and Mean Time To Recovery (MTTR), and have a defined Error Budget. These will help your project run much more efficiently.

We’ll soon elaborate on what some of the notions in the paragraph above actually entail, but the rest of the picture should be more than clear by now. DevOps was created to make IT development better. Meanwhile, SRE was meant to show HOW exactly we should do that. As many SRE specialists like to say, “ SRE implements DevOps.”

SRE Metrics

SRE metrics

SRE, as a concept, is next to impossible to imagine without Service-Level Agreement (SLA), Service-Level Objective (SLO), Service-Level Indicator (SLI). As stated above, these are the core notions that relate to the measurement of your SRE implementation success in many ways. And, much like the names of these concepts, their natures are very similar to each other, yet with some crucial differences: 

  • SLA is referred to as an agreement between the service provider and the customer about such metrics as uptime, downtime, responsiveness, responsibilities, etc. In other words, it acts as a set of promises made to the customer and represented by various metrics, and a set of consequences if these promises are not lived up to;
  • SLO is, in turn, referred to as an agreement within an SLA about one specific metric i.e. uptime or response time. Basically, an SLO is an individual promise made to the customer. So, in this respect, it’s possible to see an SLA as a certain set of SLOs;
  • Lastly, SLI is an indicator that shows whether the system is functioning in compliance to this or that SLO.

A typical example of all these three notions working together would be something along these lines: an SLA you made with your customer states that the system will be available 99.9% of the time (the so-called “three nines of availability”), so it would have the SLO in it that would be 99.9% uptime, and the SLI would be the actual measurement of the system’s uptime.

Which types of companies need SRE and DevOps?

Considering that DevOps and SRE are there to assist development teams with securing great system stability whilst still being very agile, it’s relatively safe to say that any dev company should, to some extent, have a grasp of what DevOps/SRE techniques are and how to implement them. They’re modern software development essentials. 

In our previous pieces, we’ve already looked at how beneficial DevOps can be for large-scale manufacturing business and at the massive impact it had on financial services’ giants, but the sheer brilliance of DevOps and SRE is in their universal applicability — your business does NOT have to be a software development business to reap benefits from these practices; as long as you’re dealing with update roll-outs, infrastructural changes, growth and upscaling, feel free to delve into this philosophy.

And, effectively, there’s no team that’s too small for DevOps/SRE, either. You don’t even need to have a dedicated SRE specialist if you’re a small company. In this case, it may pay to train one of your team members to use the SRE methodology as the learning curve is not that massive.  

So taking all of that into account, we can easily make a case that the ideas and concepts behind DevOps and SRE are there for every business to relish — large enterprise or a small start-up, IT or non-IT, they’re for everyone.

DevOps or SRE? You can leverage them both

In an attempt to settle the Site Reliability Engineering vs. DevOps debate, we now can say for certain that there’s no point in either-or statement. In fact, how can we be talking about a debate here if the two things we are desperately trying to contrast are virtually the same, with one being a vital part of the other? 

If you say that you can do DevOps well, chances are you do that with the help of SRE principles. 

If you say that you can do SRE well, you should realize that we’re technically talking about DevOps.

So it’s not a “red pill–blue pill” scenario at all, both DevOps and SRE are to be embraced and we’re very excited to see how they both develop in years to come.

Excited about SRE and DevOps? Talk to our experts to find out how DevOps and SRE can help you uncover new business opportunities.

Some Reasons for DevOps failures. Based on Statistics, Real-World Cases, and Common Sense

Everyone wants to do DevOps, however, history proves that far from everyone is successful at it.  And although there’s nothing bad about failures – at least, that’s what DevOps philosophy advocates, they shouldn’t slip away unnoticed. We decided to delve deep into some statistics and DevOps failure case studies not to point fingers but to get to the bottom of the cause and let you learn from the mistakes of others. 

Why DevOps Doesn’t Work  

The consequences of DevOps failures might be so extreme that they immediately hit the headlines and are being discussed long afterward. Have you heard about Knight Capital that went bankrupt in 45 minutes because of a failed deployment? To be fair, there are only a handful of stories like that. And just because they are rare we tend to think that it’ll never happen to us. Indeed, there’s a long shot for that. However, DevOps fails not only when the damage is done, but when the organization can’t leverage it in the way it’s supposed to. According to Gartner, by 2023, staggering 90% of DevOps initiatives will have failed to meet expectations. Businesses that don’t want to become part of this statistic need to understand what they’re doing wrong and how to fix it.

Failing to identify the importance of organizational culture

Perhaps, one of the biggest misconceptions about DevOps is to think that it’s only an IT initiative. In fact, the problems organizations need to solve are a combination of culture and technology. Sometimes DevOps is equated with automation or cloud, but it’s so much more than either of those. While delivering a successful DevOps practice without using cloud technology or automating repetitive tasks would be difficult, it doesn’t automatically (pun intended) make you good at DevOps. Instead, good DevOps comes from a cultural shift toward better communication, collaboration, and integration across the company. In addition, companies need to address organizational and team concerns, including helping teams clarify their mission, primary customers, interfaces, and what makes for healthy interactions with others.

In the interview with InfoWorld, Bryan Dawson, DevOps evangelist, shared one of his first experiences in DevOps, which resulted in the failed application release. Working as a consultant for a U.S. government agency, he took part in the deployment of a new supportive DevOps platform, which was supposed to help with planning, coding, building, and releasing the app. At first, the project seemed promising, but soon it became clear that tooling alone is not enough to succeed. Being focused on tools, the team lost sight of the people and processes and literally supported legacy practices with modern instruments.

So one of the biggest blockers for the organizations to use DevOps to its full potential is failure to create an appropriate culture. As cheesy as it may sound, the best results are achieved when we start viewing DevOps as a cultural paradigm. However, simply talking about culture won’t help if it doesn’t evolve into certain actions. DevOps is a verb – it’s not something you have, it’s something you do.

According to Puppet State of DevOps 2021 Report, DevOps really works out when the leadership makes it a priority. In terms of DevOps evolutionary levels, 60% of highly evolved organizations say that the top management actively promotes DevOps. It’s both top-down and bottom-up work: the practices are set from above and are supported by the whole staff.

Apart from passive leadership, other cultural reasons for companies to be stuck in a rut with DevOps are risk management practices of infrequent deployments, unclear responsibilities, and limited knowledge sharing. So what can be done to change that?

Too many organizations, when seeking cultural change, focus too much on these surface elements—add a foosball table and a few bean bags in the office and suddenly everyone will start acting like we’re an innovative start-up, right? That’s not the way it works.

— Stephen Thair, CTO, DevOpsGroup

You may start with the following:

  • Change leadership behavior at every level by generating meaningful conversations with your team and enabling them to understand why the status quo is no longer good enough.
  • Hire new people with new ideas, for whom agile techniques is not an empty phrase.
  • Think about what you can do to nudge your staff in the right direction, such as rewarding the behaviors that move the company forward or challenging ones that don’t align with the direction you are trying to go.
  • Introduce agile ways of working, like Scrum or Kanban, to visualize workflow and speed up business value delivery. You may also try to apply the idea of “pair programming” to the areas besides programming – and if pairs are chosen right, not only will the quality of work increase, but also interpersonal skills will develop significantly and knowledge sharing will be established.

Trying to do a new thing in the old ways

2nd Watch’s DevOps survey found that just 22% of organizations are engaged in DevOps in its purest form, while 78% of organizations, which are supposed to be doing DevOps, continue having separate management for infrastructure/operations and engineering teams. However, DevOps can’t exist without a truly collaborative environment, which breaks the silos across the whole organization. All the stakeholders, including business people, developers, operations teams, security teams, and QA must be engaged in creating the product and in getting it out of the door.

team management

Another thing the survey revealed is that more than a third of the respondents manage infrastructure manually. Besides contradicting the DevOps philosophy, this approach increases the risk of human errors, leading to wasted time that could, instead, be spent on generating compelling ideas. It also undermines the work of sysadmins turning them into angry burned-out folks ready to blow it all up. When infrastructure expands, the process slows down even more, while the risks of errors skyrockets. Moreover, companies can miss out on the most useful practices, like well-organized scaling. For instance, for an online store at night, when there are few if any customers, one server might be enough, otherwise the price for cloud infrastructure that you don’t even need will arise. Meanwhile, with an automatic approach, your cloud infrastructure will scale down by default whenever it’s needed.

One more blast from the past that holds Devops back in at least a quarter of companies is having little or no code testing processes in place. In today’s competitive market, where development and release cycles get shorter, winning the race of continuous delivery is impossible without making continuous testing an integral part of CI/CD pipelines. If testing isn’t run properly, it won’t be long before application crashes and customer service issues occur. As it was in the case with an already mentioned U.S. government agency, launching a web application. Right after the application was released it experienced critical and very public failures. That’s because it hadn’t been properly tested during the delivery process. It took the tech team multiple weeks to deal with the issue and get the site operational. Can you imagine how much cheaper it would have been for the agency if the bugs had been identified at an early stage of development?
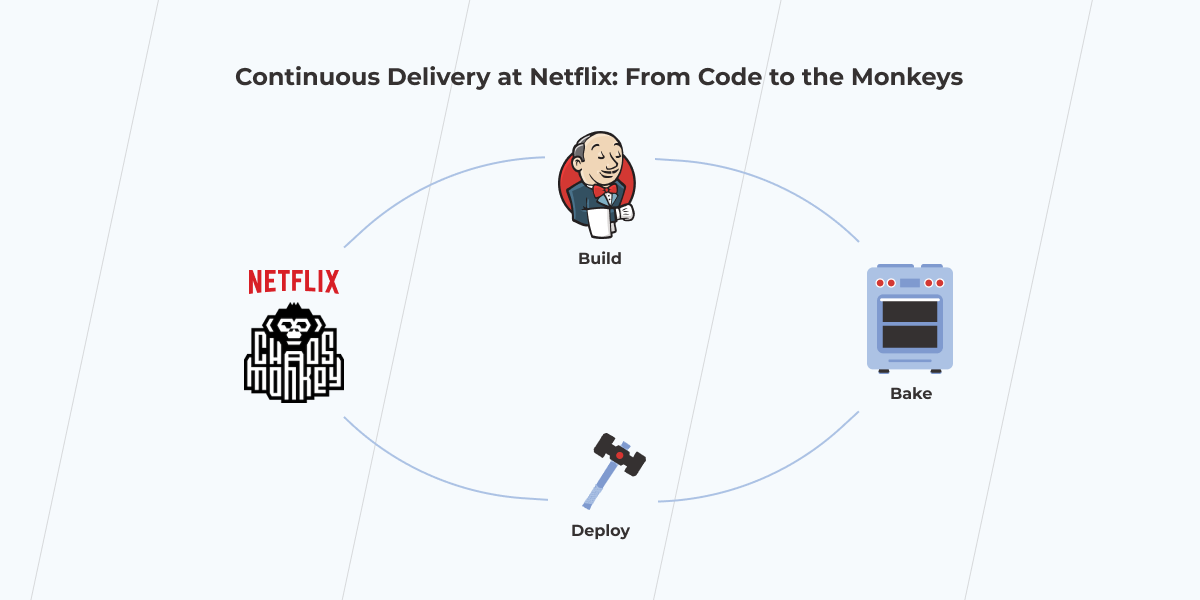
To accelerate release cycles and, at the same time, ensure error-free outputs, testing must stop being a segregated stage at the end of delivery, but become an integral DevOps activity that covers development, integration, pre-release, production, delivery, and deployment.

The legacy of ‘legacy’

In this year’s State of DevOps survey, Puppet found out that for 28% of respondents, legacy architecture is one of the main barriers to better DevOps practiсes.

These legacy systems, they’re just like these hairballs that the cat coughed up.

— Charity Majors, CTO and Co-founder, Honeycomb.io

Working on things designed decades ago is arduous. Fortunately, they still can take advantage of modern practices and a pinch of agility. Sometimes simply moving an application into a virtualized environment allows for better test coverage, which enables faster and more confident changes.

Anyway, ‘leave it alone’ attitude only grows the gap between the current state of the organization and its future improvement, and paves the way for DevOps failures. As tough as modernization might be, the survival of the companies that were not born digital depends on it. But labeling your organizational dynamics problem as ‘legacy’ without identifying the specific issues is far from being useful. To make progress in modernizing obsolete systems, you need to analyze them, sort them into easily understood categories, and set explicit goals and action plans. 

Automation is a double-edged sword

automation

Anything that you do more than twice has to be automated.

— Adam Stone, CEO, D-Tools

Automation is key in the DevOps movement. There’s a lot of work, like installing packages, building docker containers, monitoring, logging, alerting, etc., that just shouldn’t be made manually, first of all, because they don’t scale, and another thing is that humans are not really good at doing the same things over and over again – that’s what computers are for. ‘So why not leverage them?’ – DevOps adherents ask rhetorically. No reason. Though such a powerful tool as automation must be treated with awe.

The fall of Knight Capital group can serve as a cautionary tale when it comes to automation. Knight was, at one point, the largest US-based equities trader. To send orders to the market for execution, Knight had been using an automated application, known as SMARS, which had many outdated parts in its codebase. Eventually, the company decided that one such part — old, unused code referred to as “Power Peg” — should be replaced. After the new code was written, it unintentionally activated the Power Peg functionality, which was still in the codebase. Because of the system that was sending automated, high-speed orders into the market and wasn’t being tracked, Knight experienced 45 minutes of hell. This time was quite enough for the app to make around 4 million transactions worth 3 billion dollars. Just like that, automation turned into a knightmare, resulting in a $460 million loss and bankruptcy. 

Anyone who has used Netflix has probably noticed that some streams (e.g. ‘Trending Now’ or ‘Popular or Netflix’ ) occasionally disappear. This happens because the instance group that serves this stream is down. Meanwhile, the app itself isn’t suffering any deterioration in performance and the company is not losing customers.

DevOps failure

Perhaps, the main lesson to be learned from this story is that you should automate not as much as possible, but as much as reasonable. In that case, it would have been reasonable to turn software releases into a repeatable and reliable process by implementing an automated deployment system. Had Knight known that, the fatal error could have been avoided.

Talk to one of our solutions experts to begin your DevOps journey the right way

Book a free consultation

Bonus: Netflix DevOps case study. If you can’t beat failure, automate it

For those who got tired of reading about DevOps failures, here’s an example of Netflix that shows how a fundamental understanding of DevOps can help make failure a friend rather than an enemy.

Netflix is made up of hundreds of microservices hosted on the cloud. To provide uninterrupted video streams for the customers across a wide array of devices, Netflix engineers have to ensure all the components are working together properly. Nonetheless, it’s barely possible to find a system that is 100% reliable. Instead of resisting the obvious, Netflix acted in a truly DevOps style – they accepted that failure was going to happen, planned it in advance, and went even further by automating it.

netflix devops

It’s possible thanks to the Chaos Monkey, a tool invented by Netflix to test the resilience of its infrastructure. The tool randomly shuts down server instance groups to check how remaining systems respond to the outage. The artificially created ‘chaos’ allows developers to better prepare for the real one rather than just waiting for a disaster to strike. Such an approach encourages engineers to design modular, testable, and highly resilient systems from the start.

Get prepared for your DevOps journey

Having a deep understanding of what DevOps is and being ready to make a shift to a new workflow, new mindset, and new culture are essential constituents of success in DevOps. What’s for failure, it’s not something to be terrified of. Despite a number of things that can go wrong you have a great chance to avoid them by planning recovery in advance and learning the lessons your predecessors have taught. 

Anna Vasilevskaya
AI modified real photo
Anna Vasilevskaya
Account Executive

Get in touch

Drop us a line about your project at
[email protected] or via the contact
form below, and we will contact you soon.