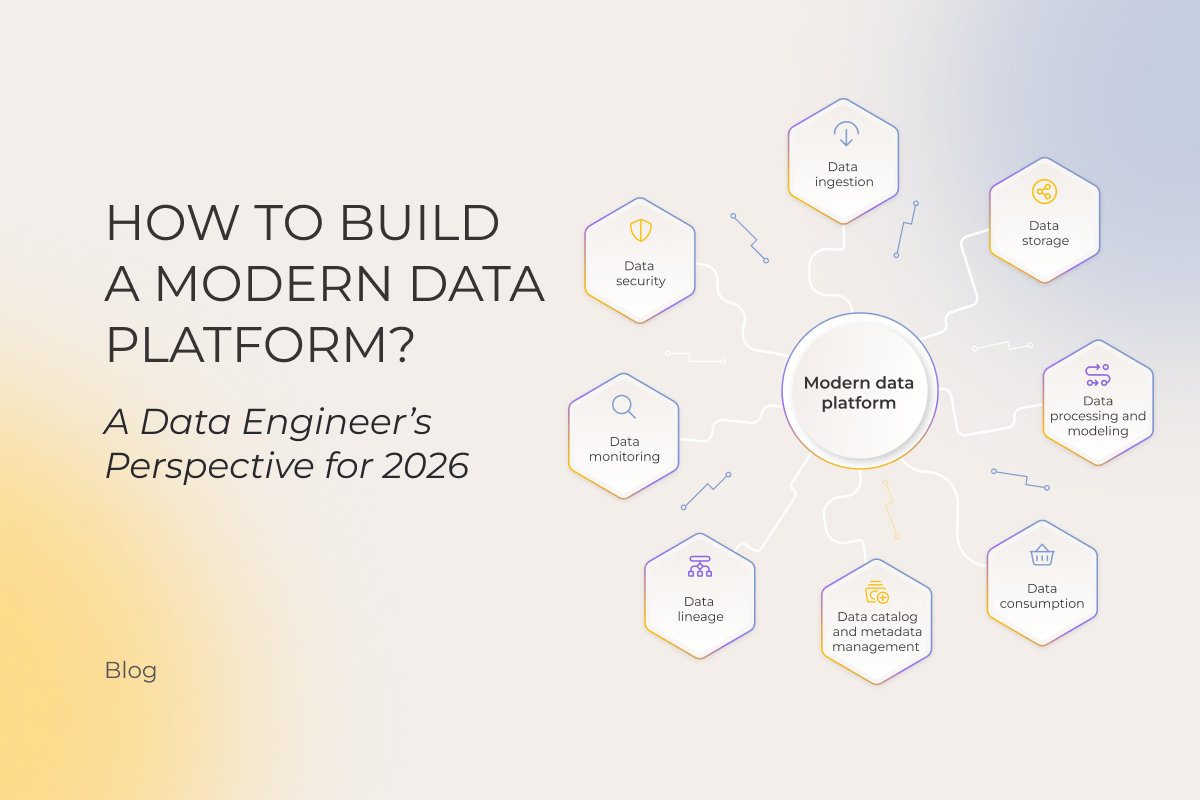
How to Build a Modern Data Platform? A Data Engineer’s Perspective for 2026

The surge of interest in artificial intelligence has elevated the importance of building the modern data platform. And here’s why.

As AI sets higher expectations for how businesses use their data, many are growing more uncertain about the strength of their data foundations. Companies still struggle with issues such as integration, security, and data quality and the pace of improvement has not matched the increasing demands of AI/ML initiatives.

Today, a striking 84% of global data and analytics executives agree their data strategies need a ground-up rethink before innovative AI-related undertakings and advanced analytics can live up to their promise. And the surest way towards this is building a modern data platform. In this article, our data experts explain how to build a data platform right.

Key highlights

  • Advanced data analytics and AI/ML initiatives can only succeed on a foundation of clean, well-organized data. A modern data platform, developed in line with a clear data platform strategy, delivers exactly that.
  • Core layers of a modern data platform architecture include data ingestion, data storage, data transformation, data processing, data consumption, and data governance.
  • Without strong governance, even the most elaborate data platforms risk inconsistencies, compliance issues, and limited trust in the insights derived.

What is a modern data platform?

A modern data platform (MDP) is a unified, enterprise-wide data ecosystem of tools that enables the collection, storage, transformation, and consumption of data under transparent governance. Its goal is to move beyond a set of loosely connected components and their chaotic usage toward a cohesive modern data infrastructure that oversees the full data lifecycle end to end. It can be reached either by a collection of best-of-breed, cloud-native tools for data tasks (such as dbt, Fivetran, etc.), commonly referred to as a modern data stack, or a more integrated and often self-service platform built around those modern data ecosystem components.

Why do businesses need a modern data platform?

In fact, 82% of companies are either planning or already implementing a data platform. There’s nothing new about the business goals they are trying to achieve with solutions like this. What is new is how effectively a modern data platform enables organizations to reach them, tipping the balance in its favor over legacy, fragmented, and semi-manual data management environments that offer nothing but slow, brittle, expensive, and hard-to-scale band-aids.

modern data platform

Building a modern data platform dramatically shortens time-to-value and boosts efficiency across the sought-after AI/ML initiativesand augmented analyticsproducing real-time, actionable insights. Other benefits of having well-organized data platform infrastructure include:

  • Lower costs. Even with a solid upfront investment, building a big data platform saves money in the long run by reducing spend on data team headcount needed to manage scattered data sources, as well as on licensing fees for disparate tools.
  • Saving engineering time. To create a new pipeline, there’s no need for intensive coding work as templates and reusable components can be replicated across different use cases. 
  • Democratized usage. Beyond data analysts, the platform’s user-friendly ecosystem makes trusted and governed data accessible to a broader team of business users across the organization.
  • Frictionless data delivery. Data doesn’t get stuck in isolated silos or require complex handoffs between tools. Besides, with standardized schema and governance, different teams can access and interpret the same data without extra cleaning or mapping.

However, a modern data analytics platform is only as effective as the vision behind it. Without a clear data platform strategy, businesses end up duplicating efforts across teams, fragmenting their data ecosystem, and slowing every transformation initiative, whether in business intelligence, advanced analytics, or AI.

When is it better to opt for custom data platform development? Isn’t a ready-made enterprise data platform enough?

Off-the-shelf platforms like Microsoft Fabric or Google BigQuery are fine for fast launch at relatively lower upfront costs or standard needs.

But if you want a data foundation that’s built for your unique playbook, one that scales exactly when and how your business scales, delivers long-term savings, and eventually turns into a genuine competitive edge, you need custom data platform development, also called data platform engineering or data platforming.

Besides, ready-made solutions often come packed with features you don’t need. Or, worse, data platform features that aren’t designed for your actual needs, leaving you to hack your way around their limitations. Those workarounds eat up time and budgets.

With custom data platforming, on the other hand, you:

  • get exactly what you need to achieve your goals
  • gain full control over your data platform architecture and your usage model, which is especially crucial when your data becomes a strategic digital asset
  • have the freedom to rapidly test and deploy advanced AI functionalities, like autonomous AI agents or semantic understanding before they are available in commercial platforms. Plus, these can be tailored exactly to your needs, something ready-made solutions allow only in a very limited way.

How to build core data platform layers?

As a rule, a modern data platform architecture is built on four core layers, including ingestion, storage, processing, and consumption. Each is made up of its own set of tools and technologies. Collectively, components of a modern data ecosystem aim for one simple goal: getting the right data, to the right people, at the right time, in the right shape.

Modern data platform architecture

Data ingestion

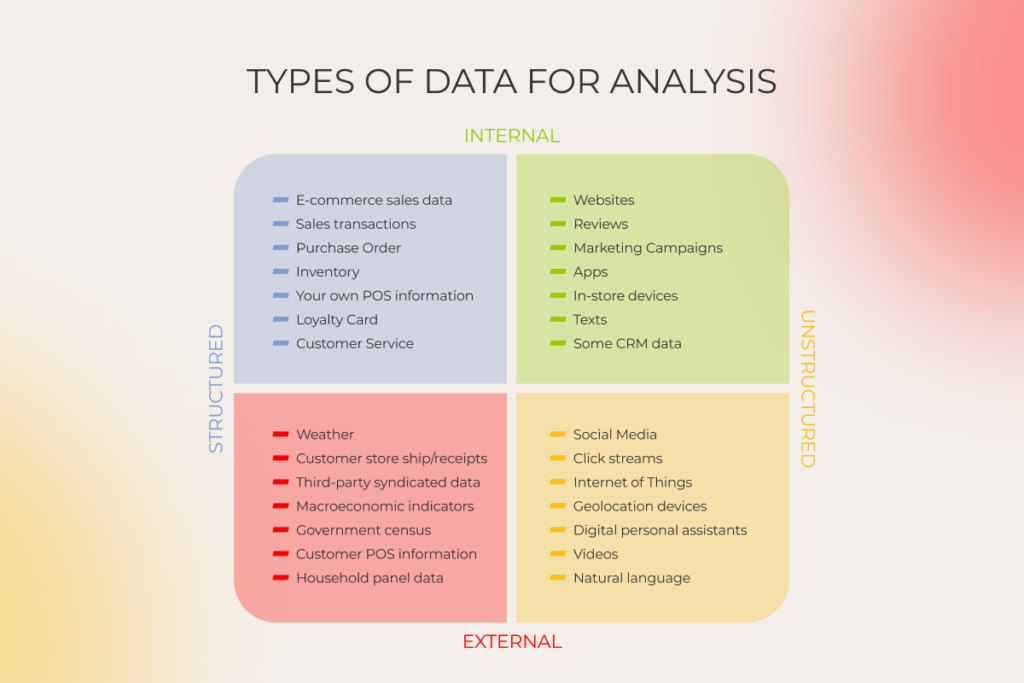
Data ingestion is the first step in extracting value from the massive volumes of structured and unstructured data businesses amass from corporate systems like ERP or CRM, financial platforms, third-party providers, social media, and others. 

When data ingestion is well-planned, all relevant data sources are identified and properly integrated, and data flowing into the modern data platform is validated and formatted for reliable storage and efficient downstream processing. Engineers have to wrestle chaos into order, carefully deciding how to handle formats, missing or duplicated data, and temporal alignment, since errors here cascade into analytics, reporting, or AI models, depending on the business use case for the data.

Today, this is made possible by tools like Fivetran, Apache Kafka, and CDC technologies such as Debezium.

Data storage

The choice of a data storage system depends on an organization’s requirements and a variety of data users, and performance expectations. Modern storage architectures can be deployed in both cloud and on-premises environments while leveraging high-resilience databases for modern data platforms to support AI workloads and large-scale data processing. When building a data analytics platform, the following storage options are commonly considered:

  • Data warehouses. A data warehouse is the right choice when the required datasets are well defined, their structure is known, and data-reliant initiatives are already clear.
  • Data lakes. When organizations expect analysis patterns to evolve and need to work across heterogeneous data, a data lake provides the necessary room to explore.
  • Data lakehouses. Pioneered by Databricks, the lakehouse concept makes it possible to use data management features inherent in data warehousing on the raw data stored in a low-cost data lake owing to its metadata layer.

Data processing and modeling

Stored data only becomes useful once it’s been properly transformed. The data processing layer is where cleansing, combining, and structuring data happens to ensure its quality, consistency, and readiness for planned initiatives. Depending on your needs, we integrate different data platform tools in this stage. Just a few examples are:

  • For high-speed, large-scale batch data processing, we suggest using Apache Spark and its integrated modules for SQL, streaming, and machine learning.
  • When a fully managed, serverless ETL service is needed, AWS Glue automatically discovers, prepares, and combines data for analysis.
  • Apache Kafka (with Kafka Streams) powers real-time streaming applications that demand high scalability and fault tolerance.
  • To perform stateful, low-latency computations on unbounded data streams, Apache Flink provides exactly-once processing guarantees.
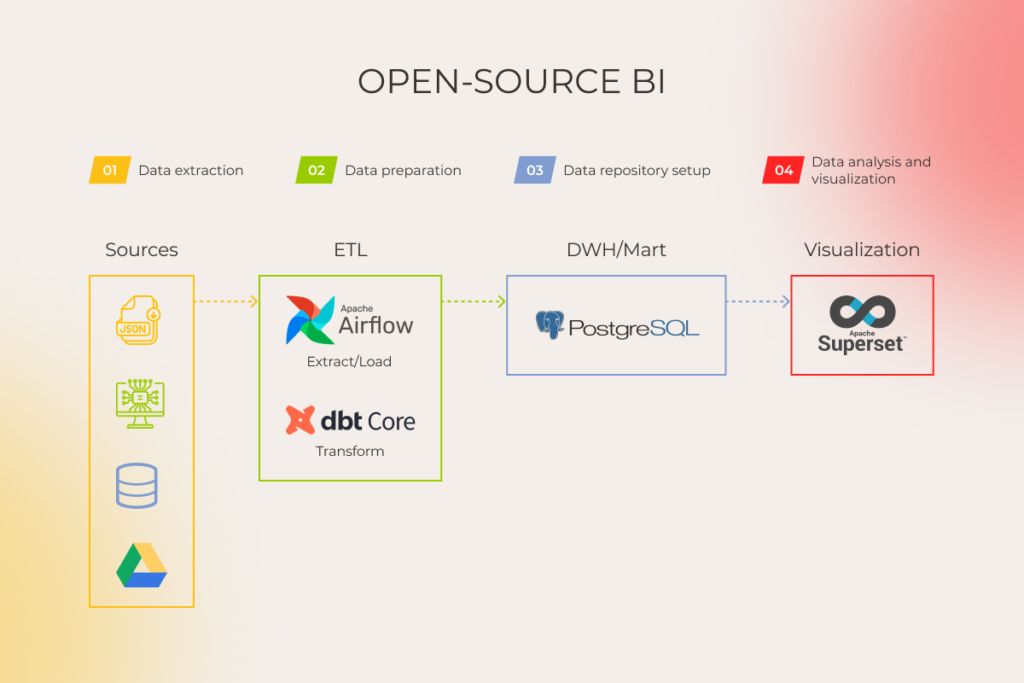
  • dbt transforms data directly within the warehouse using SQL-centric modeling and documentation.
  • Complex data pipelines are programmatically authored, scheduled, and monitored as directed acyclic graphs (DAGs) with Apache Airflow.

Data consumption

This is where data becomes actionable. From the powerful outputs of machine learning models to sleek, interactive dashboards, all the data platform features you’ve wanted from your development initiative come served on a silver platter.

  • Business intelligence. Curated datasets from the storage system are consumed via drag-and-drop interfaces or direct SQL, producing BI dashboards and reports that inform daily operational decisions and strategic reviews.
  • Machine learning and data science. Here, data fuels predictive engines. Data scientists access organized feature stores and massive datasets to train models, running iterative experiments to deploy services that can, for example, forecast inventory demand or score transaction risk in real time. The toolkit includes solutions like Databricks ML, SageMaker, or Vertex AI.
  • Data as a product. Cleaned, aggregated data can be exposed to other internal systems or customer-facing applications through secure, documented APIs, such as a REST endpoint or an internal GraphQL API.

Let’s stack up your data platform, brick by brick

Contact us

Building trust in your data pipeline through effective governance

Data platform implementation isn’t complete without making the whole system observable, secure, and trustworthy, while keeping all the workflows traceable.

The bitter truth is, no single platform covers all aspects of data governance. To serve the goal, it must be composed of multiple, well-chosen data platform tools. This is how modern data platforms work.

Data catalog and metadata management

Effective data governance is impossible without knowing where the data is and what it means. Think of catalog and metadata management as the map, legend, and compass for your data ecosystem. Metadata tools like DataHub or Unity Catalog act as the Google for your data, indexing schemas, owners, descriptions, and usage stats, while semantic layers (dbt Docs, Cube, Looker semantic model) and tagging engines (Atlas-based catalogs, Purview classifiers) add shared meaning and classify sensitive data.

Data lineage

Data lineage shows how data flows from raw ingestion to consumption. It answers practical governance questions:

  • Where did this data come from?
  • What transformations were applied?
  • What depends on this table or column?

Lineage is captured via tools like OpenLineage, dbt, Spark, Airflow, and Unity Catalog, and visualized in catalogs such as DataHub. This traceability enables impact analysis, root-cause debugging, and safe change management, and is critical for regulatory compliance.

Data monitoring

When data arrives late, duplicates appear, or the data isn’t structured the way the pipeline requires, observability tools surface the issue before users notice.

  • With monitoring and alerting tools (Monte Carlo, Bigeye), data quality becomes measurable and enforceable, answering the question “can we trust this data?”.
  • Freshness, volume, and schema-drift checks (Great Expectations, Soda) reveal when data stops behaving as expected.
  • To keep the data platform fast, reliable, and cost-efficient as usage scales, query performance monitoring tools like Snowflake Query History, or Databricks metrics are added.

That’s how you configure data quality management across your pipelines.

Data security

No business data platform is complete without security built in. This is where you ensure the right people access the right data, all the needed policies are enforced automatically, and sensitive information is protected, while multiple teams can work safely and compliantly. Your security stack should enforce a set of practices, including:

  • Policy enforcement. Define and automate policies that govern who can access data and under what conditions. Policy engines like Apache Ranger, AWS Lake Formation, or Azure Purview can be helpful.
  • Access control management. Apply role-based (RBAC) or attribute-based (ABAC) models to strictly govern user permissions.
  • Data protection. Mask or tokenize sensitive information to minimize exposure while enabling safe data use for teams.
  • Schema integrity control. Apply rules and constraints at the data schema level to prevent unauthorized or invalid data modifications. Thinks Delta Lake constraints or BigQuery policies.

Here’s how to make a data platform matter for the long haul: best practices

For every modern cloud data platform implementation, going live is only the starting line. The expected system’s operation and performance depend on a set of carefully orchestrated follow-up measures. These data platform best practices come from real-world implementations across industries, including high-volume analytics, ML pipelines, and modern cloud-native architectures designed to survive the next AI wave.

  • Run a controlled pilot. Select a single use case or a defined user group for the initial rollout. The objective is to test your core assumptions about usability and utility in a real, but contained, environment. Gather specific feedback on bottlenecks and areas of confusion, then address them.
  • Educate your employees. Embed learning into their workflow rather than forcing formal training. Provide context-sensitive guides, templates, and self-serve notebooks so your team can explore data safely. Pair this with hands-on workshops tied to real projects and create a feedback loop where early adopters mentor others, gradually making usage the default behavior instead of an optional skill.
  • Monitor impact. You need a balanced approach. Tie platform metrics to business outcomes: track adoption, query performance, data freshness, and error rates alongside revenue, product usage, or operational efficiency gains.
  • Scale smartly. Treat your modern data platform as a living system. Adapt it as your business needs evolve and as new data technologies emerge.

Design a data platform that’s tailored to your current data landscape and future innovations

Contact us

Before jumping into building a data platform, get clear on what you really need

It’s always better to step back and define exactly what your use case requires because the wrong architecture or technology choice can lock you into inefficiencies for years. 

Different business needs require fundamentally different solutions. For instance, if your goal is to build real-time recommendation engines, the platform must handle streaming data and low-latency inference, whereas predictive analytics on historical sales data demands batch processing and scalable storage for structured datasets. Each of these needs dictates different architecture choices, and your data platform strategy overall, so defining them early on ensures the platform actually supports your goals and prevents costly redesigns.

At Instinctools, we conduct a discovery phase to reveal the precise requirements upfront and make sure you commit to the right solution, one that delivers today and tomorrow, without resorting to retrofits or overcomplication.

– Ivan Dubouski, AI Lead Engineer, Instinctools

During discovery sessions dedicated to data platform design for our clients, we usually look at a few core things:

  • Defining business objectives and concrete use cases
  • Auditing the state of existing data pipelines
  • Tying goals to success criteria 
  • Validating technology fit for data types, scale, and workloads
  • Mapping governance, security, and regulatory compliance requirements
  • Assessing organizational capabilities, skills, and data maturity

Invest in the data engine that earns its keep

Book a call

What makes a good (and AI-ready) data platform

Sustainable, scalable, AI-optimized architecture of a modern data platform is formed thanks to a set of guiding principles:

  • Unified access. Providing a single, consistent access layer for raw data, derived data, and AI services to reduce fragmentation and operational friction.
  • Semantic context. Embedding business meaning and relationships into data through a rich semantic layer (often powered by knowledge graphs) to make data understandable and actionable.
  • Multimodal by default. Supporting all data types – structured data, text, images, video, audio, and their AI-native derivatives (e.g., embeddings) – as integral components of the platform.
  • Productized data as a foundation. Treating data as reusable, well-documented products with rich metadata to accelerate AI development and enable scalable reuse.
  • Continuous adaptation. Refining data and data products based on system feedback and changing needs, enabling ongoing improvement and new data derivations.
  • Governed and trusted by design. Ensuring all data is secure, compliant, explainable, and validated to build lasting trust and reliability.

How AI gives a nudge to modern data platform development

Rather than acting solely as a consumer of data, AI can also serve as an enabler of more mature data platform design and management practices. It helps establish and maintain semantic consistency, governance controls, and trust across use cases through:

  • Reducing duplicate definitions and improving consistency by automatically identifying similar business terms, recommending standard definitions, and suggesting the right owners for key data assets.
  • Making data classification more accurate and maintainable by combining existing classifications with context from related data, lineage, and past decisions.
  • Assessing the impact of changes before they happen by predicting which reports, applications, or teams may be affected by schema or pipeline updates, and identifying the most likely source of issues.
  • Speeding up data quality issue resolution by connecting anomalies to business impact, responsible teams, and downstream dependencies.
  • Strengthening data governance by detecting where sensitive data restrictions should be applied, flagging uncertain classifications, and highlighting areas that need review.

Building an analytics platform is faster and more reliable than ever with AI-powered development practices

Contact our experts

Start your data platform off on the right foot 

What sets a modern data platform apart from traditional data architectures is that its design is dictated by each specific business task at hand. If your AI or advanced analytics initiatives need a strong, custom-built data foundation to take flight, make sure it’s there for you, crafted from the best technologies and tools the market offers and pieced together by a reliable engineering partner.

From data platform strategy and first production deployments to data platform transformation initiatives, our data engineering services company has guided companies through every stage of modern data platform implementation.

FAQ

What is the modern data platform?

A modern data platform is an integrated set of tools and technologies that supports an enterprise’s data across its entire lifecycle.

What is data platform engineering?

Data platform engineering involves designing, building, and maintaining the infrastructure, pipelines, and tools that enable organizations to collect, store, process, and consume data at scale. It combines software engineering principles with data management expertise to create reliable, scalable data systems.

What does a modern data platform look like?

Often a cloud-native, serverless platform that ingests, stores, transforms and serves data on demand. It typically follows a lakehouse architecture, combining the structured performance of a data warehouse with the flexible storage of a data lake. It also features a centralized governance layer, and self-service access points for data scientists and business users.

What is an example of a data platform?

A good modern data platform example is Microsoft Azure Data Platform, which unifies data ingestion (Azure Data Factory, Event Hubs), data storage (Azure Data Lake, Azure SQL), data processing (Azure Databricks, Synapse Analytics), data governance (Microsoft Purview), data analytics (Power BI) and AI/ML (Azure Machine Learning). Other examples include Google Cloud data platform and AWS data platform.

What are the major data platforms?

The market is dominated by Snowflake, Databricks, and the native stacks from “Big Three” cloud providers: Google BigQuery, Amazon Redshift, and Microsoft Azure Synapse/Fabric. Each offers integrated tools for data engineering, warehousing, and machine learning.

What are the layers of a modern data platform architecture?

The architecture rests on five pillars: ingestion (ELT tools like Fivetran), storage (data lakes / lakehouses / data warehouses), processing (transformation and modeling tools like dbt), consumption (business intelligence tools, AI/ML platforms, APIs), and governance (observability, security, lineage, and cataloging).

How do modern data platforms work?

Modern data platforms combine ingestion, storage, processing, and consumption layers into a unified system. Data flows from operational sources through pipelines into storage (data lakehouse, warehouse), gets transformed by processing engines, then serves analytics, BI tools, and AI/ML workloads. Governance and metadata management run across all layers.

How long does it take to build a modern data platform?

Building a basic modern data platform takes 3-6 months for an MVP and 12-18 months for full enterprise deployment with governance, AI-readiness, and multiple consumption paths. Timeline depends on team size, complexity of data sources, and whether you use ready-made components or go fully custom.

How to modernize your data platform?

Data platform modernization starts with assessing the specific parts of your data stack that create bottlenecks, risks, or unnecessary costs. Every environment is different, so priorities vary. The right approach may involve upgrading tools, redesigning pipelines, improving data architecture, or replacing legacy components to match your business and technology goals.
How to Build a Data Warehouse: Step-by-Step Guide from Instinctools’ Data Architects

Advanced analytics and AI may be the destination, but understanding how to build a data warehouse is often where the journey should begin. Before your data speaks visually, it must first find its order. Slick BI dashboards and visualizations look effortless, but they owe everything to data that’s been wrangled, organized, and tied together in a well-crafted data warehouse.

Setting one up, however, is a significant undertaking requiring considerable investment, in-depth architectural expertise that combines mastery of both foundational and modern best practices, and a sharp eye for the traps where projects can stall.

Our senior experts offer a hands-on, step-by-step guide through this multi-faceted terrain. With it, you’ll get an overall idea on how to design a data warehouse that provides a strong foundation for all levels of data analytics.

Key highlights

  • Steps to build a data warehouse include defining data sources, business goals, and stakeholders during the discovery phase; designing the logical and physical data model using an approach like Inmon, Kimball, or Data Vault; implementing data pipelines, testing, and deployment; facilitating after-launch support.
  • Choosing between data warehouse design approaches (Inmon, Kimball, or Data Vault) and deployment model (cloud, hybrid, or on-prem) depends on company size, data complexity, and reporting needs and determines how scalable, flexible, and maintainable the warehouse will be.
  • Most challenges in DWH projects come down to data quality, so strong data validation, governance, and continuous monitoring are what make the warehouse truly trustworthy.

What is a data warehouse? 

A data warehouse is a centralized, subject-oriented data repository optimized for analytics and reporting. Unlike transactional databases, it consolidates data from multiple sources into a single, query-ready structure that powers business intelligence across the organization. In other words, it’s a single, governed, and coherent source of truth that analytics and reporting can rely on.

You might wonder: Why not just query those systems directly? The problem is, their data is often inconsistent: formats, time zones, naming conventions, in other words, ways of tracking the very same entity can differ.

Before information lands in a warehouse, it’s cleaned from noise and duplicates, normalized into a consistent schema, enriched with contextual metadata, and sometimes aggregated to different levels of data granularity, for example, raw sales transactions might be rolled up into daily totals per store or monthly revenue per region, to suit different analytical purposes. Once a unified view of corporate data is facilitated within a warehouse, your data analytics initiatives, be it business intelligence systems or AI-driven solutions, get a solid, dependable foundation.

To deliver reports that are not just visually appealing but genuinely reliable, a well-designed data warehouse must enforce multiple layers of validation. These checks ensure that data arrives accurately. Let’s assume there are ten orders in the CRM. When the DWH pulls these, it should capture all of them along with the payments linked to each order from the financial system. A mature DWH automatically validates that every order and its matching payment have been successfully ingested, and that no data is duplicated. If any inconsistencies are detected, the system flags them before they cascade into reporting errors.

– Vladimir Orlov, Data Engineer, Instinctools

Data warehouses vs data lakes vs data lakehouses vs database vs data marts

There are many ways to store data, and the choice of suitable ones usually comes down to one question: what does the business expect to get from it? Driven by the type(s) of data stored and the way it’s organized, a tangle of terms of different data storage systems has emerged. Let’s untangle it.

  • Database is a structured collection of data used for day-to-day operations and transactional processes. It can be of two types: relational (~structured tables with predefined relationships) and non-relational, or NoSQL, (handle semi-structured or unstructured data like documents or JSON files).
  • Data warehouse is essentially a relational database, but it’s designed to store preprocessed data from various corporate databases, mainly for analytical purposes.
  • Data lakes can be described as data warehouses where no strict rules for data schema design or preprocessing apply. It’s a great place to dump all sorts of raw data (structured, semi-structured, or unstructured) from an unlimited number of data sources in a quick way to clean and organize later. 
  • Data lakehouses combine the discipline of a data warehouse with the flexibility of a data lake. If a business needs a single environment for both analytics-ready data and advanced data science workloads, data lakehouses are the way to go.
  • Data mart is basically a subset of a data warehouse that provides data for specific needs of a particular business unit, for example for HR, sales, or marketing teams.

There’s also a data swamp, which is what a data lake can turn into if it’s not properly managed. When data is piled up without structure, context, or metadata, the lake gradually fills with “mud,” and instead of being a source of insights, it becomes a true swamp where finding data, let alone, leveraging it, is to no avail.

Why might companies need to build a data warehouse? 

Sooner or later, every business runs into the same problem: data piles up across different systems, scattered and disconnected, making it hard to understand what’s actually happening in the company. That’s usually when the C-suite decides they need to keep the big picture in focus. In practice, this is the moment when most BI projects, involving building a data warehouse from scratch, start getting the green light.

But apart from faster and more reliable decision-making across the organization, creating a data warehouse brings side benefits:

  • Single, trustworthy version of truth: everyone is aligned as data quality, consistency, and accuracy are maintained across all systems and reports. 
  • Operational efficiency: less manual work reconciling or cleaning data.
  • Better compliance and governance: it’s easier to track data lineage, enforce data policies, and meet regulatory requirements.
  • Smoother integration with new tools: simpler and more reliable connections to any corporate systems or AI/ML models.
  • Improved collaboration: teams across departments can quickly access and confidently work with the same curated datasets.

Data warehouse design approaches

Before comparing design approaches, it helps to map what a warehouse is made of. 

From a functional perspective, which focuses on the data lifecycle within the warehouse, the architecture breaks into four layers:

  • Source layer: an entry point of the data warehouse architecture, where data from databases, corporate systems, external APIs, and other sources originates.
  • Staging layer: an intermediate transition area that temporarily stores data as it moves from source systems toward the warehouse. This is where quality checks, error assessment, and integrity validation happen to prevent inconsistencies, duplicates, missing values, or anomalies from reaching the storage layer.
  • Storage layer / warehouse layer: a central repository where processed, cleaned and structured data is stored for long-term use.
  • Presentation layer / consumption layer: a final layer, where users access the data via user-friendly interfaces within BI tools or data visualization platforms.
layers of data warehouse

Depending on how these layers are distributed, a data warehouse architecture can be:

  • Single-tier. Everything, from source to consumption layer, exists in a single tier.
  • Two-tier. A presentation layer is separated.
  • Three-tier. Source, storage, and presentation layers have their own isolated tiers.

As data sources grow more diverse, analytics more complex, and user concurrency higher, the need for separation also increases. While a single- tier architecture works fine for tiny warehouses (<100 GB), large, high-complexity storage systems benefit from a three-tier architecture, which is more scalable, performant, and manageable.


Now that we’ve covered the layers of a data warehouse, let’s look at three established data warehouse design approaches: Inmon, Kimball, and Data Vault. Each affects how you design data warehouse architecture, structure data marts, and handle change management down the line.

Inmon (top-down)

Developed by Bill Inmon, the top-down architecture strategy implies designing a highly normalized central data warehouse first, and then creating data marts subsequently from it.

The Inmon approach employs a schema strategy centered on normalized 3NF (Third Normal Form) structures. Data is organized by concept: each subject area (customers, orders, products) exists in its own table with carefully structured relationships through primary and foreign keys.​

While 3NF schemas ensure data integration and consistency, they’re not designed for direct business user access. Extracting insights from normalized tables requires query structures that are too complex, which makes them less suitable for end-user analytics without additional transformation layers.

inmon model

Kimball (bottom-up)

As opposed to Inmon’s, the Kimball approach, also known as the bottom up approach in data warehouse design, starts with department-level data marts and builds up to the enterprise warehouse. Fundamentally, it’s built around dimensional modeling, which prescribes the use of star schemas or snowflake schemas.

Those dimensional schemas allow for rapid query execution and user-friendly analysis due to their inherent advantages:

  • flexibility to slice and dice data easily
  • extensibility to accommodate business changes
  • high performance on relational databases
kimball model

Data vault (DV)

However, today, organizations most often turn to a third data modeling approach – Data Vault, introduced by Dan Linstedt. It’s considered a hybrid model, as it combines elements of Inmon’s enterprise-wide, normalized architecture and Kimball’s subject-area-focused, dimensional design.

A distinct modular schema structure beneath this approach consists of:

  • Hubs, containing core business concepts identified by business keys and surrogate keys
  • Links, representing associations between hubs
  • And satellites, holding descriptive attributes grouped by source or change frequency.​

Such a structure is built so that adding new data sources doesn’t require model reconstruction. Query efficiency is accompanied by flexibility, scalability, and rapid adaptability of new business relationships.

data vault model
Data warehouse design approaches at a glance
ApproachCore ideaStrengthsTrade-offsBest fit for
Inmon (top-down)Build an enterprise, normalized warehouse first; publish marts after.– Strong integration and consistency- Clear governance- Good for cross-functional reporting– Not self-serve friendly- Slower time-to-value- Complex queries for end usersEnterprises prioritizing data integration, quality, and governance across many domains
Kimball (bottom-up)Start with dimensional marts; integrate into a cohesive warehouse later.– Fast time-to-insight – Analyst-friendly (“slice and dice”)- Strong performance on relational engines– Risk of mart sprawl without governance- Harder to enforce enterprise-wide consistencyTeams needing quick analytics wins and strong self-service BI with good governance discipline
Data Vault (DV)Hybrid: integrate like Inmon, serve analytics via downstream marts like Kimball.– Easy source onboarding without remodels- Excellent historization/auditability- Scales well, flexible over time– More complex ETL/ELT planning
– Need for advanced metadata-driven automation tools for sustainable maintenance
Organizations with many, changing sources, compliance/audit needs, and a plan to publish dimensional marts for BI

Find out which architecture approach fits your data warehouse development project best

Talk to experts

Four steps to setting up a data warehouse

Even though every project has its own flavor, these are the data warehouse design steps you generally need to follow.

Below are the four steps for building a data warehouse step by step. This process applies whether you’re building your own data warehouse from scratch or extending an existing analytics stack. The full timeline typically runs 3–9 months, depending on data sources, scale, and the chosen design approach.

1. Discovery

The discovery phase is where the whole foundation gets set. Everything that comes after, from design to deployment, rests on it.

The first thing to nail down here is the business objectives the company is trying to reach. Pain points, priorities, and expectations are mapped against how processes currently operate and which data sources are available.

When a company has hundreds of data sources, it takes time to dig into what exists in each and how it’s meant to support analytical needs. Jumping straight into data warehouse building without these exploratory activities is a recipe for costly missteps caused by poorly designed data models or redundant ETL/ELT pipelines.

– Ivan Dubouski, AI Lead Engineer, Instinctools

With every source of data examined inside out, you then decide on the number of tiers, how data flows between layers, and where data transformation happens (whether to use ETL or ELT further).

Besides, here you determine whether the warehouse will be deployed on-premises, in the cloud, or using a hybrid environment. Although a fully on-premises deployment is rare for modern projects, it remains a highly reliable option when full ownership and control of all data is a must, for example, in strict data compliance environments.

For most organizations, though, cloud or hybrid setups offer greater scalability, faster deployment, and lower operational overhead, while still allowing tight control over critical data where necessary. The market is full of cloud-based solutions like Snowflake, Amazon Redshift, Google BigQuery, etc., capable of deploying data warehouses quickly and handling diverse workloads with minimal infrastructure management.

– Vladimir Orlov, Data Engineer, Instinctools

2. Designing both logical and physical data model

First comes the logical data model. Data engineers walk the documented processes and agree on the core entities, for example, customer, order, device, shipment, claim, and the exact relationships between them, pinning down business keys and the few rules that must always be true.

Once that picture is stable, experts cast it into the physical model: 

  • each entity becomes a table or a set of tables
  • keys are translated into primary-key columns or composite hashes
  • data types are chosen to match the source precision while keeping storage and compute costs in view

This is where decisions are made about how each piece of information gets stored, so it can be found fast, stay accurate, and grow over time without breaking the budget. It’s also where the first rules of security are set (who can see which fields).

data warehouse

3. Implementing data pipelines, testing and deploying a data warehouse

Here, your data warehousing setup begins to breathe. Data starts flowing automatically from sources to the warehouse. For this flow to be consistent and reliable, a whole lot of measures need to be taken:

  • Writing transformation scripts (SQL or dbt models)
  • Configuring orchestration (e.g., Airflow DAGs for daily runs).
  • Implementing incremental loads (only process new/changed data)
  • Building data validation checks (record counts, nulls, referential integrity)
  • Setting up logging and alerting for failures

Special attention should be given to testing. Hit it from every angle to verify all aspects of data quality.

  • Data accuracy: Does total revenue in DW match source systems?
  • Data completeness: Are all records loaded each day?
  • Transformation logic: Are derived metrics (e.g., average order value) computed correctly?
  • Performance: Are queries fast enough for users?

4. After-launch support and maintenance

After going live, the warehouse should hum along under constant watch. Its health needs to be continuously monitored and issues – flagged and resolved as they arise. When new data sources have to be added or ETL pipelines adjusted, maintenance specialists are supposed to take care of it all.

Hard-won data warehouse best practices our data architects rely on

Before you dive headfirst into data warehouse creation, take a minute. These data warehouse design tips for development can help reduce rework and speed up time-to-value, whether you’re creating a data warehouse for the first time or modernizing an existing one.

  • Include all key specialists in the data engineering process from the start. Bring in the data/solution architect, ETL developers, data engineers, system analysts, and other necessary experts early on.
  • Collaborate with stakeholders across departments. That’s how you capture the needs and expectations of all parties, so you build solutions that solve problems, not create new ones.
  • Embrace atomic-level storage. Keep data at its most granular level so you always have fidelity needed for reprocessing. To prevent cost creep of saving every event, transaction, or record, store them in a raw/bronze layer on S3, GCS, or Azure Blob. 
  • Centralize business logic. Define all metrics in the warehouse instead of letting each analyst calculate them in dashboards. This keeps results consistent across teams.
  • Validate and monitor data quality continuously. Put all checks for missing, inconsistent, or outdated data upstream of BI to capture issues before they reach dashboards and protect trust in reporting.
  • Engineer ETL/ELT pipelines with error handling and recovery in mind. Ensure that missing or corrupted data can be fixed without disrupting downstream reporting.
  • Don’t take a step without solid data governance. Make lineage, stewardship, regular data quality audits, and continuous improvement processes a part of your data governance strategy.

Set your DWH development project off to a good start with Instinctools

Reach out now

Where most data warehouse projects get stuck 

From what we’ve seen firsthand across countless similar projects, 80% of the challenge comes from data quality issues.

When the data comes in, the client wants it integrated and ready for reporting, but the necessary relationships… just aren’t there. You end up pulling in extra datasets, reconciling records, and often backfilling missing fields. Turning disconnected, incomplete data into something analysis-ready is fiddly, tricky, but totally doable with the right expertise and hands-on attention.

– Ivan Dubouski, AI Lead Engineer, Instinctools

Other painstaking things during data warehouse implementation steps can be:

  • Figuring out how legacy systems expose data and how to access it reliably
  • Striking the right balance between handling always-growing data volumes and maintaining fast query performance
  • Keeping the project on track with ever-changing business requirements

Need professional assistance on how to plan a data warehouse project?

Contact us

Analytics and reporting are only as good as the data warehouse behind them

Even the most advanced analytics solutions are worthless if the warehouse behind them is a mess. Garbage in, garbage out, that’s how it’s always worked.

Building a scalable data warehouse is never glamorous. It’s uncovering connections where none seem to exist and bending the chaos of data into something reliable. Do it alone, and you risk flawed reports, endless rework, and costly missteps. Bring in the experts, and suddenly the pieces start to fit, and your data analytics undertakings earn your trust.

Set a strong foundation for your enterprise data analytics

Get started now

FAQ

What is a modern data warehouse?

Modern data warehouses act as a centralized repository built using cloud-native services for storing all data types (structured, semi-structured, and unstructured) to power interactive BI dashboards, predictive models, and real-time ML pipelines.

How do you build a data warehouse?

We start from identifying business objectives, then extract and preprocess source data, load it into a scalable warehouse schema, schedule ETL/ELT pipelines to incrementally refresh it, and expose the whole model to BI tools.

What technologies should I use when designing a data warehouse?

Depends on where you want your data warehouse to be stored. Pick cloud platforms like BigQuery, Redshift, or Snowflake if you want someone else to run the workloads. Stay classic with Teradata or SQL Server if you’d rather keep the drives in your own server room.

What are some of Instinctools’ data warehouse projects?

From raw data ingestion and designing data models to board-ready dashboards, Instinctools delivers end-to-end BI implementation services that let enterprises act on insights, not instincts.

How long does it take to build a data warehouse?

Building a data warehouse typically takes 3-9 months: 2-4 weeks for discovery, 4-8 weeks for design, 2-4 months for implementation, plus ongoing support. The timeline depends on data sources, scale, chosen design approach (Inmon, Kimball, Data Vault), and whether you build from scratch or migrate.

What are the steps in the development of data warehouses?

Four steps to build a data warehouse: 1) define sources, goals, stakeholders; 2) design the logical and physical data model with Inmon, Kimball, or Data Vault; 3) implement pipelines, test, deploy; 4) provide post-launch support and optimization.

Can I build my own data warehouse?

Yes, you can build your own data warehouse with cloud platforms like Snowflake, BigQuery, or Redshift, plus open-source tools (dbt, Airflow). For small teams, building a working data warehouse from scratch can take a few weeks. Enterprise-scale builds usually need data engineers and a data architect.

What is the ultimate outcome of a data warehouse?

The ultimate outcome is a single source of truth: consolidated, clean, query-ready data that powers business intelligence, analytics, and AI/ML workloads. A well-built data warehouse turns scattered operational data into reliable insights that leadership can trust.

Preparing Data for AI and Machine Learning: A Production-Ready Playbook

Key highlights

  • Machine learning data preparation is a mandatory part of any ML initiative aiming to avoid the ‘garbage in, garbage out’ trap.
  • Getting data from raw to AI-ready can take up to 80% of the ML project timeline, but the effort ensures high accuracy of the model outcomes.
  • Well-thought-out data collection, hybrid labeling, and cleaning are the compulsory steps of the data preparation pipeline, data augmentation is an optional one.

Data is the backbone of any analytical system. Nothing has changed in this regard with the industry-wide adoption of AI technology. Drawing on our hands-on experience in delivering AI solutions across industries, this playbook walks you through every step of preparing data for AI, from collection and labeling to cleaning and augmentation, to help you build a reliable dataset that powers accurate, bias-free models.

What does data preparation mean for AI and machine learning? 

Data preparation for machine learning and AI means collecting raw data from internal and external sources, labeling it, and carrying out data quality improvement to produce a well-calibrated, bias-free dataset for training an ML model. It’s not a one-off step but a continuous process, since each time new data arrives, it must be labeled, cleaned, and checked for bias.

Why prepare data for machine learning and AI?

Data preparation is the most time-consuming part of any ML project, taking up to 80% of the overall timeline. But this initial investment in data discovery pays off manifold. 

  • Grounded confidence in your data. At the AI scale, the old garbage-in-garbage-out adage evolves and takes the form of “garbage in, beautifully phrased/formatted/visualized garbage out.” Putting data preparation on the front burner saves you from falling into a trap of false confidence in the model’s outcomes without noticing that “something is rotten in the state of Denmark.”
  • Highly precise decision-making. Clean, bias-free, use-case-relevant data leads to well-thought-out business decisions.
  • Ability to deliver hyper-personalized user experience. In highly competitive domains, say, streaming services or ecommerce websites with AI-driven recommendation systems at their core, the level of data preparedness directly influences user experience, helping companies win new customers and retain existing ones.

Data readiness levels for AI & ML 

ML models are only as good as the data they’re fed. And that data needs to go from messy to clean and purpose-ready. 

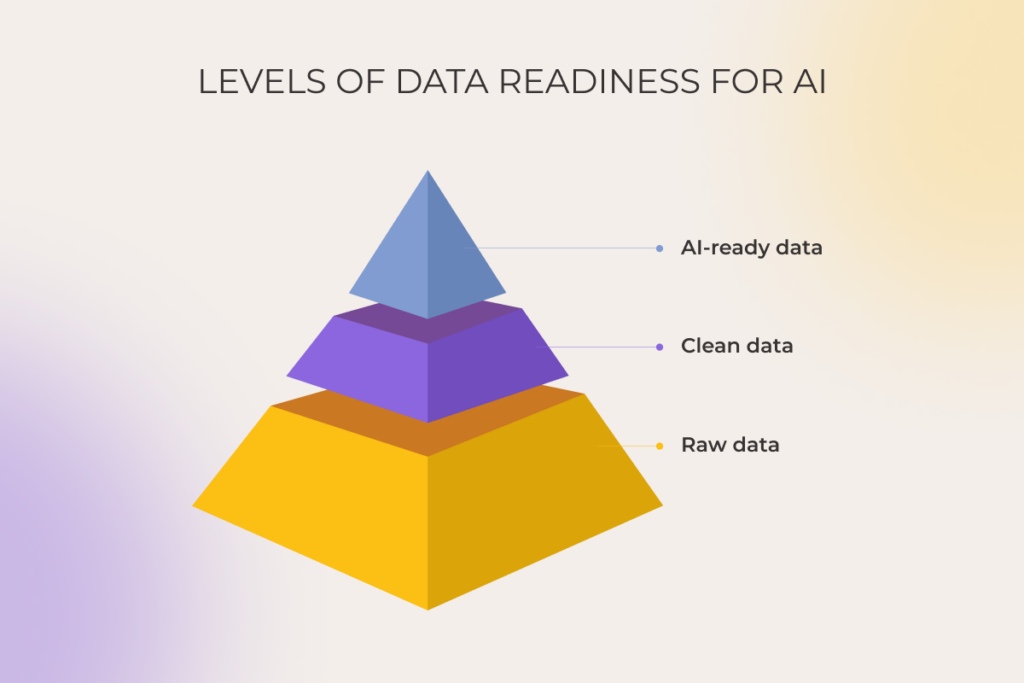
  • Raw data. Unstructured data in multiple formats and from various internal and external sources. It’s consolidated in one place, usually a data lake or a lakehouse, but hasn’t undergone any checks. 
  • Clean data. Structured data that has been freed of duplicates, outliers, and missing values, making it usable for various projects. Clean data is typically stored in a data warehouse for easier access and management. At this stage, the intended use of the dataset isn’t yet defined.
  • AI-ready data. Once the task is defined, data scientists get the clean and labeled data and ensure it fits the use case. For instance, they eliminate irrelevant data, such as dog images in a dataset for training a fare‑evasion detection model. At this point, they also determine whether the dataset needs to be reduced or artificially augmented with synthetic data.
An infographic showing AI and machine learning data preparation readiness levels

Scanning your dataset for duplicates and missing values is a shortcut to understanding how much your data is messed up. For instance, you can use Python libraries like Pandas and Great Expectations to run an auto check. Even more than 3% of exact duplicates in your dataset is strong evidence that it’s nowhere near AI-ready. 

— Pavel Klapatsiuk, AI Lead Engineer, *instinctools

How to prepare data for machine learning and AI

Behind every thriving AI model is a lot of unglamorous preparation work. Here are our practice-proven tips on how to make each step of that groundwork count.

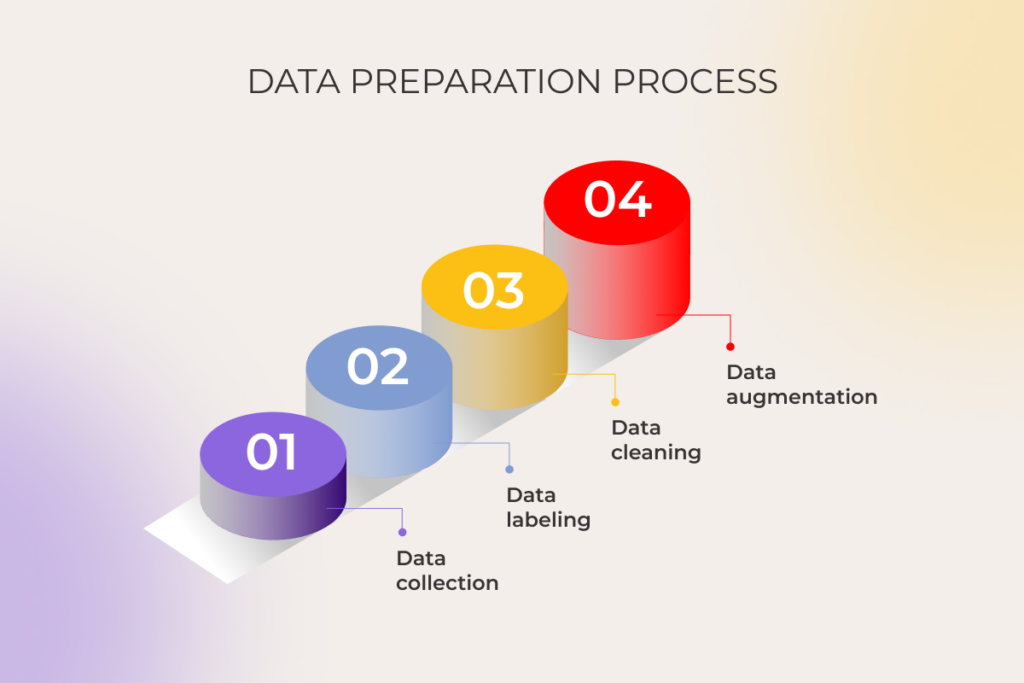
1. Data collection

The first thing to do for successful data collection is getting an experienced data scientist on board. Once the purpose of your ML project is clear, they will determine the right strategy to collect the data and prevent potential bias from slipping into a training dataset. 

Say, for a global online retailer that wants to analyze customer behavior, a data expert can anticipate the WEIRD bias (oversampling data from Western, Educated, Industrialized, Rich, and Democratic populations) and head it off by diversifying data sources to include inputs across regions, cultures, income groups, etc.

— Pavel Klapatsiuk, AI Lead Engineer, *instinctools

The same goes for data noise, which has to be filtered out in advance. For instance, in churn-prediction work spanning website, CRM, and ad platforms, not every event belongs in training. You’ll have to sift out the noise, such as test accounts, marketing email previews that look like real opens, competitors’ clicks, price-checkers’ activity, and other artifacts.  

If your business involves IoT devices, the physical world writes itself into your data (mechanical vibration, temperature spikes, electrical hum), turning real-world noise into data noise. In one of our oil and gas projects vibrations from drilling rigs were making it tricky to identify meaningful signals. Our data scientist had to go through the data fields filled in according to the info from sensors to determine the most informative ones and down-weight the rest to lower their noisy impact.

So where to collect the data from?

  • Internal sources, such as databases and business operational systems (ERP, CRM, inventory software, etc.). 
  • External sources, such as public databases, social media platforms, third‑party datasets, publicly available or purchased reports and statistics, etc.

If you’re a startup without rich internal data, check for valid publicly available datasets. Even if there’s no exact match, you can still resort to web scraping and assemble a solid dataset from free public sources.

— Pavel Klapatsiuk, AI Lead Engineer, *instinctools

Also remember to put a premium on data lineage from the very start of machine learning data preparation. When you can trace the path of any data point within your dataset end-to-end, fixing errors and auditing becomes a walk in the park. 

2. Data labeling

After collecting the raw data, you need to specify its context for the ML models by labeling it. The labels, or annotations, make data more consumable for a model and enable it to interpret the information correctly, contributing to the overall accuracy of the outputs.

While data labeling can be automated, our hands-on experience proves that if you want the ML model to masterfully imitate human perception, thinking, and judgment, at least some part of the labeling should be done by humans. 

— Pavel Klapatsiuk, AI Lead Engineer, *instinctools 

Here’s how to make the most out of the hybrid labeling approach while not spending a fortune:

  • Create a ‘golden’ seed set. Have three human annotators cross-label 5-10% of the dataset (size-dependent). Use a brief guideline, measure inter-annotator agreement, and resolve disagreements. You don’t need senior data scientists here – trained annotators are enough.
  • Train the auto-labeler, then loop. Use the golden set to train an AI-assisted labeling tool (passive learning), auto-label the rest, and spot-check samples. Route uncertain/low-confidence items back to humans (active learning) until quality stabilizes.
  • Pick the right tooling. Available options range from open-source platforms like CVAT and Label Studio to SaaS solutions like SuperAnnotate and LabelBox.
  • Run a final human check. Annotators from the first step validate auto-generated labels to ensure consistently high precision throughout the dataset. 

3. Data cleaning 

Once the whole dataset is labeled, clean it from duplicates, outliers, missing data, irrelevant or incorrect records. As we’ve mentioned earlier, you can leverage Python libraries like Pandas and Great Expectations to detect and flag all issues automatically. 

However, sometimes you do need to enrich your dataset with inconsistent and incorrect inputs on purpose. It applies to the conversational AI chatbots of all kinds, from general customer support bots to specialised ones like flight booking assistants, financial advisors, etc. You have to take into account user queries with typos and misspellings, syntax and grammar errors, to improve intent recognition rates. 

Further decisions like “should the outliers and missing values be removed, imputed, or corrected using domain knowledge?” require human judgment. 

Don’t rush to anonymize data at this stage! While encryption is a vital data protection mechanism, if applied to an uncleaned dataset, it only complicates spotting irrelevant and incorrect entries. It’s better to double down on sensitive data anonymization after you get a noise-free, clean dataset.  

— Pavel Klapatsiuk, AI Lead Engineer, *instinctools 

4. Data augmentation

It may happen that after all the cleaning, you’re left with too little data to train the ML model (“too little” being a spectrum that varies from tens of patient records for a niche medical research to thousands of user interactions for an ecommerce customer study). That’s where data augmentation comes in handy.

For example, a dermatology R&D lab is building AI-powered software to make a preliminary diagnosis based on skin photos. For a rare cancer like cutaneous T-cell lymphoma, early signs can resemble eczema or psoriasis, and examples are scarce. In this case, a data scientist can resort to image augmentation (zoom, flip/mirror, rotate, crop, slight lighting shifts) to expand the dataset. In less regulated contexts, synthetic images can be generated based on the originals as part of the machine learning data preparation.

An infographic showing the process of preparing data for AI and machine learning

If you still have data preparation-related questions, find an AI and ML consulting services provider to cooperate with.

AI/ML data preparation checklist

Here’s a short recap of the data preparation work that prevents rework. Do this before the modeling starts:

  • Engage a data scientist early to design collection, cut noise, and preempt bias
  • Apply a hybrid data labeling approach: create a human ‘golden set’ → train an auto-labeler → spot-check low-confidence items
  • Automate the first pass of data cleaning, then apply human judgment to drop, impute, or correct with domain rules 
  • Anonymize sensitive data after labeling and cleaning it
  • Augment image and text data if the training dataset ended up being too small after the previous AI data preparation steps

Would you rather delegate the hustle of machine learning data preparation to a trusted partner?

Let’s talk

Data preparation is the heavy lifting that accelerates every next step

Data preparation is like getting the soil ready before you plant. If the soil is full of rocks and weeds, the seeds won’t take. It’s the same with AI: clean, unbiased, balanced data gives your model the fertile ground it needs to perform well.

Get the basics right with our data scientists’ support

Book a free session

FAQ

What is data preparation in AI and machine learning?

Data preparation for machine learning and AI is the process targeted at cleaning the data, eliminating the bias it may contain, and ensuring the data is relevant to your AI use case.

How clean is “clean enough” for machine learning data?

Data without missing values, duplicates, and outliers is clean enough for training an ML model. The catch is that cleanliness alone doesn’t signal the end of data preparation for machine learning. 

Do I need to label data for unsupervised learning?

The primary purpose of unsupervised learning is analyzing and clustering unlabeled datasets to uncover meaningful patterns in data. You don’t need to label data, the algorithm will generate its own labels for the human labelers to interpret.

What are the key stages of AI/ML data preparation?

Stages of preparing data for AI & ML include pre-collection data assessment, data collection, labeling, cleaning, and augmentation or reduction if needed.

Why is data preparation crucial?

Prepared data is a mandatory prerequisite for getting an accurate, bias-free ML model and, thus, precise decision-making. Invest in modeling with unprepared data as a foundation, and you’ll end up with a harmful solution producing inaccurate outputs.

Leveraging Data Analytics in Construction for Smarter Projects

Key highlights

  • In 2025, advanced data analytics in construction is a must-have, given the industry’s fragmented data landscape and its effect on construction productivity.
  • Implemented strategically, construction data analysis can introduce improvements across the entire value chain from design to post-project evaluation.
  • Scale and value come from targeting high-impact, limited-scope projects that can be replicated across sites and projects.

Talk to five general contractors, and four will bring up lagging productivity as the most significant industry challenge today. Globally, engineers and constructors are struggling to complete projects even in their current pipeline, and a myopic approach to data is one of the reasons why. 

While data analytics in construction cannot single-handedly prevent schedule slippage and budget blowouts, it can at least shine a light on early warning signs, bringing prospective indicators into focus before issues escalate.

What is сonstruction analytics?

Construction analytics builds upon historical and real time data from BIM, ERP, sensors, wearables, drones, and project management tools to drive smarter decisions across construction projects. When it comes to advanced construction data analytics, it doesn’t just track and store data in data lakes and warehouses. It interprets the data and connects the dots, using NLP, ML models, GenAI, and other cutting-edge tech.

That data then flows into dashboards or digital twins to signal issues, such as schedule slips or safety risks, and debrief decision-makers on project performance, resource utilization, and risk areas.

Why data analytics in the construction industry matters

A shortfall in construction output looms in the built environment. The worries about the

Architectural, Engineering, and Construction (AEC) industry’s prospects are understandable: labor shortages and productivity challenges may lead to a dip in construction output of up to $40 trillion. Digital technologies, and data analytics tools, in particular, can flip the script in the high-stakes construction industry.

Improved decision-making

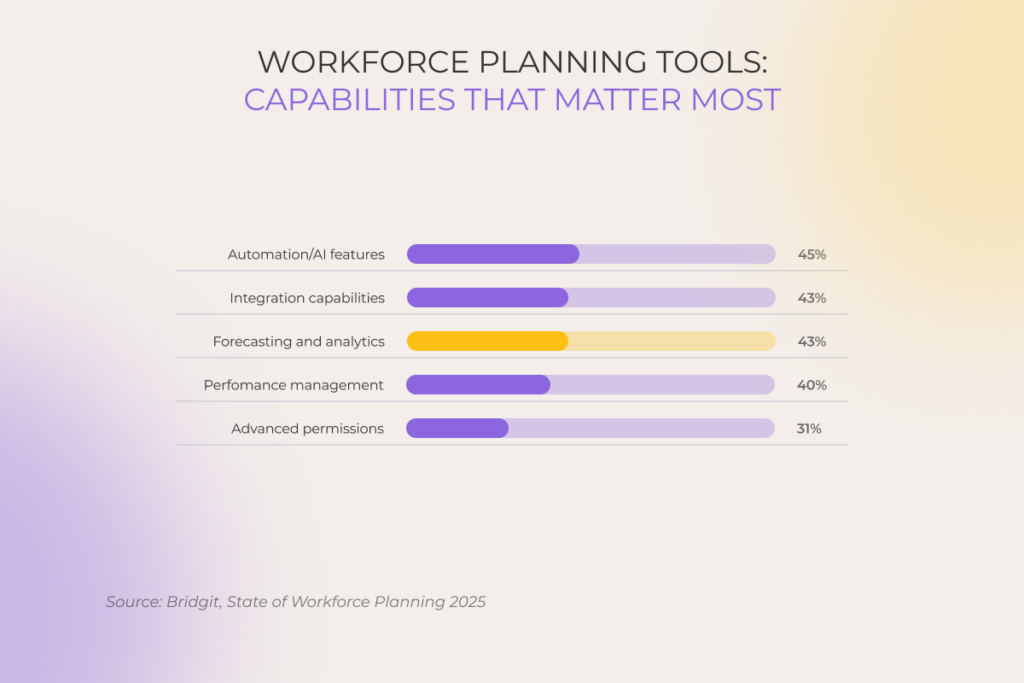
Over 43% of engineering and construction (E&C) leaders say they urgently need forecasting and analytics to anticipate labor needs and optimize teams.

Insights distilled by data analytics for construction go a long way, from fewer costly delays and rework to better resource allocation and on-site efficiency. With real-time visibility across sites, E&C firms can orchestrate labor, materials, and equipment with more precision, long before delays and cost overruns eat into the project timeline or budget.

For example, Bechtel, a global engineering and construction leader, deployed 60,000 RFID tags to track 100,000+ components for three LNG plants, which cut material tracking time by 50% and sped up logistics.

Increased productivity

Construction companies have been trapped in a productivity rut forever. In fact, the industry will need to double its growth rate to meet the optimistic projections for 2040. By advancing construction analytics, AEC teams can automate routine decisions like auto-adjusting crew schedules, spotting equipment underuse, and predicting material shortage, keeping the project moving without stalls.

Cost savings

Under the traditional linear engineering, procurement, and construction (EPC) model, the design is finished when the construction is already underway, resulting in costly late-stage changes and bloated expenses. Predictive analytics allows teams to layer schedules and costs early in the project, which connects design intent to execution and mitigates budget risks.

To that end, historical data analysis can also circle back to former construction projects to develop more accurate estimates for future projects. 

During the construction of the Lusail Iconic Stadium (Qatar 2022 FIFA World Cup), the team leveraged predictive algorithms to analyze procurement patterns and site logistics. This helped them cut material waste by 25% through just-in-time deliveries and optimized placement.

Enhanced safety

The annual number of fatalities in the construction process (1075 work-related deaths in 2023) is the highest among industries. By analyzing real-time data feeds from wearables, connected equipment, drones, and sensors, data-based risk analysis tools can catch unsafe conditions on the spot. ML models can also predict high-risk scenarios, while computer vision systems can keep an eye on using the appropriate PPE.

Optimized project outcomes

Analytics in the construction industry isn’t just about reacting faster, it’s about building smarter from the start. When longitudinal data is integrated across all project phases, analytics tools ensure that construction management reflects real field conditions rather than isolated static plans developed in a vacuum. 

Instead of leading with initial estimates and firefighting, teams can make evidence-based decisions in real time, reallocating resources, rerouting materials, and adjusting timelines in line with site performance. 

While working on 3 projects spanning 51,375 sqm (552,975 sqft), one of our clients relied on our custom performance-data tool to evaluate each subcontractor’s completion rates against the original plan. This not only helped our client stay ahead of issues like delays in material deliveries for the electrical teams but also allowed them to keep the overall project timeline on track.

Be one step ahead of your project pipeline with our custom data analytics development

Get a quote

Built intelligence in action: real-world construction analytics examples

A single construction project generates millions of data points. Equipment usage logs, material deliveries, supply chain lead times, and other operational data snowball into a tangle of insights. Being able to collect, process, and make sense of that farrago gives E&A companies the potential to realize value throughout the entire project lifecycle.

Project planning and budgeting: “Are we setting ourselves up for overruns?”

Construction data analytics tools inherit their intelligence from past performance, including internal unstructured data on things like RFIs, change orders, and weather delays, along with external data such as commodity prices. This combination of data allows forecasting systems to come up with more accurate project plans that factor in recurring risks and on-the-ground conditions.

For example, if HVAC procurement or permit approval timelines led to delays in the majority of past hospital projects, planning tools can embed those patterns into the timeline of a new build. This also gives a heads-up to companies to adjust their milestone targets or pre-order long-lead items. 

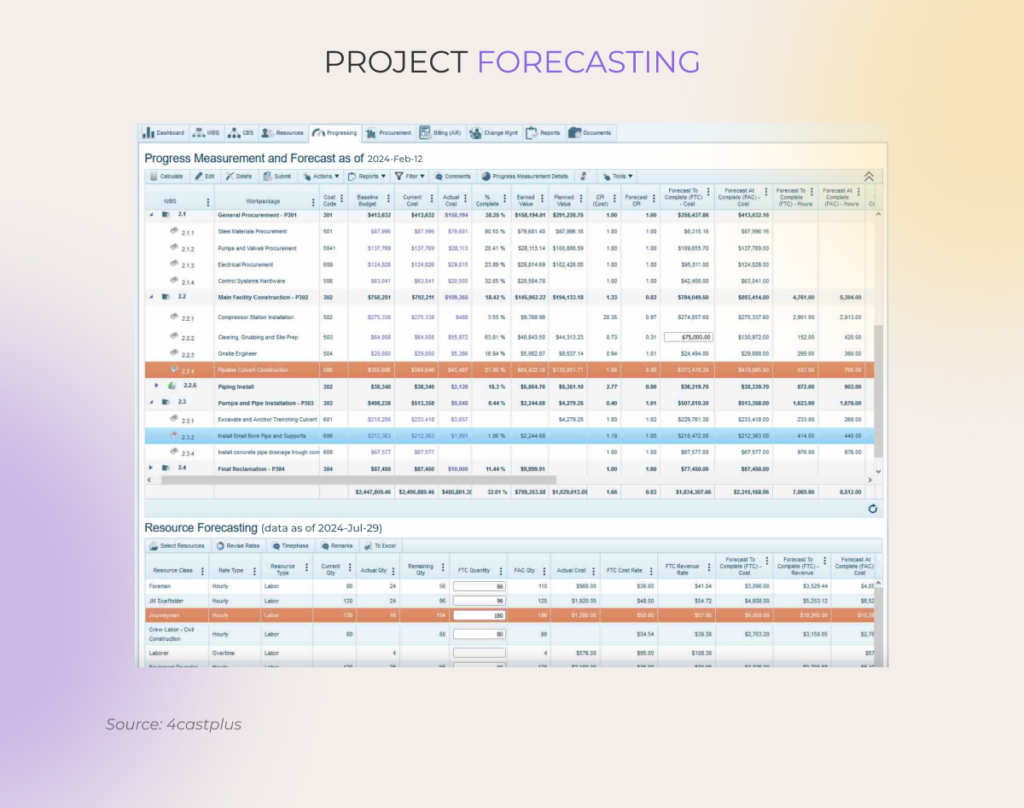
Additionally, sophisticated forecasting tools can plug into BIM to simulate project scenarios and optimize resource allocation and sequencing, long before construction begins.

Resource allocation: “Do we have the right people, equipment, and materials for that?”

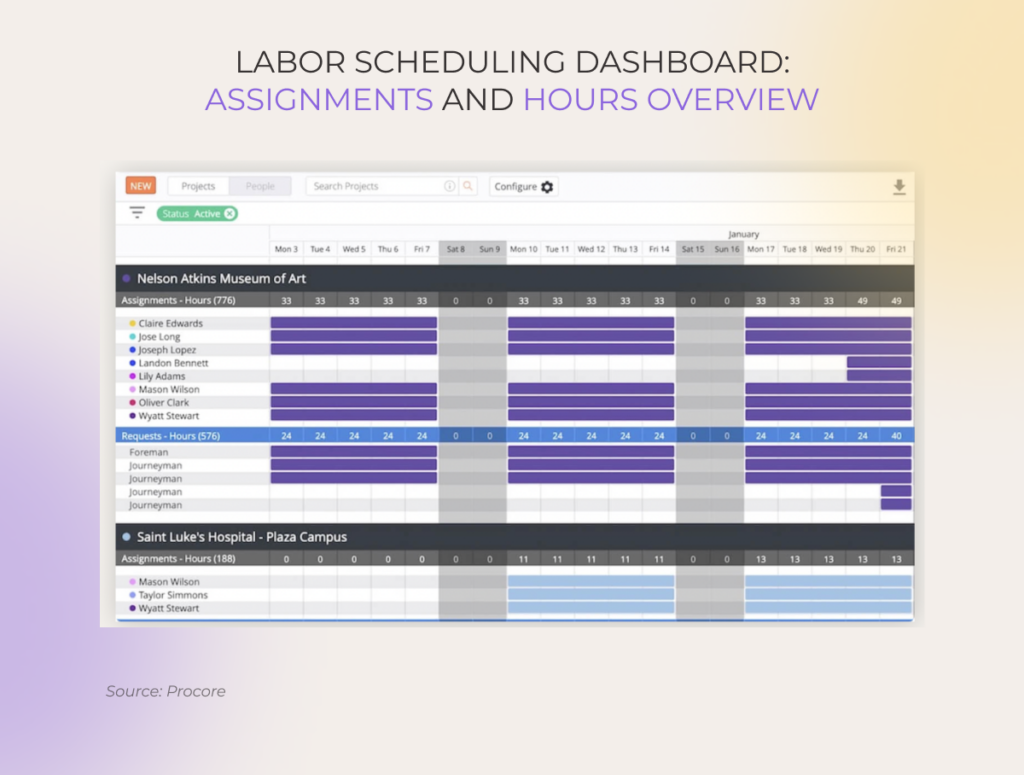
At the workforce level, digital analytics tools can compare labor capacity against active and upcoming project needs, breaking down roles, timelines, and workload projections. For example, if the analytics suite detects a surplus of superintendents, project managers can re-assign them to other struggling sites or proactively line up new work by bidding on upcoming projects.

Advanced analytics systems can also comb through historical equipment usage rates, idle time, fuel consumption, and material delivery patterns to highlight areas for optimization in future projects. For instance, if telematics data shows a crane sits idle 30% of the time on similar projects, project managers can rotate equipment across sites to maximize utilization. 

Bidding: “Should we bid on this project, and if so, how much?”

Data-driven bidding tools tie historical data such as labor types, contract arrangements, local spending trends, win/loss ratios, and other retrospective information to project profitability and the right contingency cushion. Over time, such insights can support long-haul forecasting of workload and financial performance, allowing construction executives to match bidding strategies with financial and operational goals.

For one of our clients, data analysis of over 100 past projects demonstrated that less obvious factors like unionization rates and contract types (not just region or sector) have the strongest impact on profit margin. The revealed insights helped the company to overhaul its bidding strategy and skew it toward higher-margin project profiles.

Predictive equipment maintenance: “What equipment do we service now before it goes down later?”

Unlike operator logs and anecdotal evidence, sensors and telematics provide a real-time pulse check on machine health by collecting data on engine temperature, vibration levels, and other performance parameters. Analytics solutions ingest that real-time data and flag subtle signals of wear or potential failure. 

Based on the configuration, data-driven maintenance systems can either alert teams to anomalies or autonomously schedule maintenance orders. For example, if the vibration data from a bulldozer’s sensors surpasses a predefined threshold, the system can trigger a maintenance request months before downtime instead of waiting for it to fail.

Since they recommend service based on condition data rather than fixed intervals, maintenance tools extend the lifespan of assets, save thousands of dollars in maintenance costs, and ensure that machinery is serviced exactly when needed: no sooner, no later.

Subcontractor performance analysis: “Are our subcontractors walking the talk?”

Because of paper-based processes and inconsistent reporting, construction companies can’t get a handle on subcontractor performance until it’s too late. Let’s say the electrical subcontractor is scheduled to finish rough-ins this week. Ideally, a company should be able to access data like their daily reports, inspection issues, and budget tracking in real time to spot potential drag-ons in their track.

With manual tracking, this level of traceability would be lost for good in cryptic paper logs, email threads, and evasive verbal updates. But thanks to big data analytics in the construction industry, field updates, labor logs, cost codes, and other subcontractor-generated data are synced automatically in one central platform. This allows construction firms to proactively monitor KPIs and easily spot if the electrical subcontractor underperforms on daily productivity goals.
Sustainability and waste reduction: “Where are we generating avoidable waste?”

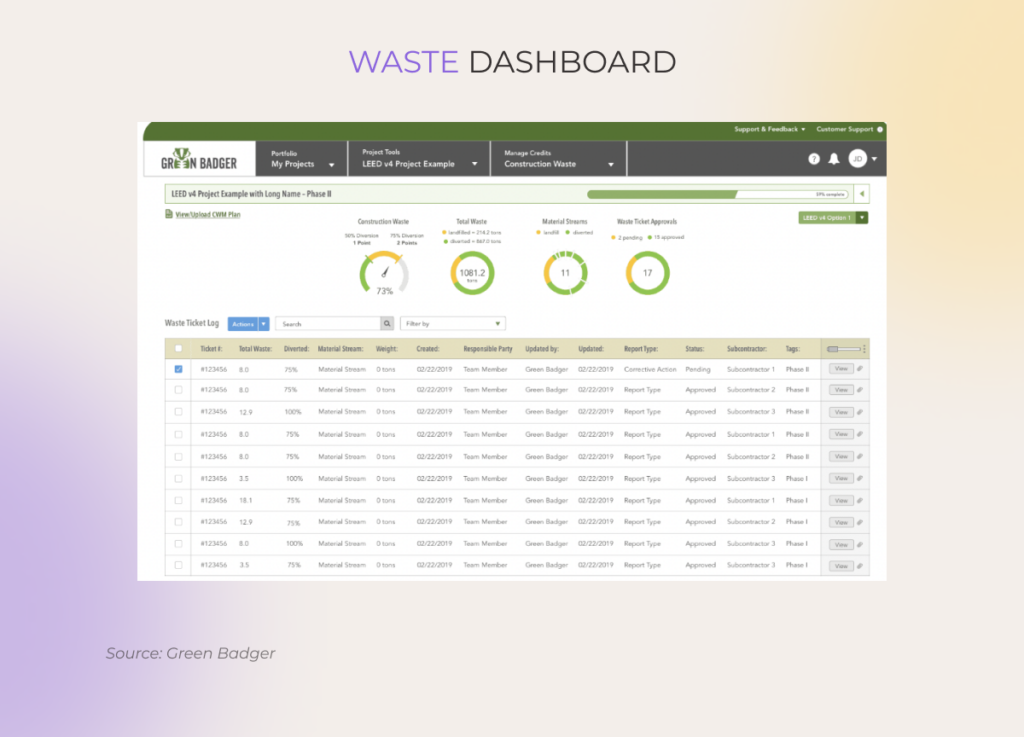
On the path to their green objectives, E&A companies resort to construction waste management tools that capture ESG data from LEED-certified projects, including metrics on carbon, water, energy, and material usage. The data is centralized and communicated through intuitive dashboards that zoom in and out on waste indicators, recycling rates, and M/WBE metrics.

Combined with predictive alerts, ESG analytics tools also warn teams when waste thresholds are approaching and how they can optimize their procurement strategies to reduce excess. Project-level insights roll up into corporate ESG reports, LEED documentation, and other sustainability compliance programs.

A clear 4-step roadmap to successful construction analytics implementation 

If your construction company is at the very dawn of adopting digital analytics tools, you need a solid foundation, similar to that of any well-built structure on construction sites.

1. Assess your data infrastructure 

Break the ground by estimating the quality and availability of your existing data sources, even if you don’t have formal systems like construction planning systems and risk management tools. This will help you and your data analytics partner lay the ground for a tailored roadmap, including tech stack selection, data integration strategy, and more.

2. Kick the tires by starting with small-scale, high-value use cases

Start with focused, easily measurable pilot projects that would deliver quick gains and easily scale into bigger initiatives. Examples include projects like construction planning solutions, predictive maintenance for select machinery, material inventory management, and crew scheduling optimization.

3. Integrate construction-specific systems within a unified data hub

Connect BIM, ERP, IoT sensors, and other data-generating construction technology into a centralized platform. Through API-driven integrations and real-time data pipelines, this unified data hub will enable precise analysis of construction data at the organizational and project levels.

4. Employ advanced technologies for precise analysis

Machine learning, natural language processing, computer vision, and generative AI add new dimensions to data analysis by extracting insights from different data modalities. Whether it’s structured sensor data, unstructured text from reports, or camera feeds, these technologies can reveal insights that traditional analytics methods overlook.

5. Focus on data governance and security

Make sure to establish defined data governance protocols to ensure data accuracy, consistency, and compliance across construction data sources like BIM, ERP, and others. Use industry frameworks such as ISO 19650 as a reference point and supplement your strategy with solid data security measures such as RBAC, end-to-end encryption, and other fit-for-purpose safeguards.

Put your construction data to work

Data analytics in construction has taken on a strategic, compound mission of driving performance, clarifying complex insight narratives, and giving E&A companies a decisive edge. But to pull its weight, data analytics tools demand clean, connected, and contextualized data, paired with the right tech stack and a clear roadmap. 

Partner with our ISO-certified, AI-driven software engineering company to transform your raw construction data into real-time insights that keep your projects on schedule and under budget.

Construct your data-driven edge with *instinctools’ big data and AI expertise

Schedule a call

Logistics Analytics: How to Achieve Smarter Supply Chains in 2025

Key highlights

  • In 2025, advanced logistics analytics is picking up speed with AI at the helm. Companies like Amazon and DHL are automating insights, slashing delays, and adapting on the fly.
  • From predictive ETA and smart warehouse slotting to lane-level forecasting and automated returns, logistics analytics is solving T&L’s biggest challenges with measurable ROI.
  • Fragmented systems, legacy tech, and talent gaps can block your progress with analytics adoption.

People in the logistics industry know better than anyone how even small disruptions like a road closure on a secondary route can ripple through the entire supply chain, leading to empty shelves and failed SLAs. That’s why data analytics in logistics is mission-critical — it helps anticipate such issues before they wreak havoc.

In 2025, logistics analytics has become smarter than it’s ever been. With advanced AI in tow, it enables companies to create supply chains that think and match the market’s dynamics autonomously. But these smarts come with unique complexities.

What is logistics analytics?

Logistics data analytics allows companies to collect, analyze, and interpret data to gain the intelligence necessary to optimize costs, improve efficiency, and inform decision-making across all operations.

Historically, logistics data analysis came in four flavors, including descriptive, diagnostic, predictive, and prescriptive analytics. These days, however, such classification has gone out of style, as current logistics heavyweights run on analytics solutions that blend multiple approaches.

For example, AWS Supply Chain suite doesn’t separate between the types and offers an integrated AI analytics platform with real-time dashboards for tracking package movements, warehouse inventory, etc., demand forecasting models, dynamic warehouse picking schedules and delivery route optimization, and other tools. 

Why ignoring advanced data analytics in logistics is a fast track to failure 

By 2032, the global supply chain analytics market is expected to surpass $32 billion — almost a threefold surge from $11.08 billion in 2025. It’s easy to see why things are taking off that fast. Advanced analytics has become a GPS for T&L companies, and without it, they’re flying blind.

Manual data analysis brings critical operations to a grinding halt

If a supply chain and logistics team relies on a patchwork of spreadsheets, documents, and Industry 3.0 systems, they are doomed to a lifetime of manual errors and delays. Customer service reps can waste hours reconciling critical data only to send an irrelevant response to the wrong customer. Perishable cargo goes to waste because temperature logs are buried in someone’s inbox.

Due to the lack of insight into thousands of nodes, teams also spend the majority of their time firefighting. Inventory updates get recorded days after demand shifts, reactive spot-market purchases trigger markups — every hour of reactive management is multi-million, self-inflicted damage.

No real-time visibility, no effective risk management

Without advanced transportation logistics analytics, companies have no ears and eyes to spot or predict a delay before it turns into a costly escalation. This lack of foresight also means acting based on historical data or, in the worst-case scenario, uncovering the problem well after customers complain. 

One of our global manufacturing clients experienced it for themselves. Their legacy solution frequently failed to detect delays early enough, meaning issues were often uncovered too late in the delivery process (sometimes by their own customers) leaving little time to respond or re-route. The new system allows their teams to monitor shipments as they happen and inform customers before issues escalate. As a result, the fallout from late deliveries has been significantly reduced, while customer satisfaction — preserved, even in the face of unexpected disruptions.

Market twists can’t be handled without timely data-backed insights 

Black swans throw a wrench into the way logistics companies operate. Without a data-driven heads-up, T&L businesses are caught up in rapid and sometimes extreme swings in supply and demand alongside limited transportation resources. 

For instance, during the pandemic, one of our clients experienced a stark 7x increase in freight lead times. A solution that forecasts port closures and capacity shortages in real-time could’ve staved off this scenario, so the company made a strategic decision to build one with our team to anticipate and mitigate similar incidents in the future.

Transportation and logistics analytics help companies cushion the blow of such systemic shocks. By unifying historical and real-time data across multiple sources, analytics tools uncover risks in their tracks, allow companies to simulate multiple scenarios, and help businesses regroup way ahead of the market.

The path towards a net-zero supply chain is data-driven

Holding a logistics company to its GHG commitment, emission standards regulations, and customer demand for greener shipping requires a thorough understanding of Scope 3 emissions. But when businesses grapple with 10,000+ products and an army of suppliers, the low-carbon transition becomes a far-fetched goal unless there are advanced analytics tools in the mix.

Data analytics in logistics and supply chain management makes sure companies can track carbon emissions and identify GHG-friendly suppliers. Additionally, this visibility lets teams optimize delivery routes for fewer GHG output, avoid breakdowns before they become a high-emission catastrophe, and bake in GLEC, DEFRA, or EPA standards into every operation.

Don’t just move goods — move them smarter with our data analytics solutions

Contact us

12 use cases of logistics analytics in the T&L industry

From reducing transportation costs to improving inventory management and achieving the perfect last mile, here are twelve high-impact logistics analytics use cases transforming supply chain operations end to end.

1. Tariff scenario modeling

The current tariff environment is anything but predictable, so it ushers in a lot of volatility into landed costs. Tariff simulators and AI-driven modeling enable businesses to apply hypothetical tariff changes, quantify margin impacts, and understand the operational trade-offs early on. 

For example, companies can run Monte Carlo simulations to model the combined impact of potential tariffs on imported components and use decision tree analysis to determine an optimal response strategy in this case.

End-to-end pipeline for global tariff data analysis

2. Predictive ETA estimation and AI-based network re-routing to minimize delays and empty miles

Like the rest of the industry, one of our clients often faced unexpected increases in fuel costs due to unforeseen delays and empty backhauls. To counter this challenge, many companies — our client included — resort to AI-based routing tools to optimize multi-stop and multimodal networks. 

More optimized networks lay the foundation for ETA precision, which is then enhanced with AI/ML models to take into account dynamic, real-time conditions like traffic or weather. This also solves the issues of empty backhauls: for our client, network optimization led to a 64% reduction in empty miles and a 23% trimming in drivers’ mileage.

3. Lane-level demand forecasting and capacity allocation for freight efficiency

Around 43% of truckloads are going about partially empty. The origins of this deadweight are often traced back to an imbalance between supply and demand across lanes. Logistics analysis tools give companies data driven insights into the freight demand at the lane level and help predict how it’ll flex based on seasonality or market shifts.

Lane-level demand forecasting and capacity allocation for freight efficiency

With this granularity of insight, companies can dispatch the right number of trucks and trailers per lane and reduce the number of deadhead miles. Moreover, advanced technologies, like mixed deep learning models, can predict lane speeds with surgical accuracy by capturing spatiotemporal traffic patterns. This allows CAV networks to make lane-selection decisions in real time.

4. Continuous AI-driven warehouse slotting for high-throughput order fulfillment

When it comes to high-volume fulfillment, one-time slotting is not enough, so companies resort to AI and analytics to dynamically arrange storage units. Working in tandem with IoT, smart slotting optimization tools feed on real-time order data, SKU velocity, and storage limitations to strategically house items where they’re needed most.

This living layout can update hourly, allowing warehouses to reshuffle inventory closer to the picker location. For example, Walmart’s AI-driven fulfillment system organizes inventory by department and groups palletized loads, allowing the ecommerce giant to get products onto shelves at its more than 4,700 stores faster.

5. Automated order grouping and route planning to minimize travel time

Almost two-thirds of global shoppers want their orders delivered within 24 hours. However, delivering that fast requires getting all ducks in a row, including smart order bundling and perfectly timed route planning. 

Analytics-driven agentic systems can take on this challenge by automatically grouping orders according to delivery locations, windows, and vehicle capacities. They can also constantly fine-tune routes based on real-time traffic, weather, and order-priority data, so that the order ends up in the right location and within the requested time window.

6. Machine learning-based demand forecasting and multi-echelon inventory optimization

Accurate demand forecasting is a non-negotiable for lean supply chains and a heavy lift for companies with traditional tools. By analyzing historical sales data, seasonal trends, market shifts, and other variables, advanced analytics tools can predict future demand at a product, location, or time-period level.

Some ecommerce titans, like Amazon, for example, take it up a notch and pair demand forecasting with multi-echelon inventory optimization. This way, companies can optimize inventory levels across multiple tiers and set buffer stocks across their layered fulfillment networks. 

7. Workforce and robotic system planning aligned to predicted inbound and outbound volumes

When there’s an upcoming Black Friday sale, Cyber Monday, or a generally high-demand season, logistics operations highly depend on operational efficiency, specifically, effective workforce and robotic system planning. Data input, like historical order volumes and upcoming promotions, enables analytics solutions to predict inbound and outbound flows to help companies handle the spike.

Based on the actionable insights, a warehouse can ramp up robot deployment during a sales night, fit in extra night shifts for holiday rushes, or set conveyor belts at 50% speed during low-demand periods.

8. Real-time equipment health monitoring and predictive maintenance 

Changing tires too late or letting overheated conveyor components go unnoticed can easily equate to people getting hurt and shipments getting delayed. Together with IoT sensors, predictive maintenance constantly keeps tabs on forklifts, tires, and other equipment and creates real-time health scores.

Based on the score, the system can predict failures up to 72 hours in advance and self-schedule maintenance workshops to fix the issue.

That’s exactly how our client, a European cold-chain logistics provider, avoided $850,000 in potential downtime. Our predictive maintenance system scheduled a work order 68 hours before the conveyor’s score dropped to 62/100.

9. Dynamic traffic-aware last-mile routing based on real-time prioritization rules

As the most variable leg of the supply chain, last-mile delivery accounts for over 50% of total shipping costs. This variability can be chalked up to traffic, including urban congestion, road closures, accidents, and other circumstances.

Analytics-powered systems leverage real-time data, such as GPS feeds, traffic congestion levels, and road restrictions, to dynamically reroute delivery vehicles. FedEx’s Global Delivery Prediction Platform also factors in street-level geography, package-level data, and updates like delays and detours.

10. Unified multi-carrier visibility with predictive exception management

Shippers working with a bunch of carriers have to jump between tracking systems just to get a snapshot of their shipment whereabouts. Unified data platforms bring data feeds from all carriers under one roof, so that shippers can access the entirety of shipment data from a single dashboard.

For one of our clients, we’ve also combined multi-carrier visibility with smart allocation rules, enabling the system to self-assign shipments to the optimal carrier based on destination, cost, service level, and historical reliability. Layered with predictive exception management, this platform also flags shipments at risk of delays and missed SLAs.

Carrier API Dashboard

11. Geozone-specific delivery capacity planning and dynamic driver allocation

Area-based delivery planning is one of the most high-value and often underrated transportation analytics use cases. These solutions break down delivery areas into smaller zones and then predict the order volume for each zone depending on the time or certain products.

Logistics analytics makes sure that companies don’t over- or underallocate drivers and vehicles in any given zone. With real-time analytics integration, companies can also assign gig drivers from crowdsourcing platforms to pick up the slack of immediate delivery needs.  

12. Return logistics optimization through pattern analysis and route scheduling

Many T&L businesses work in reverse, with an average manufacturer spending around 9% to 15% of total revenue on return logistics, according to UPS. Logistics analytics helps cut those costs by giving detailed breakdowns of returns by product types, customer segments, regions, or seasons. 

Say, a certain SKU consistently gets returned in a specific metropolitan area. Seeing that, the system can suggest pick-up route tweaks so that returns from the same areas or of similar product types are lumped together. Some systems also allow customers to self-schedule in-home returns within pre-set geozones to make returns more convenient for both sides. 

Build logistics intelligence that sees around corners

Contact our team

Well intentions that won’t pay off: what blocks logistics companies from leveraging advanced analytics

Although many logistics companies are eager to tap into advanced analytics, they often see their projects hit structural and operational roadblocks that can’t be overcome by enthusiasm or investment alone.

Logistics data remains trapped in isolated, disconnected systems

78% of supply-chain executives say their companies still run a hodgepodge of systems for inventory, ordering, logistics, and planning. It means that the ERP, TMS, WMS, and partner data are locked behind standalone software, creating a fragmented view that stonewalls advanced analytics. 

The solution to that fragmentation lies in data consolidation — creating data warehouses that house unified data and setting up API integrations for seamless data flows between systems.

Legacy systems can’t support modern analytics demands

Outdated systems run on stale data formats, rigid architectures, and batch-focused workflows. They can’t handle sensor data, they lack role-based access control, and they don’t have cloud-native compatibility by default. In simple words, they aren’t built for that sub-second intelligence advanced analytics is aiming for.

Unless modernized with APIs, middleware, edge gateways, or overhauled completely, legacy systems can never cover the needs of competitive analytics solutions.

Logistics teams lack internal data science expertise

According to a global research study, the lack of internal expertise is the third most cited barrier to technology implementation. Logistics data analytics is no exception — no amount of analytics can fix bad inputs and T&L companies need data scientists to prep those inputs for AI models. 

As on-site data science talent is often too expensive or limited to secure, many logistics companies turn to third-party data analytics partners to bridge the talent gap.

How *instinctools can help with adopting logistics analytics

Marrying logistics and analytics is not just about tools. To make analytics work for your T&L business, you need a solid data foundation and analysts who speak both data and supply chains. As a data analytics partner of 25+ years, *instinctools brings in tech experts who understand both and can take over the end-to-end process:

  • Data preparation — performing automated cleansing, normalization, and feature engineering to make sure your logistics data is high-quality.
  • Data integration/consolidation — setting up ETL pipelines that bring disparate data sources onto a centralized control tower.
  • ML algorithms implementation and fine-tuning — developing or customizing machine learning models for predictive analytics. 
  • Visualization — building interactive, straightforward dashboards for real-time monitoring and insight exploration based on BI tools.

With ISO-certified processes in place, we also make sure that your data infrastructure is based on watertight data governance frameworks to promote the quality, consistency, and compliance of your logistics solution. 

Summary

Rising customer expectations and perennial supply chain disruptions have put an unprecedented strain on transportation and logistics companies. Advanced analytical techniques help T&L businesses stand up to those challenges with demand forecasting, route optimization, dynamic last-mile routing, and predictive maintenance.

But smarter analytics starts with smarter data. And that’s where most T&L companies get stuck. Siloed data sources, legacy tech, and the shortage of internal tech talent make advanced analytics near-impossible to implement. If you too are experiencing similar roadblocks or generally need an advanced analytics tool for your T&L company, *instinctools is ready to help.

Turn your operations into a competitive advantage with logistics analytics

Reach out

Focus On Results Not Process: Augmented Analytics Guide

Key highlights

  • Augmented analytics takes business intelligence to the next level by automating data analysis and generating insights.
  • AI-powered analytics solutions transform how organizations interact with data, making insights accessible, intuitive, and action-oriented.
  • To fully leverage augmented analytics, businesses must ensure data quality, implement strong governance, and build an AI-ready culture.

Data is now like air. It’s all around us. Every manager, front-line employee, and business user needs to be able to breathe it in, break down its composition, and leverage it to inform their decision making. Most importantly, they need to do it fast and organically to capitalize on fleeting opportunities.

Augmented analytics makes it easier for data scientists to nail transformational discoveries — while also accelerating decision intelligence for everyone, without a data background. With 50% of business decisions predicted to be augmented or automated by AI agents by 2027, the early adopters stand to reap the biggest rewards.

What is augmented analytics and why is it a step above traditional analytics?

Augmented analytics is the type of advanced data analytics that builds on artificial intelligence and machine learning to democratize business insights, take on busywork from data science teams, and provide tailored suggestions to users based on their roles, preferences, and past behaviors. Augmented analytics also automatically generates such complex capabilities as forecasting and model building.

Unlike conventional analytics, augmented analytics tools don’t just follow instructions. They go out of their way to anticipate your needs based on the contextual and behavioral cues pulled over time and offer you the insights you never knew you needed. This transformative approach to business intelligence stems from the following enabling technologies:

  • Machine learning — as the core engine for augmented analytics, machine learning sets the overall framework for intelligent automation, allowing such tools to autonomously level up based on new structured and unstructured data. Machine learning is also where advanced analytics functions like predictive analytics come from.
  • Conversational AI — the combination of natural language processing (NLP) and natural language generation (NLG), enhanced by detailed prompt-engineering, enables analytics solutions to build on internal and external context (RAG), turn complex data into a clear, concise narrative digestible for anyone, and go out of their way to offer insights proactively.
  • Automation — the final piece of the puzzle that enables these solutions to handle routine tasks across the data analytics lifecycle, such as data preparation, cleaning, and integration.

Augmented analytics grows up: agentic analytics

Augmented analytics is an ever-evolving field that has lately collided with AI agents, programs capable of autonomously performing tasks on behalf of a user or another system. While augmented analytics is focused on enhancing human decision intelligence, agentic analytics tools aim to proactively identify problems, generate solutions, and even take action based on the insights — and do so with no or minimal human intervention.

Also, agentic analytics solutions can actively go out and tap external environments beyond their initial training set to handle complex, multi-step analytics tasks.

The comparison of four analytics systems: Spreadsheets, BI, augmented analytics, and agentic analytics with key traits

Automate your analytics like never before

Develop AI agents

Watch augmented analytics software in action

Your CRM system, accounting software, ERP platform, and other business software jot down real-time actions and changes. They are awash with data that could help you save money and boost profits. But that’s not happening because traditional analytics tools are a tough lift for everyone but its savvy users. AI augmented analytics fixes that.

Automating data management

To become insights, your data — that comes from a variety of sources — needs to be consistently formatted and cleaned. But if it comes in wildly different forms and shapes, your data analytics team will spend days scrambling to understand the structure before they can get down to analysis.

One of the biggest benefits of augmented analytics is that it introduces automations throughout the entire data management lifecycle:

  • Collecting data from multiple, sometimes complex sources, automatically identifying different data types and relevant attributes within datasets, including outliers. 
  • Cleaning and preparing the data (filling in missing values, identifying outliers, removing duplicate records, etc.).
  • Indexing and clustering data (semantic indexing, patterns/trends/segments identification).
  • Revealing hidden connections in datasets, generating hypotheses from these connections, and automatically building predictive models.

Democratizing access to data

When strategizing their efforts, every company grapples with three core questions: What happened? Why? What’s next? Classical analytics with its learning curve makes finding those answers, let alone easily accessible ones, a challenge. Not every person on your team can boast the knowledge of statistical or analytical methods — or SQL commands.

Augmented data analytics allows users to ask questions in plain English instead of writing a complex query. The NLP engine inside acts as a translator and intermediary, making data insights more intuitive, approachable, and accessible to everyone. In simple words, the interaction boils down to the user asking the tool, “What were our sales in Q3?” and the system breaking down the stats in response.

Data analysis dashboards with a revenue chart and an 'Analyze' option selected, highlighting 'Pattern recognition'

Giving recommendations to users

Another reason why big data and augmented analytics tools are billed as the new era of insight generation is because they speak your industry semantics and can broadly track user behaviors. It means that over time, they sync with the user’s chain of thought and proactively suggest actionable insights, metrics, and insights that matter most to them and their work, curated into a custom digest.

Users might not ask explicitly, but augmented analytics solutions anticipate their needs and surface relevant information before they even ask. It’s less about asking the right question and more about the platform already knowing what you might need. 

Visualizing data

Augmented analysis systems don’t just explain the why behind certain trends. If married with multimodal systems, they can also visualize data on demand, choosing visualizations that best communicate the key insights. Not only that, but visualizations in this case can incorporate deeper insights across multiple modalities, such as images of popular products and snippets of customer reviews.

With augmented analytics, you can also endlessly get into the nitty-gritty details of your data with no pre-defined drill paths or data aggregation required.

Breaking down the what, why, and how with no effort

100% automated insights, 0% busywork — that’s likely the biggest benefit you can gain from augmented analytics. It redefines the way companies approach analytics, making the whole process hassle-free. Users can simply ask the system for insights and let it determine the best approach to dissect data. 

Whether it’s forecasting, goal seeking, scenario analysis, or any other data task, augmented analytics takes the heavy lifting from a human and returns insights in a ready-to-use form. And if the system comes across any complementary data, it’ll surface it, too.

What augmented analytics can do that BI cannot

Essentially, traditional BI tools empower users to analyze data, while augmented analytics tools empower users to understand it, with or without the necessary technical background. 

Augmented analytics platformsBusiness intelligence platforms
User proficiencyAccessible to business users with no coding or statistical knowledge neededRequires the involvement of technical experts (analysts, data scientists)
Data explorationEnables free-form data exploration with natural language processing and AI-powered guidanceRelies on pre-defined reports and dashboards
Insights generationAutomated discovery of insights, patterns, anomalies, and trendsManual, time-consuming process
Data preparationAutomated data preparation and cleansingExtensive data modeling and preparation required
Output formatStatic reports, charts, and dashboardsInteractive visualizations, narratives, and recommendations

Enhance your business intelligence for better results with our AI team

Book a call

The mechanics of augmented analytics tools 

The foundation of augmented analytics is a complex orchestra of interconnected components that parlay into a holistic system, uniting data, technology, and human understanding. It all begins with a robust data integration layer that connects a myriad of structured and unstructured data sources, including SQL/NoSQL databases, CRMs, ERPs, streaming data sources, IoT devices, external systems, and more. The system retrieves the relevant data points and transforms them into a consistent and usable format on its own.

Augmented analytics relies on AI and machine learning to automate data exploration, build predictive models, and generate deeper insights. Based on the insights and predictions, the system can recommend an optimal decision path — or even automate decisions based on the analysis if it’s operating within well-defined and repetitive scenarios.

Data flow diagram from sources to insights using augmented analytics, including ML, NLP, dashboards, and predictive analytics

Who can benefit from augmented analytics?

Regardless of the use case, augmented analytics capabilities do not aim to replace human judgment — they amplify it. In this case, the entire paradigm is being shifted: instead of dealing with the tedium of data collection, data analysis, and insight explanation, humans become strategic supervisors.

  • Business users like marketing teams can shorten the time-to-insight, improve their data literacy by tapping into insights previously locked behind technical expertise, and focus on taking action. For example, marketers can monitor social media sentiment along with website traffic to see how their campaign is faring.
  • Instead of requesting a report from other departments, executives can ask their augmented analytics platform about sales trends, conversion rates, and campaign performance.
  • Data analysts can leverage augmented analytics features to reduce the iteration loop in their data analysis activities, automating time-consuming tasks like data prep, model building, and report generation.

One of our clients, a wealth management firm, spent months exploring the reason behind quarterly customer churn. Our developers built a custom augmented analytics solution that allows the VP of wealth management to peer into the trends on their own and give the data analytics team more time to focus on higher-value initiatives like strategic recommendations. The time-to-insight reduced from months to days, and data preparation time decreased from weeks to minutes.

Augmented intelligence — augmented challenges?

Although augmented analytics ushers in a new era of accessible data insights, it brings in new challenges, too. Some of the challenges are conditional and purely mechanical, while others occur due to the technology’s ongoing evolution and refinement.

Maintaining data quality

The accuracy and strategic potential of your augmented analytics solution hinges on the accuracy and reliability of the underlying data. But the sheer scale and variety of such data requires a significant manual effort from companies to cleanse, tag, and enrich it.

Although the lion’s share of tagging and cleansing is automated, data teams still need to actively participate in the process — like developing tagging and cleansing strategies to deal with the subjective nature of data such as customer sentiment or product reviews. 

Privacy and bias concerns

As data analytics transitions from fact-finding to conversation, companies enter the grey zone of data ethics. More underlying data means more potential biases, higher risks of data inference and profiling, as well as expanded vulnerability surface.

Augmented analytics companies should take a multi-faceted approach to address the ethics risks that includes robust data governance frameworks, bias detection and mitigation strategies, and human-in-the-loop oversight. Adversarial conversational AI solutions can also improve the robustness of augmented analytics solutions against malicious attacks. 

Expensive conversion processes 

Although companies get an AI data-savvy assistant, this capability comes with a hefty subscription fee. Cloud infrastructure, increasing networking costs, and the dedicated effort required to enable augmented analytics capabilities, although not overweighing the ROI, calls for substantial money injections. So does the ongoing need for LLM recalibrating, model retraining, and system updates. 

Good news is that companies can at least bring down the cost of solution development and model retraining. For example, augmented analytics vendors can build off pre-trained models and leverage AutoML tools to reduce development time and costs. MLOps tools like AWS SageMaker, Azure Machine Learning, or Google Cloud AI Platform can automate the entire model retraining workflow.

Non-determinism of the model

Less of a challenge, more of a consideration, the non-determinism of an augmented analytics solution occurs when the same input leads to different results each time. It doesn’t inherently cause less accurate insights, but may jeopardize the credibility of the solution and difficulties in reproducibility. 

When non-determinism is not intentional, it could signal a bug or default in the system. In other cases, varying results crop up due to contextual changes, real-time updates, or stochastic algorithms at the solution’s core.

New roles and capabilities

Sometimes, augmented analytics projects go off track simply because companies fail to build up their own capabilities or repurpose necessary skills. Whether it’s a lack of AI and machine learning capabilities, solid data infrastructure, or even the meager organizational capacity, the result is often the same: companies abandon the initiative without unlocking “alpha”.

Solutions with this level of promise require companies both to supplement existing AI and data roles with skills like DataOps, vector database development, and others — and acquire new talents such as AI ethics stewards, prompt engineers, or unstructured data specialists. 

New and expanded data roles for generative AI, including AI ethics stewards, prompt engineers, and unstructured-data specialists

Build augmented analytics solutions with ease and speed

Contact our team

How to put your best foot forward with augmented analytics

Whether you’re in for quick wins or want to lay a foundation for broader-scale transformation, augmented analytics necessitates a strategic roadmap.

Customizing models

To make sure you can bet your bottom dollar on your augmented solution, you need to train the underlying LLM or SLM on your data grounds and fine-tune it through prompt engineering. Keep in mind that however advanced, this analytics type is only as good as the data it’s fed. Ensure the foundational data is clean, consistent, accurate, and reflects the up-to-date business context.

Establishing data governance and compliance strategies

Augmented analytics tools can benefit any industry, even compliance-heavy ones like finance and healthcare, provided data governance considerations have been properly addressed. Role-based access control, comprehensive data security strategy, metadata management, and a clear data lineage framework are crucial for building trust in the insights generated.

Since many regulations push for transparency in AI systems, organizations also need to set up XAI techniques to make the model’s decision-making process more understandable and traceable.

Explainability in AI helps technologists improve systems, business professionals trust AI outputs, and legal teams ensure compliance

Treating augmented analytics as an engineering discipline 

If you value long-term success, treat augmented analytics as an engineering discipline, not just a business project with defined budgets and timelines. Focus on a robust and easily scalable foundation with modular components that can be reused for other use cases and support the multitude of business needs over the long term.

Embracing a culture of continuous improvement will enable your team to enhance the solution over time and easily calibrate it to your evolving business needs.

Promoting AI-enabled, but data-literate culture

Although augmented analytics bestows users with unmatched self service capabilities, the final decision is on humans. Keeping the potential non-determinism of the augmented analytics technology in mind, it’s important to instill a data-literate culture where your teams can challenge AI insights instead of just going with them. 

This level of discernment can only stem from an AI-ready organizational culture, supportive of change management — including training and upskilling, stakeholder engagement, and augmented analytics advocacy team to navigate the human side of the innovation. 

AI is the new BI

Regardless of economic headwinds, companies that can swiftly translate data into insights will not just survive, they will tower above others. This makes augmented analytics technology by far one of the most salient capabilities for high performers. 

Despite its imminent benefits, augmented analytics is more than just flipping a switch. The technology itself is only part of the equation. The real challenge lies in beefing up the necessary technical skills and updating the organizational AI governance roadmap. 

Not sure where to start with augmented analytics?

Talk to our AI team

FAQ

What is augmented data analysis?

Augmented data analysis is the type of analytics enhanced by AI and ML technologies to automate various aspects of the analytical process. These technologies make augmented analytics work better than any other type of analytics, enabling more valuable insights, faster data preparation, better data discovery, and automated predictive insights.

What is an example of augmented analytics?

Examples of augmented analytics include automated demand forecasting based on the user’s natural language queries, such as “Predict the demand for our flagship offering next quarter, based on the upcoming marketing campaign”. Other augmented analytics examples include smart data profiling, automated data integration, automated data discovery, and more.

Going From Chaos to Clarity With Demand Forecasting In Ecommerce

Key highlights

  • Accurate demand forecasting enables companies to meet customer demand without facing budgeting, supply chain, and other issues.
  • Proper demand forecasting relies on different demand forecasting methods and predicts future sales based on past sales data, customer demand patterns, overall market trends, and external factors.
  • ML-based systems for ecommerce demand planning predict consumer behavior with greater accuracy, helping you boost customer satisfaction.

The way ecommerce used to work isn’t working anymore. Traditional supply chain planning technologies and processes fail to adjust to global and local black swan events. In 10 out of 10 cases, outdated forecasts backfire, setting ecommerce businesses up for lost sales, excess inventory levels, and dissatisfied customers.
How growth-oriented online retailers can become reality-ready? Our guide has all the answers you need.

What is demand forecasting in ecommerce?

Demand forecasting in ecommerce is an adaptive process that uses historical and real-time demand data to identify patterns in consumer behavior and predict future trends. It helps businesses stabilize sales, optimize inventory management, allocate resources effectively, and ensure high customer satisfaction even under the influence of economic downturns and other external factors.

How accurate demand forecasting can save the day for your ecom operations

Ecommerce forecasting tools cannot predict future demand with surgical precision, but that’s not what they’re designed for. By combining historical sales data with market trends, product information, and other insights, ecommerce demand forecasting provides the intelligence needed for business owners to decrease unnecessary expenses, regardless of the variables.

Optimizing inventory supply levels

Ideally, ecommerce businesses should have an agile supply chain and a balanced amount of raw materials or manufactured products on hand — enough to satisfy demand without increasing inventory and warehousing costs. In reality, 70% to 80% of retailers’ cash is tied up in inventory.

Accurate ecommerce inventory forecasting provides full visibility. Merchants can see into their inventory data and demand fluctuations and act on them to cut costs without sacrificing customer satisfaction:

  • Get a heads-up about peak periods
  • Prevent overstocking on slow-moving items
  • Reduce stockouts
  • Maintain safety stock levels

Whenever you’re dabbling into new products, forecasting tools can analyze historical sales data on similar products and offer granular replenishment recommendations.

Budgeting and ecommerce financial forecasting

Demand forecasting solutions build on historical data and consumer preferences to predict future sales and expected revenue. Along with incoming cash flows, business owners can leverage demand data to size up upcoming expenses associated with fulfillment and procurement — and, say, decrease their overhead spending by negotiating discounts with suppliers. 

Ecommerce sales forecasting tools also outline periods of high demand and times of cash flow blues, allowing ecommerce businesses to optimize expenses and pricing strategies.

Advertising and marketing optimization

Merchants can combine demand planning with market research to identify the right target audience and focus marketing efforts on the most-likely-to-purchase customers. Demand forecasting tools for peak periods and slowdowns also enable companies to optimize their marketing strategies and budgets and align campaign timing with commerce demand upticks.

Take your demand forecasting for ecommerce to the next level

Contact our team

What ecommerce forecasting challenges can you face?

Shifting customer behavior, market volatility, supply chain disruptions, and data hiccups can all cloud the judgment of your forecasting efforts. Let’s look into the most significant obstacles that influence demand forecasting accuracy.

Inaccurate or incomplete data

Accurately predicting customer demand is only possible when hinged on comprehensive data input, including previous sales data, market trends, consumer surveys, and any other indicators at your disposal. Limited data scope that ignores purchase history, demand patterns, broader economic indicators, and other drivers can lead to unreliable insights.

Data management issues

The more data is scattered across teams and systems, the harder it is to produce reliable predictions. Inconsistent data management practices, mergers, and data latency can also hinder the forecasting process, causing discrepancies.

Biases in data collection

Biased data selection along with confirmation bias can jeopardize the outcome. For example, sales data tends to be overly optimistic at most times as salespeople, eager to hit quotas, often report idealistic predictions, skewing the forecasts towards a higher number. 

On the same note, customer input is often skewed, as people with average experiences rarely give feedback, while extreme cases speak up more. 

Inadequate historical records

Accurate predictions depend on consistent historical data compatible with forecasting technology. Few ecommerce businesses can brag about it. 

Most companies just throw their historical data to the back shelf, with no intention of analyzing it afterward or keeping it in check for later. As a result, poorly maintained data complicates reliable predictions, leaving businesses with a modest basis for forecasting.

Rapid strategic changes

Frequent strategy pivots make it challenging to forecast and meet customer demand as forecasting tools struggle to align consumer needs with company actions. In simple words, every time a business calls an audible, they render their historical data ineffective, which can result in meaningless predictions.

Stop guessing, start predicting — with demand forecasting for ecommerce

Let’s discuss

Which demand forecasting method should you choose?

All demand forecasting methods fall into two groups based on the nature of data: qualitative and quantitative. Each category has its strengths and applications — it all comes down to a particular context and available data.

Qualitative methods

Whenever there’s a lack of historical data to build on, companies turn to qualitative forecasting methods that leverage judgment from experts along with market research and other non-numerical data. 

Qualitative methods also fit the bill when a company is entering new markets or debuting products. Examples of qualitative forecasting include: 

  • Scenario planning
  • Delphi method
  • Customer surveys

Quantitative methods

Quantitative methods rely on historical data and statistical techniques to generate long-term forecasts. Hailed as the most precise forecasting approach, these methods are contingent upon the availability of historical data. 

  • Time series analysis
  • Regression analysis
  • Causal analysis

Companies usually employ a combination of quantitative and qualitative approaches to factor in subjective or unpredictable aspects and forecast demand with greater accuracy.

What ecommerce demand forecasting techniques fit your needs?

Depending on their technological maturity and availability of external and internal data, ecommerce companies can lean into one of the three demand forecasting methods stated below — or combine them for better results.

Spreadsheets

Small businesses with limited data and simple forecasting needs usually use spreadsheets like Microsoft Excel and Google Sheets for basic statistical analysis and back-of-the-envelope demand forecasts. 

However, they are time-intensive and error-prone due to manual data entry, provide limited scalability, and narrow down your analytical capabilities.

Based on our tests, Excel can easily manage around 200-300 thousand rows without breaking a sweat, and a single sheet can handle just over a million rows. But, if you want to go beyond that, you’ll need to juggle data across multiple sheets, which is a real hassle and takes up a lot of time.

BI-enabled forecasting

Business intelligence tools take ecommerce demand forecasting a step further by providing automated data collection and processing, advanced data visualization, historical data analysis, and reporting capabilities, all while minimizing the need for human intervention. 

BI solutions, such as Tableau, Power BI, or QlikView, seamlessly combine internal insights into sales, customer behavior, and inventory with third-party data like ecommerce benchmarks, market trends, and other sources. The software grants better visibility into crucial business performance and transforms complex datasets into straightforward charts, tailored to their specific KPIs. 

Power BI is a powerhouse when dealing with large datasets. It smoothly processes up to 50-100 million rows – that’s a whopping 100-200 times more than what Excel can handle! So, if you’re working with massive amounts of data, Power BI is definitely the way to go for efficiency and convenience.

However, business intelligence tools have a significant downside. Their decisions are rooted in historical data and cannot account for unpredictable events or trends. Also, BI tools are designed for structured data and ill-disposed to unstructured insights such as social media posts, images, and videos — which can lead to one-sided predictions.

The architecture of platform-based BI
The architecture of open-source BI

ML-enabled forecasting

An ML-enabled demand forecasting important distinction is its ability to go beyond traditional methods that rely solely on historical or statistical data. Instead, it leverages sophisticated analytics models to combine past and real-time data (both structured and unstructured) and predict demand more precisely.

Types of data for analysis: internal, external, structured, unstructured

Thanks to its continuous learning capabilities and broader data scope, ML forecasting excels where other methods struggle. For example, unlike conventional methods, machine learning can predict demand for brand-new products by analyzing sales performance data on similar products.

Whenever new data becomes available, the ML model fine-tunes its approach to align predictions with evolving insights. These tools can also streamline the data management workflow by automating the data preparation efforts of analytics teams.

ML-based Demand Forecasting on AWS

ML-powered forecasting requires commitment though, as companies need significant upfront investment to get started on the ML technology and establish in-house expertise. This type of forecasting is also associated with complexities in implementation and maintenance — but not if you join your efforts with a dedicated ecommerce development company.

Let’s take a look at a comparison chart that outlines the main differences between the spreadsheets, BI tools, and ML-driven demand forecasting.

Forecasting methodSpreadsheetsBusiness intelligence toolsML-enabled forecasting
AccuracyLow (limited to basic forecasting models)Medium
(improved accuracy due to larger historical dataset analysis)
High (sophisticated analysis algorithms)
Data sourcesMost often only internalStructured internal historical data and third-party dataStructured and unstructured internal and third-party data
Amount of data handledSmall datasetsLargeLarge
AutomationNoneHighHigh
Maintenance complexityLowMediumHigh
Technology requirementsLowMediumHigh
Technical expertiseMinimal tech knowledge requiredRequires basic data analytics skillsRequires extensive  data science expertise 
Use casesBasic demand planning for small businesses, initial estimates, quick calculationsSales forecasting, inventory planning, budget planning, trend analysisComplex demand planning, new product forecasting, personalization, risk mitigation, prescriptive analytics

Gain full visibility into supply and demand

Talk to our expert

How to do advanced demand forecasting? 5 crucial steps

If you need to solve the forecasting problem with something more robust than spreadsheets, here’s your roadmap to setting up a smart data-based forecasting process.

Step 1: How to collect and aggregate data?

An efficient forecasting method is contingent upon a wide selection of relevant and accurate data points. Here’s what data you need to lay the groundwork for a successful prediction model:

  • Transaction sales data, including SKUs, location, unit sold, and other information.
  • Metadata of an item, including its color, size, and more.
  • Price data with timestamps.
  • Promotional impact with detailed data on past promotions
  • Inventory availability, including in-stock or out-of-stock for each SKU at specific time intervals.
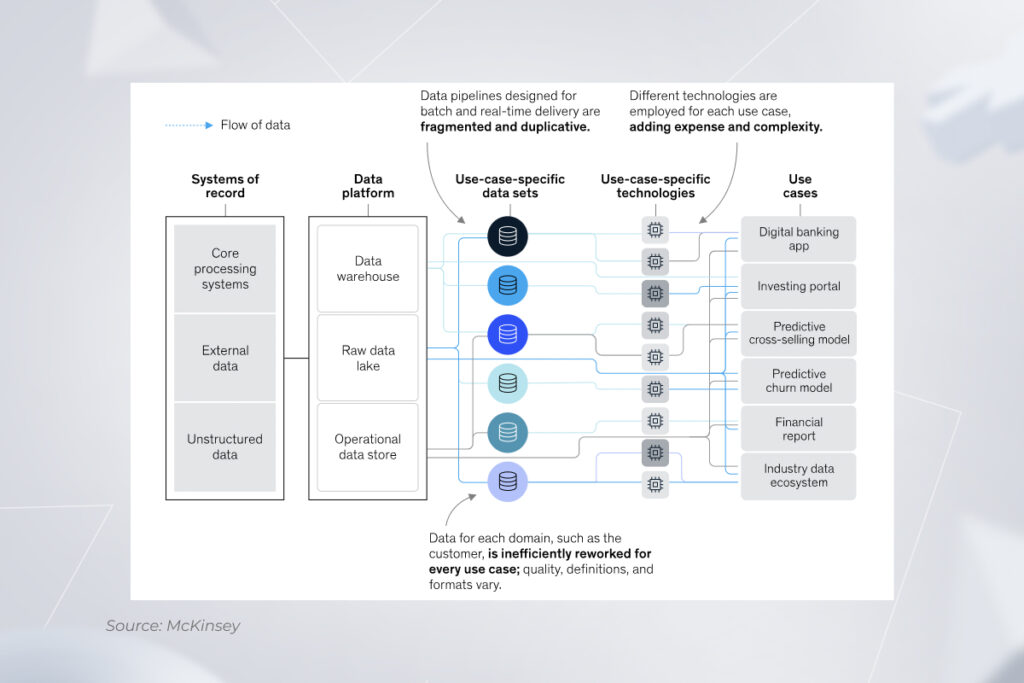
  • Location data.

Most forecasting models also call for website traffic data, search term insights, social media data, and weather information to supercharge prediction veracity.

Step 2: How to get your data in order?

Defects in the input like missing values, duplicates, etc. take a toll on the accuracy of an ecommerce data forecasting model, blocking its ability to spot patterns and trends over time.

Common tasks involved in data preparation include: 

  • Identifying and filling missing entries with standardized values.
  • Ensuring data consistency in units, dates, and data types across all datasets.
  • Weeding out outliers
  • Creating new variables to enhance the model’s prediction capabilities
  • Merging datasets to promote more nuanced predictions

Once the data is clean and ready, data science teams divide it into training and testing groups. 

Step 3: How to create a demand forecasting model?

Based on the complexity of your problem and the availability of historical data, a forecasting model can be powered by different techniques, such as ARIMA, regression, random forest, and others. The development team then uses the training data to teach the forecasting model to predict the necessary outcome. 

At this stage, developers also experiment with hyperparameters to mold the learning behavior of the model and maximize its performance.

Step 4: How to evaluate the model?

When the model is up and running, the team evaluates its performance by making predictions on the testing data, comparing the output to the actual values, and calculating the relevant accuracy metrics. The quality of a demand forecast usually hinges on two metrics: 

  • Forecast accuracy determines how a given forecast stacks up against actual sales.
  • Forecast bias describes whether the forecast is over or under the actual sales.

Keep in mind that it’s easier to achieve a high prediction accuracy for products with consistent historical sales and little seasonal fluctuations. The inherent volatility of trend-driven and weather-dependent products makes it harder to anticipate demand. So, in some cases, models can capture the general demand trends and potential shifts rather than outlining exact values.

After evaluating the results, developers spot areas for improvement and calibrate the model by adjusting hyperparameters, applying different techniques, or adding more data to the pipeline.

Step 5: How to generate and use forecasts for decision making?

When the model fits the predefined accuracy threshold, your team deploys it in the cloud and gears it up for forecast generation. Keep in mind that your forecasting model doesn’t operate on autopilot as it needs a constant stream of relevant data — both historical and current — to stay in shape. 

You can export forecasts to the analytic tool of your choice and leverage them for strategic ecommerce demand planning.

Instinctools’ expertise in setting up ML-driven ecommerce demand forecasting

A Canadian clothing manufacturer and online retailer was struggling with inventory management and stock levels planning. They wanted to switch from primitive Excel-based demand forecasting to advanced analytics. 

  • Instinctools replaced spreadsheets with an ML-powered demand forecasting system.
  • Our ML team trained the new system on the company’s data to ensure predicting future customer purchases with 90%+ accuracy. 
  • We also integrated the new forecasting solution with Power BI to make accurate forecasts accessible across departments.
  • The system elevated inventory forecasting: stockouts are reduced to 10% and overstocks stay below 5%.
an ecommerce company replaced Excel-based demand forecasting with an ML-powered system

Want more details?

Read the full case study

Summary

Ever-shifting times prompt companies to move from reactive to proactive ecommerce demand planning. A combination of quality data, machine intelligence, and visualization tools are spearheading the way of new-age demand prediction, helping ecommerce businesses translate forecasts into higher revenue and stay afloat even in the direst of times. 

Predict future trends with up to 99% accuracy for improved decision-making

Get a project estimate

FAQ

Why should I use demand forecasting?

Demand forecasting plays a crucial role in providing clear micro and macro views of your sales and inventory, enabling you to make informed decisions and plan both short and long-term with up to 99% accuracy.

How can I get started with ecommerce demand planning?

Collect historical data, such as sales, inventory, pricing, promotions, and logistics data, and get it in order. Internal and external data without duplicates, missing values, or other discrepancies is a good start for accurately predicting demand.

How can I tell if my demand forecasting is failing?

You can’t forecast demand with high accuracy if you rely only on historical data. While it serves as a valuable foundation, ignoring current influences that can significantly impact demand — like economic conditions, market shifts, consumer behavior changes, or unexpected supply chain disruptions — lead to inaccurate forecasts.

How to do ecommerce demand forecasting right?

The secret of accurate yet flexible demand forecasting lies in balancing:
– Historical and real-time data
– Qualitative and quantitative forecasting methods 

How can I improve demand forecasting with machine learning?

Traditional demand forecasting methods use only structured data, which accounts for 10% of total company data. ML forecasting can process unstructured data, such as social media posts and emails, images and videos, etc., unlocking the value of the rest 90%. The more data you use, the more accurate peek into the future customer demand you get.

Ace the Pricing Game with Intelligent Pricing Analytics

Pricing analytics has become an indispensable tool for businesses on a quest for profitability. 

Even customers root for the use of advanced analytics as a way to get fair pricing — and high-performing businesses don’t think twice about leveraging pricing analytics techniques to achieve that. But does your business need it? And if so, what is the right framework for adopting smart price optimization? Let’s find out.

From optional to table stakes: what makes pricing analytics important for companies?

Back in the day, effective pricing strategies used to be hard to nail. Companies would have to drill down into the spreadsheets, crunch numbers, and, hopefully, locate a few patterns to inform their pricing models. But with data-driven pricing intelligence, it has become a one-click exercise — and that’s not the only thing that makes pricing analytics important.
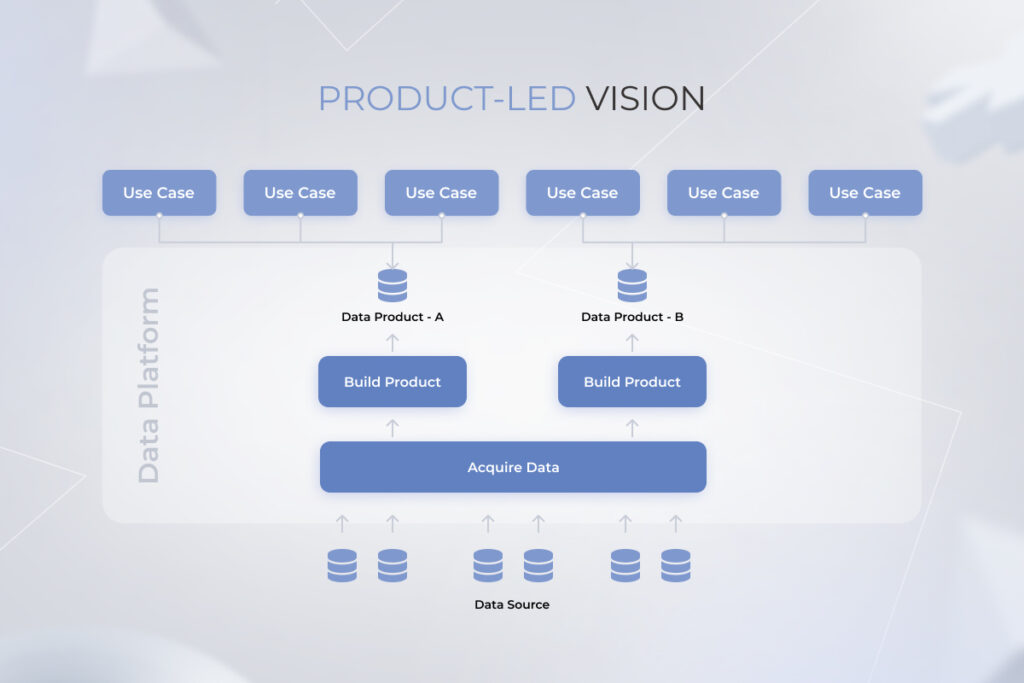
Improved profit margins

To capture greater margins, companies have to go into the nitty-gritty of price metrics and effectiveness to spot the slightest tendencies. Without pricing analytics models, businesses can only get to the bottom of Average Selling Price by category, Gross Margins by segment, and Gross Margins by customer. But those pricing metrics hide too much discrepancy to be actionable.
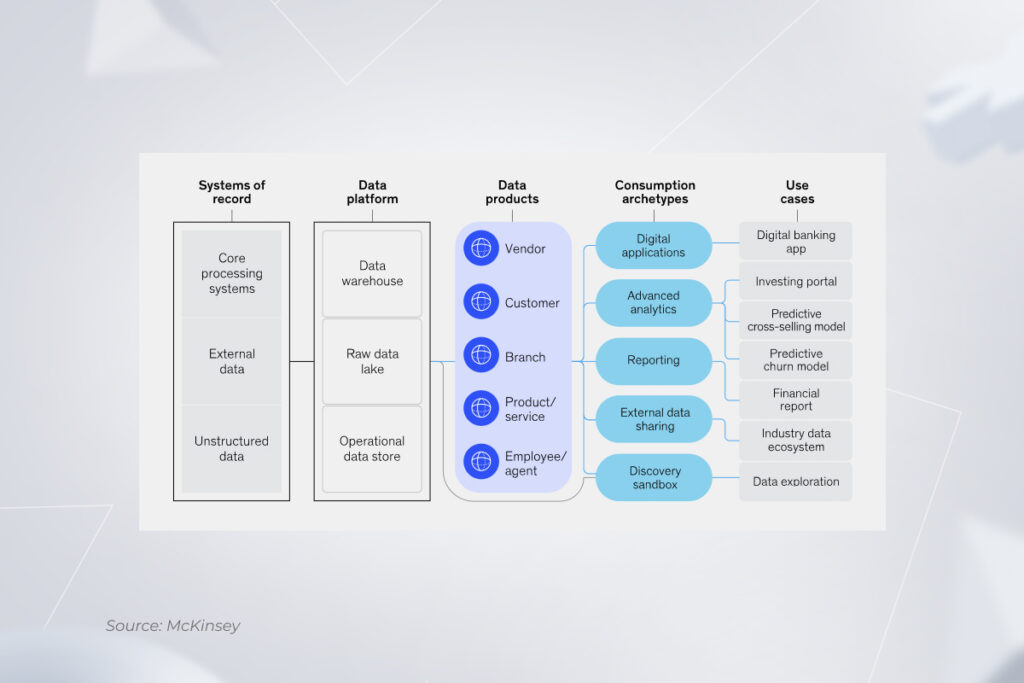
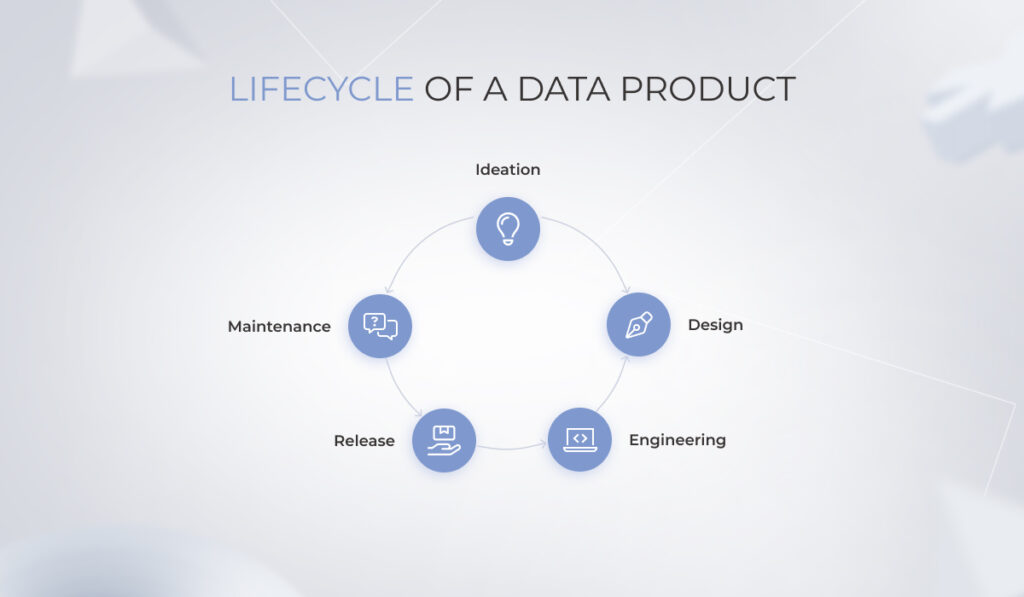
Conversely, pricing analytics tools can identify patterns in customer retention rates, loss metrics, and other pricing data at an item level to spot pricing opportunities and margin leakage. According to Accenture, product pricing analysis is able to increase margins by two percentage points.

Reduced pricing-planning times

Usually, it takes a lot of effort to get to grips with financials, especially if the company is in the growth stage. Hundreds of product names sold at different price points, a few pricing tiers, and complex product bundles make companies go with the “sounds about right” pricing strategy as an easier alternative to spending hours manually calculating the medium.

With their drill-down abilities, pricing analysis tools reduce manual effort spent on price optimization and wrap unified data into pricing analytics dashboards that could be then sliced and diced for different departments. Also, the heavy lifting of price planning can be fully automated through smart approval workflows.

Higher pricing performance

To hit it big, a business’s pricing strategy should be based on customer behavior and customer expectations of pricing. In other words, your products should be sold at specific price points that align with the value of your product as seen by a customer. And the shortcut to this value-based pricing is hard data.

By analyzing product pricing data and the impact of past pricing actions, brands can sell items at optimal prices that match customers’ purchasing power. Being in alignment with your customer base also leads to higher customer loyalty and lower customer acquisition costs.

Informed price-setting decisions

No customer is ready to pay extra for your products if other brands retail the same exact items at a lower price. By taking into account your customer, competitor, and company data, predictive pricing analytics software can calculate the price elasticity of demand for your product, making sure you understand all the factors influencing consumer price sensitivity.

As a result, you can set fair and competitive prices, while keeping your customers coming back. Also, most AI-based tools allow you to simulate pricing impact and identify the optimal price points for the products.

Stop losing margins to incompetent pricing

Contact us

Four ways pricing analytics can improve your top and bottom lines

Price testing, competitor analysis, focus groups — one can adopt various approaches to optimize pricing and arrive at maximum profit. But there’s no more efficient and faster way to come across high-value pricing decisions than to wield the sword of predictive data analytics.

Finance, marketing, and sales put under one roof

A pricing structure doesn’t exist in a vacuum. Instead, the adoption of new pricing structures should be done across marketing, sales, and product development.

But you know how it goes in business: sales are chasing volume, marketers are after discount-based promotion, and product development is grappling with increasing supplier prices. The result? Your teams cannot make their mind as one, each having a different understanding of optimal pricing options.

Through price analytics, companies can coordinate pricing and promotions, estimate the outcome of promotions at a product level, and apply customer segmentation to offer tailored promotions.

Also, a unified implementation across teams will help you achieve brand consistency in your discount strategy. Your marketers can implement strategic discounts without making your company lose a high-end brand perception.

Allowing for timely markdowns

Markdowns are the go-to strategy for brands to shed excess inventory. By offering goods at discounted prices, retailers can reel in price-sensitive consumers, boost sales, and bring new customers into their stores. However, the challenge is to mark products down in a way that benefits the business without harming brand perception or profitability.

To make sure all products are bargained for a fair price, retailers need to have a 360-degree view of the following data:

  • Average revenue generated by item to put up the right items for clearance: here, companies need to stack up historical data of each item’s performance during a specific period against the sales plan.
  • Optimal sales channels for a given item: retailers run the item-level analysis for each store to make sure the item is put up for sale in the right place — and adjust discount prices to each channel/store.
  • The timing and frequency of markdowns, which should be based on the merchandise life cycle, seasonality, and customer demand.
  • Clearance price optimized for gross margin and sell-through: drawing on historical consumer pricing behavior, companies should apply differential discounting across items.

If calculated precisely, each markdown factor can contribute to markdown optimization and increase profitability.

Enabling dynamic pricing

The goal of dynamic pricing is to allow a retailer to adjust prices on the fly to account for changing demand. Companies that implement this technique can change their prices in real-time based on the fluctuations in supply and demand, racking up greater revenues and increasing sales.

Static and dynamic pricing

Customization is a critical component of effective dynamic pricing, that’s why dynamic pricing tools make predictions based on a large number of variables, including:

  • Profitability analysis
  • Price/trend forecasting
  • Competitive pricing analysis
  • Customer analysis for personalized pricing

To execute on differentiated price points, companies should also have price management automation in place that allows for quick, at-scale product price setting. Also, pricing should be dictated by accurate, centralized data — otherwise, price reduction can result in big margin losses.

Empowering your sales with personalized pricing

Personalized pricing allows businesses to adjust prices based on customer demographics, location, purchase, and other customer data. Unlike dynamic pricing, this pricing strategy is specific to each customer, instead of relying on external market factors.

By fine-tuning your prices to each client, you can maximize revenue, improve profitability, and identify the maximum value of a product as perceived by the customer. To make the most out of customized pricing, you need to follow a systematic process that involves:

  • Customer segmentation: grouping customers into cohorts based on similar characteristics.
  • Data collection: collating relevant data about customers, including purchase history, geography, and other customer insights.
  • Competitor analysis: monitoring competitors’ prices to strike the right balance between price customization and profitability.
  • Automation and customization: managing price changes on the go and at scale.

Custom data analytics enables businesses to master all four components at once, fuelling real-time price alterations grounded on unified and complete data.

Find new sales opportunities with our pricing analytics software

Schedule a call

Pricing analytics tools aren’t all-mighty, you need data excellence

Although pricing software can ramp up your operational efficiency and increase revenue, it’s a blunt instrument if its data management capabilities are scanty and half-hearted. Let’s look at the building blocks of a pricing analytics tool that can actually move the needle.

Data collection

The first step towards a data-driven pricing strategy is to collect reliable data from multiple sources. Therefore, your pricing analytics tool should be able to collect and vacuum up data related to transaction data, CRM systems, market research, competitor pricing, and supply chain costs.

Data quality and cleansing

No good can come out of incomplete and erroneous data. That’s why your pricing analytics software should ensure data accuracy and reliability by filtering out anomalies, weeding out errors, and handling missing data points.

Integration capabilities

High-performing pricing software integrates with CRMs, sales platforms, ERPs, and inventory management platforms to pave the way for informed decisions based on a holistic view of business operations.

Data analysis

This is when magic happens. Data analytics pricing models churn through your data and pick up the low-hanging fruit that can create extra revenue. To offer on-point pricing optimization strategies, tools should be able to run multiple types of pricing analyses.

  • Segmentation analysis:

Splitting customers into customer segments based on common characteristics such as purchasing behaviors, preferences, and others, to tailor pricing strategies accordingly.

  • Competitive analysis:

Analyzing the pricing and promotional strategies of your competitors to gain market share.

  • Elasticity analysis:

Determining the optimal price for a product by understanding how price changes impact demand.

  • Cost analysis:

Understanding the rationale and economics of each cost component, from production to distribution, to ensure pricing doesn’t affect profitability.

  • Scenario analysis:

Simulating various pricing strategies to assess the future performance of price changes and their potential impacts on revenue.

  • Promotion and discount analysis:

Identifying the impact of promotional campaigns and discounts on overall profitability and assessing their effectiveness.

Pricing analytics dashboards

Visualizing data through interactive dashboards will help your team make sense of pricing tendencies, performance, and potential issues or opportunities. From average selling price to discounting strategy, dashboards reflect outliers and trends in your company’s pricing optimization efforts.

average selling price analysis

Also, when business models change, current pricing model, product bundling, and channel-specific strategies are rendered irrelevant. Dashboards with iterative forecasts (like the one you can see below) help you keep up with changes without manually updating data.

interactive dashboards

Turning pricing into smart pricing with AI

Through the use of advanced analytics and artificial intelligence, companies can amplify the capabilities of their pricing analysis tools. Levi’s, for example, has elevated its average unit retail by 10% without negatively impacting demand — all thanks to AI.

Analyzing different data sources, pricing recommendation engines, what-if simulations, and other next-level AI-enabled features give an upper hand to pricing tools, allowing them to create more effective pricing strategies, run more accurate customer segmentation, and recommend optimal price points.

Security and compliance

Last, but not least, your pricing analysis tool should keep your customer data under lock and key to maintain customer privacy. The data processing flow must also meet industry regulations, ensuring compliance excellence at all levels of analysis.

What does it take to brew a successful pricing strategy?

Keeping tabs on customer buying habits, competitor prices, and market conditions can be quite dizzying unless it’s automated. Pricing analytics tools take this burden off your shoulders, revealing a real-time view of every data point that can affect your pricing decisions.

Paired with AI, smart pricing analysis turns from descriptive into predictive, identifying tangible opportunities for revenue growth. But to capitalize on the potential of pricing analytics, your company should first shore up current capabilities, assess data readiness, and make necessary connections in the existing IT ecosystem.

Create a data analytics center of excellence for maximum impact

Get in touch

FAQ

What is the future of pricing analytics?

As the competition is growing and margins are shrinking, pricing analytics will continue to supercharge the pricing strategies of companies. This technology will lead business on the way to optimized pricing aligned across channels, quick pricing wins, and accurate customer insights.

What are the tools for price analysis?

Using pricing analytics software, companies can determine the optimal pricing strategy for their products. Businesses have two options when it comes to price analysis tools: they can either go for platform-based solutions such as systems based on Tableau and Power BI or opt for custom software built from scratch. Each option brings its own benefits to the table so it’s important to know your requirements before going into development.

How do you analyze price data?

A detailed dive into pricing data calls for comprehensive monitoring of pricing history, competitor prices, customer behavior, average revenue per user/ customer, and other data points. Smart pricing tools unify all data and run analysis on input without your manual effort.

A Not-to-Miss Opportunity: How to Build Data Products

Becoming data-driven has been a long-standing ambition for companies since lavish amounts of data came into sight. But the transition to a data-centric company is not that simple. Today, top performers are setting the bar high — thinking of data as a stand-alone product rather than a side activity. 

A data product strategy is hailed as the fastest way to realize near-time value from data and pave the way for new revenue streams. Around 84% of the market value of S&P 500 companies stems from intangible assets, including data and software. 

Any company can build a data product, so why not grasp this opportunity and get the most out of the insights you already have? Let’s dive deep into data product development and its benefits.

Why does a project mindset no longer work?

Over the past few years, companies have changed their perspective on how teams operate to better position them for adopting new technologies. A transition from a project-driven to a product-based mindset takes center stage in this transformation. Why? Because a project approach has been rendered ineffective in managing data assets.

Takes more time than it could

Whenever a business function stumbles, the team kicks off a project to solve the problem through data technologies. The project initiation sets in motion the entire lifecycle of data collecting, cleansing, and aligning it with a specific use case. In this context, each business case requires a separate data preparation cycle.

Focuses on completing tasks rather than delivering value to customers

A project is born and planned to deliver a clearly defined scope, within budget and on time. Rather than focusing on evolving customer needs, it is rooted in a specific business case, task, and process. There is no place for personas or recipients of value, while data products are wired to solve a core user need.

Fails to connect the dots across the company’s data sources

A project mindset supports a silo mentality where data exists in isolated applications and is taken as a necessary step for project needs. Therefore, a project framework neither channels data opportunities to the entire organization nor provides employees from different units with easy access to data.

Conversely, a product-first vision allows teams to set up their data estate as an interoperable organism, with each asset contributing to the whole picture.

Makes it impossible to reuse the outputs to address other use cases

As a project originates as a response to a specific task, its outcomes can hardly be repurposed for other projects. In this case, both data sets and technologies are stored as use case-specific assets instead of becoming a unified hub. This fragmented structure doesn’t accommodate evolving requirements or support multiple outcomes.

data product strategy

Leads to a heavy reliance on the data team and an array of bottlenecks

Within a project framework, data is a luxury kept in the hands of data science teams. Individual teams have to collate the data they need, which results in effort duplication and a raft of dependencies. Most of the time, the input isn’t aligned with business use cases and doesn’t scale to end-user needs.

What is a data product?

A data product is a self-adaptive and versatile power plant built at the intersection of data, industry insights, software engineering, and analytics. The input it produces can fuel the development of brand-new data products designed for other business contexts. Data products are built on top of data management systems such as warehouses or lakes.

data product strategy

Spotting opportunities for new value through different types of data products

Data products come in different forms and shapes. Based on their granularity, organizations can make them available within a specific business unit, hand out to the entire company, or market beyond the company’s settings. Let’s go over these top three data products examples:

Used within a single business unit

This group of products provides data as it is, with some level of processing. The main goal of this product cohort is to improve internal efficiency and augment decision making within a given area of business activity.

Most examples of data products in this category revolve around an analytical record or dataset, such as customer data. For instance, this can be a customer 360 dataset added to your CRM application to support the decision-making process of the sales department.

Cross-organizational

This group of products isn’t limited to a single business domain. With innovation as their core value, such data products make data available to users across the entire organization, enabling them to come up with ideas for other breakthrough products and services. As a result, this product category supports a business unit’s decision making and accelerates time-to-insight for other units.

Data governance plays an important role here as all business units must agree on the right levels of service level objectives, data quality, and lineage. The usability of enterprise-wide data analytics solutions can be enhanced through experiment sandboxes that allow for exploring new data use cases.

Used outside the organization

At this level, an organization gives access to the data product to external or third-party providers to drive new revenue streams. A central data team makes datasets compliant with relevant regulations and governance rules. Authenticated and easy data access is an important prerequisite for an external data product.

For example, a medical device manufacturer can develop a new monetization opportunity by providing device data to healthcare providers via compliant APIs.

Anatomy of a data product: four core components

When building data products, organizations can present them to end users through different types of interfaces and interactions.

Datasets

A dataset is the most basic and well-known type of data product presentation. In this case, it should be a reusable dataset, stream, feed, or API that backs up various business objectives.

Code

Data as a product may come in the form of a transformation code that changes an existing solution or creates the data product on top of the existing basis. You can also pack it into out-of-the-box data models that can be combined to construct flexible, scalable data models for different business domains.

Algorithms and analytics models

Reusable machine learning models are another way to pack data products. Instead of locating a suitable model from an external resource and training it with the data, organizations can apply reusable machine algorithms to solve a variety of different problems. The algorithm feeds on the underlying data foundations while improving the applications.

Dashboards

Most data visualizations and dashboards available through interactive visual interfaces do not cover domain-specific needs, such as a healthcare context. Reusable data visualization components and dashboards, on the contrary, can be customized and extended to meet end users’ specific needs.

Uncork the success of the product-led vision

According to Harvard Business Review, companies with a data-led product vision reduce the time it takes to adopt existing data heritage in new business cases by 90%. But along with accelerated innovation, creating data products allows companies to tap into other, equally essential business benefits.

Drive customer value

The product mindset places customer feedback at the heart of all processes and bases your application on real-time insights, rather than static data sets. Moreover, it enables you to serve data in ways that your customers can leverage, be it a warehouse for a data analyst or dashboards for business users.

Open up new revenue streams

Core data products are based on foundational data aggregated by your company. You can generate incremental revenue for and from every department or derive it from external customers by repurposing this data for other business use cases. For example, Apple shares users’ Health app data with healthcare organizations participating in the Health app.

Speed up time-to-insight

Data products enable more speed and efficiency as they are essentially pre-built. Teams don’t have to spend much time collecting and preparing raw data as it’s available on data platforms in a ready-to-use format.

data product strategy

Leverage real-time data

Data-as-a-product approach reinforces real-time business intelligence, allowing you to analyze data as soon as it’s available. As fresh-baked input is stored in a structured format in an integrated database, companies can both provide a real-time response for operational use cases and get updated about shifting consumer behaviors.

Make data available for everyone in the business who needs it

Product-led is a part of the data mesh architecture that empowers domain teams to perform cross-domain data analysis on their own. This approach democratizes data accessibility, making relevant enterprise data readily accessible for all teams.

Consume data easily

Treating data as a product involves understanding how to make the input easily digestible for the end user. Unlike raw datasets, data products are wrapped into a well-defined interface (e.g. visuals, apps, and others), which improves comprehensibility of insights for both internal teams and external customers.

Don’t let your data go to waste – productize it

Find out how

Crafting a data product

A data-as-a-product mindset organizes the data life cycle along the lines of a production process. Just like any other commercial offering, a data-based product follows an iterative path to make sure it delivers the desired business outcome.

data product strategy

Ideation

The ideation stage in data product development is the first point of entry into the design process. It is where business objectives and requirements are defined, documented, and analyzed. At this stage, a product owner is assigned.

Design

Following the defined requirements, the team decides on whether they are developing a from-scratch foundational product or a derived one based on other core data models. The product’s granularity also plays a central role in defining the high-level design. The more granular it is, the more effort end users have to make to navigate it. This stage also finalizes the creation of a conceptual data model.

Engineering

At this stage, a cross-functional team drives the product from the idea phase to the actual building. This stage results in an MVP, an early product version that collects the feedback of a select group of lighthouse users.

Release

As the team iterates on the users’ feedback, the product gets new features and updates. The new versions, such as MMP, are then rolled out to the customer.

Maintenance

Once the product is out into the wild, a support team is assigned for troubleshooting and ongoing maintenance and support. Center of excellence teams disseminates best practices for easier product adoption, while the support team monitors the data pipelines associated with the product.

The bedrock of effective data products: expertise as the foundation

To create data products, companies need to develop a wide range of data management capabilities supported by data-first technologies, hands-on technological expertise, and profound domain knowledge.

Technology and data governance backbone

An efficient data strategy allows organizations to derive sustainable value from enterprise data and make it easily available for creating data products.

  • Data gathering — systems of records that collect quality and valuable data from internal and external resources.
  • Data storage and integration — domain-agnostic, shared data platforms for both long- and short-term storage, including data warehouses, lakes, and operational data stores.
  • Data product management — a new organizational function to manage data quality, service level objectives, architectural improvements, and more.
  • Data visualization — visuals and dashboards that display a specific data product.
  • Cloud computing — scalable and flexible architectures that distribute data pipeline workloads.
  • Artificial intelligence — ML models that consume data products to assist decision-making.

Cross-functional skills

To create successful and compliant products, an organization also needs a data utility group. The latter includes product managers and stream-aligned domain data teams that provide operational and process assistance to data product teams. Business analysts, DevOps, and product managers, in turn, enable rapid iteration and product alignment with business needs.

Domain knowledge

To execute a high-performing data monetization strategy, you also need profound expertise in the area you’re developing for. This way, you can accurately assess the feasibility and value of use cases in the domain.

The key to sustainable value creation

Data has become on par with financial capital that helps businesses thrive in the digital age. Data products come with greater ROI, fit into multiple use cases, and bring multiple objectives over the goal line — with lower cost-per-use.

But to unleash the potential value, you need to lead with architecture that brings your enterprise data together, makes it traceable and easily accessible. Coupled with the right expertise and operating model, it helps generate reusable data products with future-proof value.

Let’s make your data more valuable

Schedule a call

How to Create a Business Intelligence Strategy? | Expert View

What should be the first step of your BI journey? Choosing a tool? Collecting data? Not so much. It’s a comprehensive business intelligence strategy that will help you move toward advanced analysis. 

While BI can make your reporting faster and graphs more sophisticated, even without a proper plan, you still will be deprived of a holistic view of how to use the technology to your maximum benefit. As you probably know, the devil is in the details. That’s why, not to let them slip away, imperiling your whole BI initiative, you need to follow particular business intelligence implementation steps. 

In this article, we analyze real-life cases of our clients who have leveraged a BI strategy despite being at different stages of BI implementation. Some were new to using business intelligence and wanted to ‘make it right’ from the very beginning, others had been already using BI tools, but mostly intuitively, without any specific plan. Nevertheless, all of them could see how much the quality of data analysis improved with proper strategizing.

If you don’t want to fall by the wayside, here are the reasons to care about business intelligence strategy

Business intelligence isn’t only about creating flashy presentations. The potential and value of the technology are much broader, and they can be unlocked through a proper business intelligence plan. With a BI strategy, you can tackle data issues more efficiently, build a holistic, well-integrated system, and ensure it remains to function properly. 

  • Saving time and money. Acting on a whim is fraught with costly mistakes. No one wants to waste money on features that, in the end, no employee will need or buy licenses for 100 employees if the system will be used only by 20 of them. A BI strategy allows you to think through such things in advance, saving time and money.  
  • Adopting advanced risk management. You minimize the likelihood of losing time and money by analyzing each step in detail. Furthermore, with such an approach, you’ll be able to detect weak spots and bottlenecks earlier and fix them right away. 
  • Building end-to-end data analytics across your organization. A well-thought-out BI strategy empowers you to break data silos between departments and connect all your data sources to get end-to-end analytics. Such an approach allows you to track processes throughout the organization, which means you can spot problems in time and make decisions backed up by accurate and up-to-date data.

A well-designed and nuanced BI strategy helps to significantly revamp internal business processes, which, in turn, has a positive impact on the quality of service or product you provide your customers.

Want to boost your BI maturity level? We’re here to support you

Book a call 

3 areas you can’t ignore when building a BI strategy

To create a robust business intelligence strategy, you should take care of vision, people, and processes — paying equal attention to each element and their interrelationships. Let’s investigate them in more detail.

Vision

Before adopting any technology, you need to ask yourself a couple of fundamental questions, such as “What is its practical value for our organization? What do we want to achieve thanks to it?” The answers to them will help you outline an action plan on BI implementation or optimization.  

To build a data-driven culture in your organization, you should also review how you handle your data. Rather than thinking of it as raw material for analytics, treat it as a product with a real return on investment. 

People

When creating a BI implementation strategy, you shouldn’t discount your employees and their skills. Otherwise, you’ll waste your budget and time adopting the technology, which will be sabotaged by people who got used to working differently.  

Therefore, take into account who will interact with a BI tool to provide suitable dashboards for each decision-making level. For example, an employee responsible for machinery maintenance, data analyst, and CEO require different types of dashboards. 

Check here to learn more about operational, analytical, and strategic dashboards.

Another point to keep in mind about your employees is their technical background. Creating a business intelligence strategy and roadmap for a tech-savvy company isn’t the same as building it for an organization that isn’t on close terms with digital technologies. 

When we understand the level of users’ technical expertise and the processes they are involved in, we can create custom dashboards for each role instead of one general dashboard for all company processes with a mind-boggling number of filters. This expands the range of BI users from executives and analysts to rank-and-file managers and employees.

Process

This side of the BI strategy is about setting up the technology implementation process. For this, you should think about employing a Chief Data Officer (CDO), define a project budget, consider security and compliance questions, and identify KPIs to track the effectiveness of the BI blueprint and technology adoption.

Also, it’s crucial to take care of knowledge transfer from your technology partner. Therefore, pay attention to establishing a BI competency center. BICC is your in-house team that will make the self-use of the system truly comfortable for non-tech savvy employees and handle minor adjustments such as dashboard configuration. 

With this approach, you make users more advanced, and as a result, increase the speed of change and the efficiency of working with the BI system. You’ll also become less dependent on your technology partner and only turn to them for major modifications such as connecting new data sources to the system, visualizing data on new business processes, and more.

The final result of the work on the process area of a BI strategy is the development of a BI roadmap. It’s a document that consistently describes the particular steps necessary for implementing BI, project milestones, deadlines, and KPIs to evaluate your progress.

Bolster your digital transformation initiative by turning raw data into refined knowledge

Act now!

Data profiling: a fundamental step you should take

Before loaded into a BI system, your data must be checked for quality and consistency. This is what data profiling is about.

  • Data quality. Poor data quality is the reason for a myriad of business problems, such as inaccurate financial forecasts, regulatory issues, lost customers, reputational damage, etc. If you don’t take care of it in the initial data analysis stage, dealing with low-quality data will drain your staff’s time — and that’s before we mention irrelevant results. Statistics show that covering repetitive problems related to data quality may take up to half of the employees’ working hours.  
  • Data consistency. Duplication of data in different systems can reflect suboptimal business processes, wherein employees manually and in an uncoordinated way enter the same information in two different systems. As a result, input errors and incomplete matching inevitably occur. Instead, the rule of a single entry point for any data should work, and then the systems should only exchange it rather than create a copy.
  • Data classification. This is needed when data comes from a variety of sources. It can be your data lake, ERP, or traffic from your site, to name a few. In addition to the source, you should consider data structure (structured or unstructured) to properly classify data, as it simplifies determining the update frequency for each data profile.   

When profiling data, you may uncover that some of it isn’t updated as often as needed for effective decision-making. 

Consider that you don’t necessarily have to strive for real-time updates. Usually, you only need such things when dealing with financial markets. However, if you own an e-commerce business and your logistics system and ERP are synchronized only once a day, there might be a situation when the product has arrived at the store but it isn’t displayed on the site. Thus, you risk losing customers because of the insufficient frequency of data updates.

We suggest doing continuous data profiling. Leverage automation to speed up and simplify the process. 

Looking for an expert to automate data profiling?

Reach out 

Architecture and toolset selection

When picking BI tools, you need to choose those that will allow you to ingest, store, process, analyze, and visualize data easily.

1. Ingestion 

Ingesting data implies taking raw data from primary sources without transforming it. You need to choose an appropriate method of data ingestion. 

  • Real-time processing. Once the ingestion software recognizes the data piece, it downloads the data in your data lake or warehouse as a separate object. 
  • Batching. With this approach, data ingestion software collects data, groups it based on criteria or a schedule, and then sends it to the data storage in batches. 
  • Micro batching. This is a subtype of batch processing. The difference is that the batches are smaller. 
business intelligence strategy

Data ingestion software depends on the type of data you process, the data sources you use, and the speed you need to access the data. Apache Kafka, Azure Stream Analytics, and Amazon Kinesis are the most notable players in the data ingestion tools market.

2. Storage

This is the point where you should identify where your data will be stored. Several options are available. We’ve already covered data lake and warehouse differences when discussing building a solid data infrastructure. 

Moreover, you should determine which of your data is ‘hot’ and which is ‘cold’ if you want to save on storing data that you don’t need on hand all the time. Both on-premise and cloud storages offer options for hot and cold data. For instance, hot data that has to be easy and fast to assess can be stored on the solid-state (SSD) drivers and in-memory (RAM), and cold archival data can be kept on optical disks. There’s also warm data that is used not as often but isn’t archived, like the five-year-old sales data you need every few years for a cut-off point. It can be stored on hard disk drivers (HDD). 

business intelligence strategy

3. Processing

It’s impossible to directly connect heterogeneous data sources and a data warehouse where information has to be cleared of errors, structured, and classified. You’ll need a bridge, an ETL tool that processes the raw data and unifies it in three steps.

  • Extract. The tool retrieves data from your data sources, such as spreadsheets, legacy systems, CRM, ERP, analytics, etc.
  • Transform. All extracted data is analyzed to identify duplicates and delete them, form new columns or split them, etc. After that, the data can be standardized – filtered, sorted, and verified.
  • Load. The data goes into the repository or analytic software.

The difference between ETL and data ingestion is that there is a data transformation step in the case of ETL.

As long as the ETL process plays the first fiddle in providing high-quality data analysis, choosing a proper tool becomes a crucial undertaking. The decision has to be based on multiple factors, such as your use case (a cloud solution or on-premise one, the necessity of real-time updates, etc.), maintenance specifications, scalability, built-in integrations, and costs.  

Struggling to find an ETL tool to enhance your data processing?

We’re here to help

4. Analytics and visualization

Defining an analytical toolset is the next step in your BI strategy. According to the Gartner Magic Quadrant, you should pay attention to three leaders in the field of data analytics – Power BI, Tableau, and Qlik. The choice of the most appropriate tool needs to be guided by your requirements and limitations.

  • Present architecture. It isn’t mandatory to implement a separate BI solution. Analytics can be built into your existing applications to speed up decision-making and its accuracy. Moreover, embedded analytics and immediate access to data encourage users to rely on data more in their everyday tasks.
  • Current technology stack. If your organization already uses Microsoft products, choosing Power BI and other infrastructure tools from the Microsoft stack is a more reasonable approach.
  • Range of users and tasks. Tools for a startup and a corporation with 3,000 users will be different. The latter will probably need an open-source solution to eliminate licensing costs or arrangements with the vendor for a special licensing plan and discounts. Whereas a scaling startup can definitely consider other options.

By thoughtfully assembling a toolkit at this stage, you can empower each employee to be a data hero. Here are some examples of dashboards for rank-and-file staff and C-suite team members.

Operational dashboards for employees from different departments include detailed real-time information.

business intelligence strategy

And strategic dashboards for senior-level management include key metrics across the whole organization. 

business intelligence strategy

Don’t puzzle over your data analytics pipeline

We’ll help

How we helped a large retailer to increase a turnover by 9%. Spoiler alert: it’s about a logical BI strategy

A well-developed BI implementation strategy empowers you to leverage the technology entirely. Here’s a BI strategy example that allowed one of our clients, a vending machine retailer, to make more accurate decisions faster, keeping up with their business growth trajectory.

The existing solution was inefficient in terms of scalability:

“We never completely realized that we have so much unused data. Only about half of all the data we had was used to make decisions”, says the company’s product and customer experience director.

So how were the carefully designed strategy and the precise BI roadmap developed? 

During the Vision phase, we found that business intelligence could improve several company processes:

  • Finding lost sales
  • Detecting low-margin contracts
  • Monitoring the technical condition of vending machines in real-time

Additionally, the client needed an intuitive tool without limits on how much data they could process. And although Power BI is the most user-friendly tool, it also has a limit of 3,500 data points. Therefore, because of the client’s data volume requirement, we chose Qlik, which has no rigid limitations in the number of data points.

After implementing BI software in accordance with the strategy worked out in advance, the client reduced the number of lost sales by 30%, renegotiated low-margin contracts, and minimized vending machine downtime as much as possible. The confluence of these results led to a 9% increase in total client turnover in half a year. 

For more details on the aforementioned project

download the full case study

Unleash the full potential of a BI system

Ideally, a strategy is developed before any steps are taken to implement the solution. But what about organizations that have already managed to implement the technology themselves, even picked some low-hanging fruit, but then realized that the capabilities of BI could extend much further? 

At some point, users who are not new to BI understand that they can’t unlock the full potential of the technology without a proper business intelligence strategy and roadmap. 

A BI strategy for organizations that already use the technology will include the same basic steps — just like for beginners. It’s just as vital for them to keep the Vision, People, and Process in mind, take care of data quality, reconsider BI tools, etc. However, another thing to pay attention to is emerging. Organizations with self-implemented BI have to constantly extinguish fires that inevitably occur, such as handling backlogs and dealing with issues that popped up after BI adoption and can’t be shelved for later.

One of our customers implemented Power BI for employees of all departments and levels. But ​​over a year, they realized that they were not using all the capabilities of the tool. Therefore, we took action. Working in two directions while establishing the business intelligence strategy, we:

  • Launched in-depth research on the system’s architecture, features, and limitations. It’s a mandatory step to adjust the data storage architecture to the needs of the system’s end users so that employees at any organizational level can independently retrieve the data they need from the data storage and use this information to create customized reports. 

Simultaneously with this large-scale process, we worked with the client’s current tasks.

  • Helped cover ongoing tasks. The customer also had clearly defined tasks, but their in-house BI team was too small and not skillful enough to handle the workload. We tapped into these activities. This way, the client got the reports they needed faster, and we got to know the system’s architecture and the people on the client side so we could pass the knowledge to them.

Planning to develop a business intelligence strategy to optimize an existing solution?

Drop us a line

A comprehensive BI strategy allows you to increase the odds of your BI project’s success

Without elaboration on the Vision, People, and Process areas, you can’t accurately choose the solution architecture or the most powerful toolset for your tasks. Therefore, it’s better to take a holistic approach to implementing a data analytics solution by developing a BI strategy. Also, keep in mind that your BI project doesn’t end with BI deployment. It’s a long-lasting initiative. Your BI software has to evolve constantly as your external and internal conditions change, and new processes, systems, and data appear. To make these adjustments smooth, you need a business intelligence strategy. Without a robust BI strategy that is periodically adapted to the current state of things, it will be much harder to figure out how to move forward.

Need a tech partner to build a solid BI strategy, adopt the solution, and take on its updates?

Get in touch
Anna Vasilevskaya
AI modified real photo
Anna Vasilevskaya
Account Executive

Get in touch

Drop us a line about your project at
[email protected] or via the contact
form below, and we will contact you soon.