How to Create a Business Intelligence Strategy? | Expert View

What should be the first step of your BI journey? Choosing a tool? Collecting data? Not so much. It’s a comprehensive business intelligence strategy that will help you move toward advanced analysis. 

While BI can make your reporting faster and graphs more sophisticated, even without a proper plan, you still will be deprived of a holistic view of how to use the technology to your maximum benefit. As you probably know, the devil is in the details. That’s why, not to let them slip away, imperiling your whole BI initiative, you need to follow particular business intelligence implementation steps. 

In this article, we analyze real-life cases of our clients who have leveraged a BI strategy despite being at different stages of BI implementation. Some were new to using business intelligence and wanted to ‘make it right’ from the very beginning, others had been already using BI tools, but mostly intuitively, without any specific plan. Nevertheless, all of them could see how much the quality of data analysis improved with proper strategizing.

If you don’t want to fall by the wayside, here are the reasons to care about business intelligence strategy

Business intelligence isn’t only about creating flashy presentations. The potential and value of the technology are much broader, and they can be unlocked through a proper business intelligence plan. With a BI strategy, you can tackle data issues more efficiently, build a holistic, well-integrated system, and ensure it remains to function properly. 

  • Saving time and money. Acting on a whim is fraught with costly mistakes. No one wants to waste money on features that, in the end, no employee will need or buy licenses for 100 employees if the system will be used only by 20 of them. A BI strategy allows you to think through such things in advance, saving time and money.  
  • Adopting advanced risk management. You minimize the likelihood of losing time and money by analyzing each step in detail. Furthermore, with such an approach, you’ll be able to detect weak spots and bottlenecks earlier and fix them right away. 
  • Building end-to-end data analytics across your organization. A well-thought-out BI strategy empowers you to break data silos between departments and connect all your data sources to get end-to-end analytics. Such an approach allows you to track processes throughout the organization, which means you can spot problems in time and make decisions backed up by accurate and up-to-date data.

A well-designed and nuanced BI strategy helps to significantly revamp internal business processes, which, in turn, has a positive impact on the quality of service or product you provide your customers.

Want to boost your BI maturity level?

Book a call 

3 areas you can’t ignore when building a BI strategy

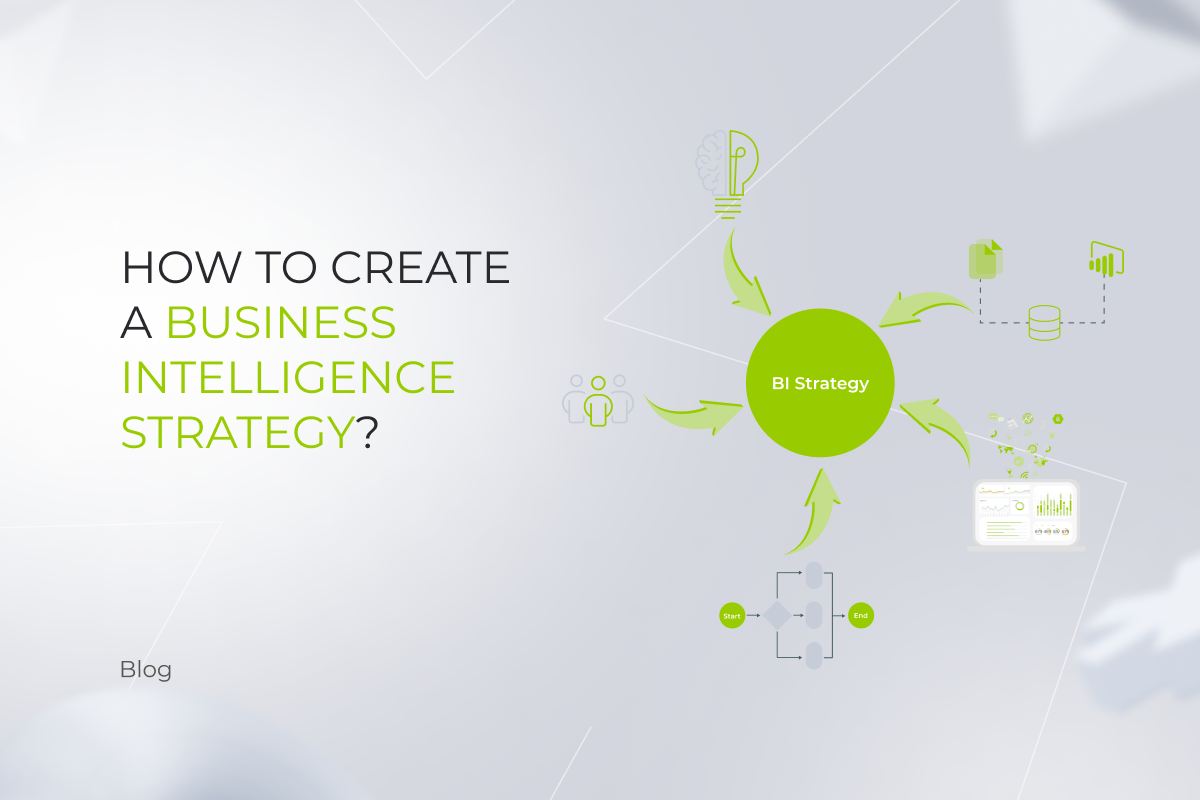
To create a robust business intelligence strategy, you should take care of vision, people, and processes — paying equal attention to each element and their interrelationships. Let’s investigate them in more detail.

Vision

Before adopting any technology, you need to ask yourself a couple of fundamental questions, such as “What is its practical value for our organization? What do we want to achieve thanks to it?” The answers to them will help you outline an action plan on BI implementation or optimization.  

To build a data-driven culture in your organization, you should also review how you handle your data. Rather than thinking of it as raw material for analytics, treat it as a product with a real return on investment. 

People

When creating a BI implementation strategy, you shouldn’t discount your employees and their skills. Otherwise, you’ll waste your budget and time adopting the technology, which will be sabotaged by people who got used to working differently.  

Therefore, take into account who will interact with a BI tool to provide suitable dashboards for each decision-making level. For example, an employee responsible for machinery maintenance, data analyst, and CEO require different types of dashboards. 

Check here to learn more about operational, analytical, and strategic dashboards.

Another point to keep in mind about your employees is their technical background. Creating a business intelligence strategy and roadmap for a tech-savvy company isn’t the same as building it for an organization that isn’t on close terms with digital technologies. 

When we understand the level of users’ technical expertise and the processes they are involved in, we can create custom dashboards for each role instead of one general dashboard for all company processes with a mind-boggling number of filters. This expands the range of BI users from executives and analysts to rank-and-file managers and employees.

Process

This side of the BI strategy is about setting up the technology implementation process. For this, you should think about employing a Chief Data Officer (CDO), define a project budget, consider security and compliance questions, and identify KPIs to track the effectiveness of the BI blueprint and technology adoption.

Also, it’s crucial to take care of knowledge transfer from your technology partner. Therefore, pay attention to establishing a BI competency center. BICC is your in-house team that will make the self-use of the system truly comfortable for non-tech savvy employees and handle minor adjustments such as dashboard configuration. 

With this approach, you make users more advanced, and as a result, increase the speed of change and the efficiency of working with the BI system. You’ll also become less dependent on your technology partner and only turn to them for major modifications such as connecting new data sources to the system, visualizing data on new business processes, and more.

The final result of the work on the process area of a BI strategy is the development of a BI roadmap. It’s a document that consistently describes the particular steps necessary for implementing BI, project milestones, deadlines, and KPIs to evaluate your progress.

Turn raw data into refined knowledge

Act now!

Data profiling: a fundamental step you should take

Before loaded into a BI system, your data must be checked for quality and consistency. This is what data profiling is about.

  • Data quality. Poor data quality is the reason for a myriad of business problems, such as inaccurate financial forecasts, regulatory issues, lost customers, reputational damage, etc. If you don’t take care of it in the initial data analysis stage, dealing with low-quality data will drain your staff’s time — and that’s before we mention irrelevant results. Statistics show that covering repetitive problems related to data quality may take up to half of the employees’ working hours.  
  • Data consistency. Duplication of data in different systems can reflect suboptimal business processes, wherein employees manually and in an uncoordinated way enter the same information in two different systems. As a result, input errors and incomplete matching inevitably occur. Instead, the rule of a single entry point for any data should work, and then the systems should only exchange it rather than create a copy.
  • Data classification. This is needed when data comes from a variety of sources. It can be your data lake, ERP, or traffic from your site, to name a few. In addition to the source, you should consider data structure (structured or unstructured) to properly classify data, as it simplifies determining the update frequency for each data profile.   

When profiling data, you may uncover that some of it isn’t updated as often as needed for effective decision-making. 

Consider that you don’t necessarily have to strive for real-time updates. Usually, you only need such things when dealing with financial markets. However, if you own an e-commerce business and your logistics system and ERP are synchronized only once a day, there might be a situation when the product has arrived at the store but it isn’t displayed on the site. Thus, you risk losing customers because of the insufficient frequency of data updates.

We suggest doing continuous data profiling. Leverage automation to speed up and simplify the process. 

Looking for an expert to automate data profiling?

Reach out 

Architecture and toolset selection

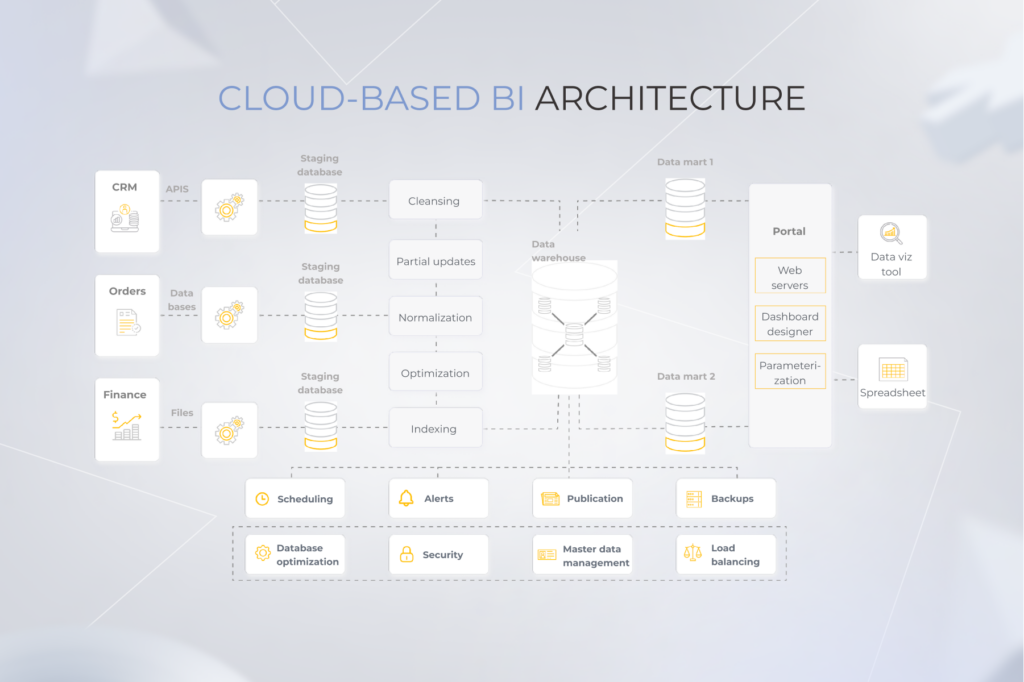
When picking BI tools, you need to choose those that will allow you to ingest, store, process, analyze, and visualize data easily.

1. Ingestion 

Ingesting data implies taking raw data from primary sources without transforming it. You need to choose an appropriate method of data ingestion. 

  • Real-time processing. Once the ingestion software recognizes the data piece, it downloads the data in your data lake or warehouse as a separate object. 
  • Batching. With this approach, data ingestion software collects data, groups it based on criteria or a schedule, and then sends it to the data storage in batches. 
  • Micro batching. This is a subtype of batch processing. The difference is that the batches are smaller. 
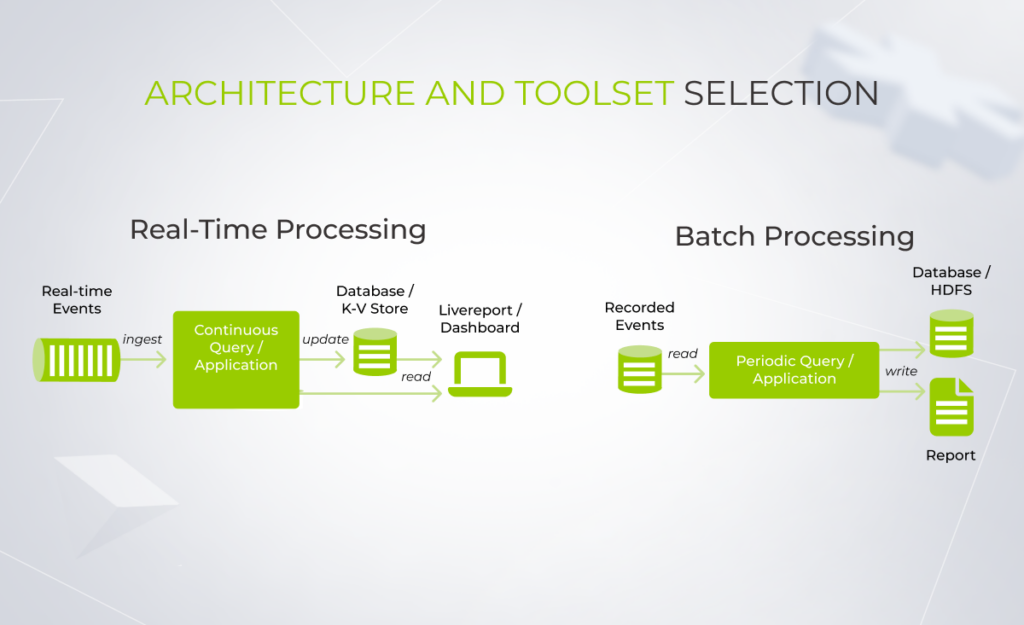
business intelligence strategy

Data ingestion software depends on the type of data you process, the data sources you use, and the speed you need to access the data. Apache Kafka, Azure Stream Analytics, and Amazon Kinesis are the most notable players in the data ingestion tools market.

2. Storage

This is the point where you should identify where your data will be stored. Several options are available. We’ve already covered data lake and warehouse differences when discussing building a solid data infrastructure. 

Moreover, you should determine which of your data is ‘hot’ and which is ‘cold’ if you want to save on storing data that you don’t need on hand all the time. Both on-premise and cloud storages offer options for hot and cold data. For instance, hot data that has to be easy and fast to assess can be stored on the solid-state (SSD) drivers and in-memory (RAM), and cold archival data can be kept on optical disks. There’s also warm data that is used not as often but isn’t archived, like the five-year-old sales data you need every few years for a cut-off point. It can be stored on hard disk drivers (HDD). 
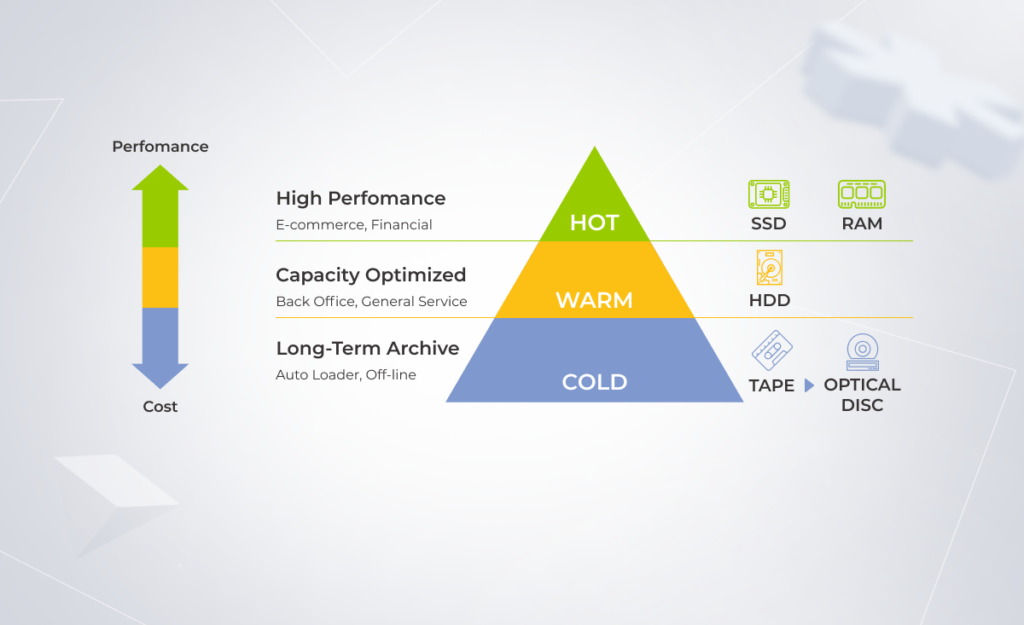
business intelligence strategy

3. Processing

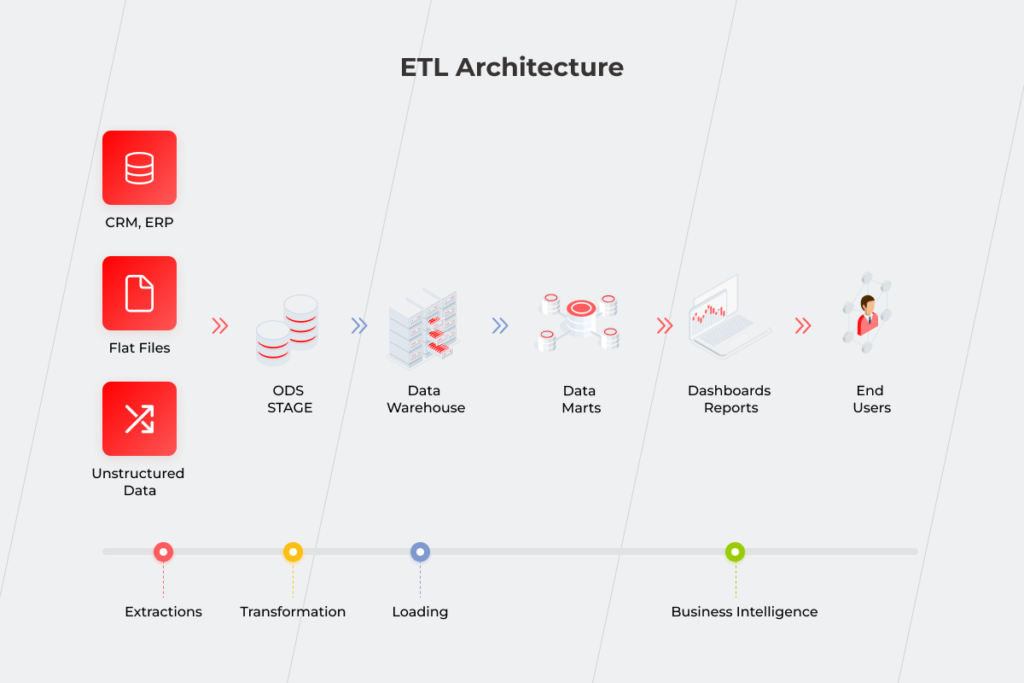
It’s impossible to directly connect heterogeneous data sources and a data warehouse where information has to be cleared of errors, structured, and classified. You’ll need a bridge, an ETL tool that processes the raw data and unifies it in three steps.

  • Extract. The tool retrieves data from your data sources, such as spreadsheets, legacy systems, CRM, ERP, analytics, etc.
  • Transform. All extracted data is analyzed to identify duplicates and delete them, form new columns or split them, etc. After that, the data can be standardized – filtered, sorted, and verified.
  • Load. The data goes into the repository or analytic software.

The difference between ETL and data ingestion is that there is a data transformation step in the case of ETL.

As long as the ETL process plays the first fiddle in providing high-quality data analysis, choosing a proper tool becomes a crucial undertaking. The decision has to be based on multiple factors, such as your use case (a cloud solution or on-premise one, the necessity of real-time updates, etc.), maintenance specifications, scalability, built-in integrations, and costs.  

Struggling to find an ETL tool to enhance your data processing?

We’re here to help

4. Analytics and visualization

Defining an analytical toolset is the next step in your BI strategy. According to the Gartner Magic Quadrant, you should pay attention to three leaders in the field of data analytics – Power BI, Tableau, and Qlik. The choice of the most appropriate tool needs to be guided by your requirements and limitations.

  • Present architecture. It isn’t mandatory to implement a separate BI solution. Analytics can be built into your existing applications to speed up decision-making and its accuracy. Moreover, embedded analytics and immediate access to data encourage users to rely on data more in their everyday tasks.
  • Current technology stack. If your organization already uses Microsoft products, choosing Power BI and other infrastructure tools from the Microsoft stack is a more reasonable approach.
  • Range of users and tasks. Tools for a startup and a corporation with 3,000 users will be different. The latter will probably need an open-source solution to eliminate licensing costs or arrangements with the vendor for a special licensing plan and discounts. Whereas a scaling startup can definitely consider other options.

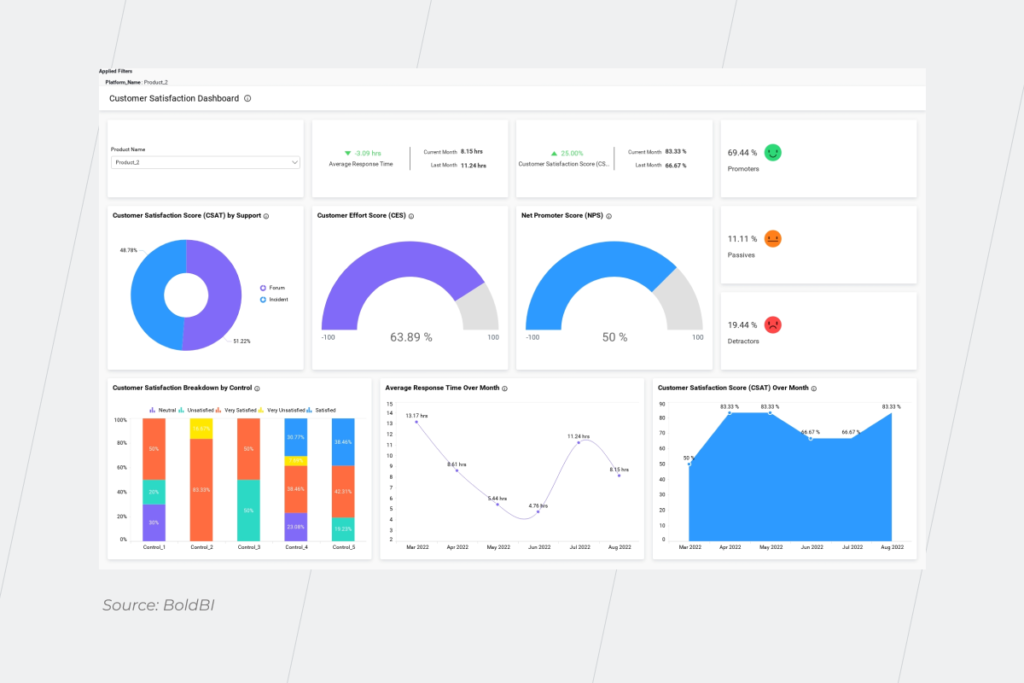
By thoughtfully assembling a toolkit at this stage, you can empower each employee to be a data hero. Here are some examples of dashboards for rank-and-file staff and C-suite team members.

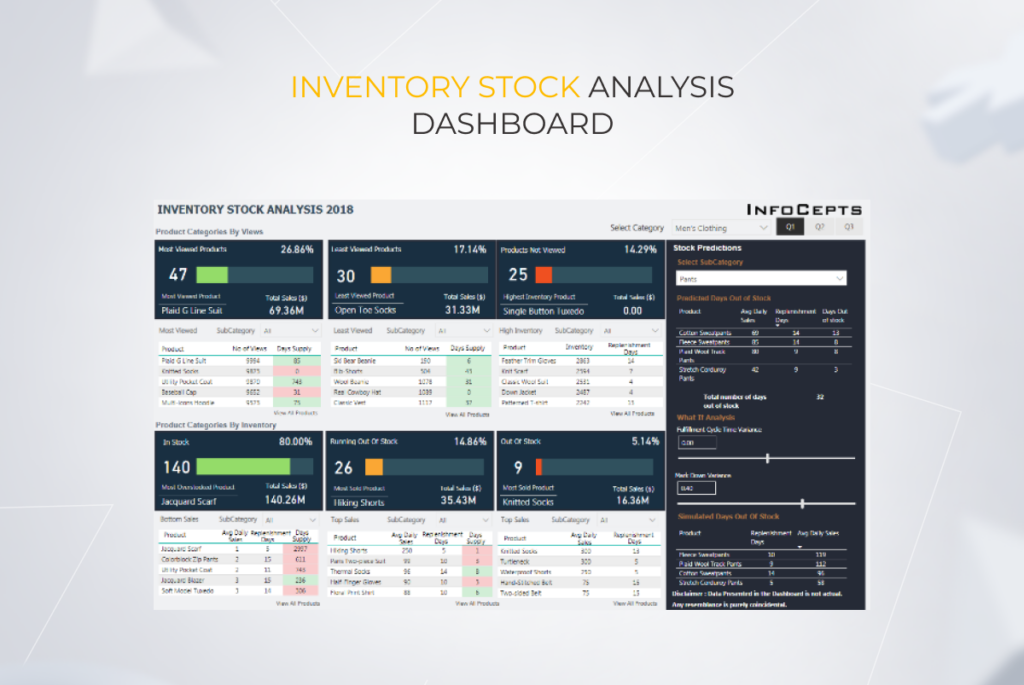
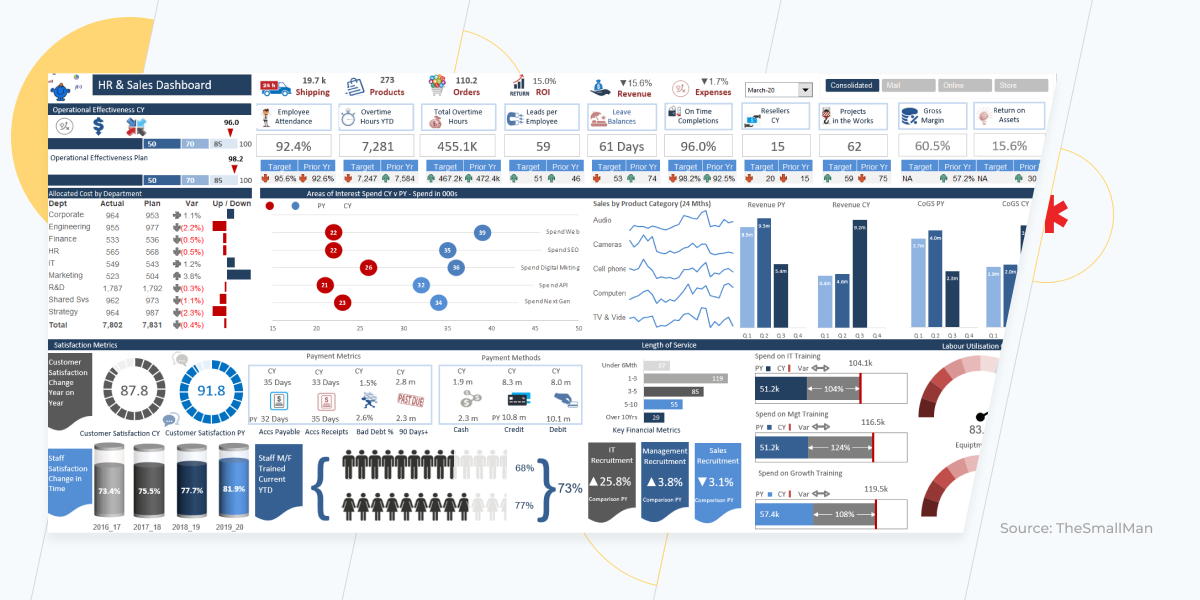
Operational dashboards for employees from different departments include detailed real-time information.
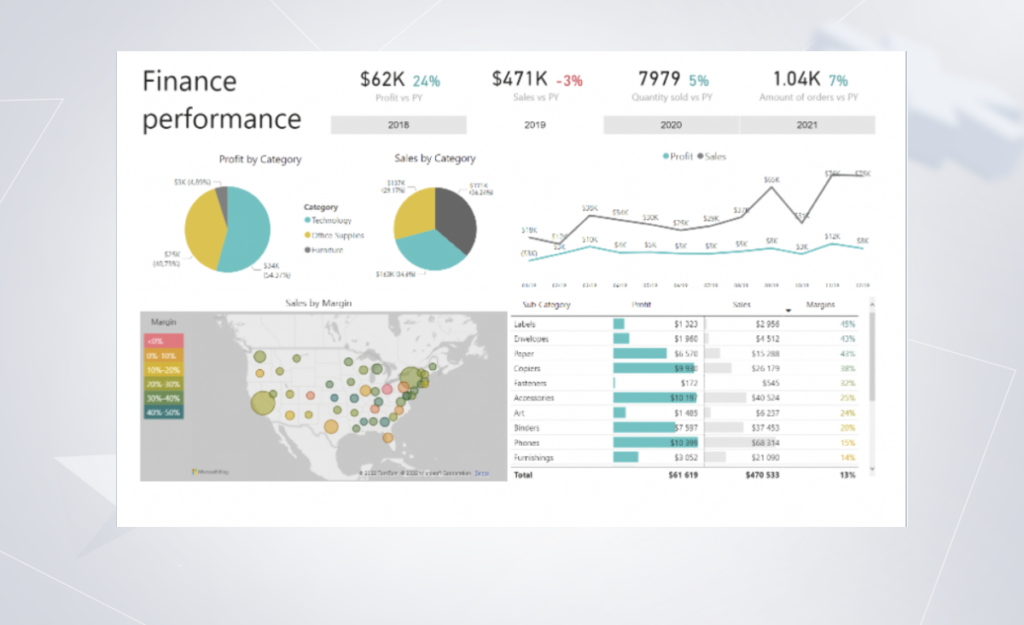
business intelligence strategy

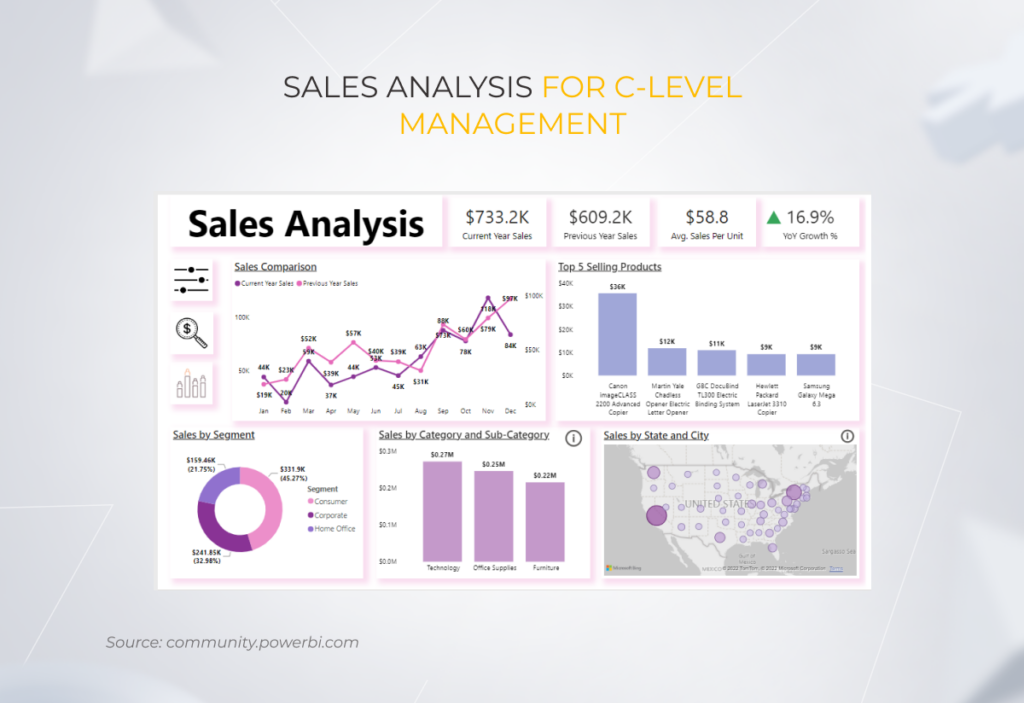
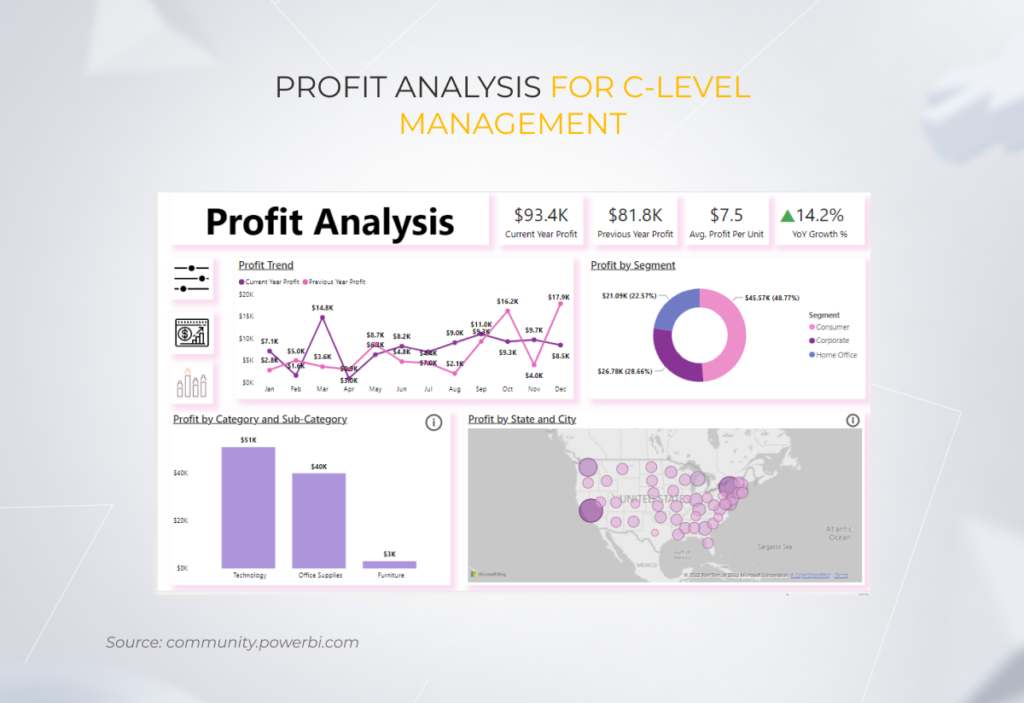
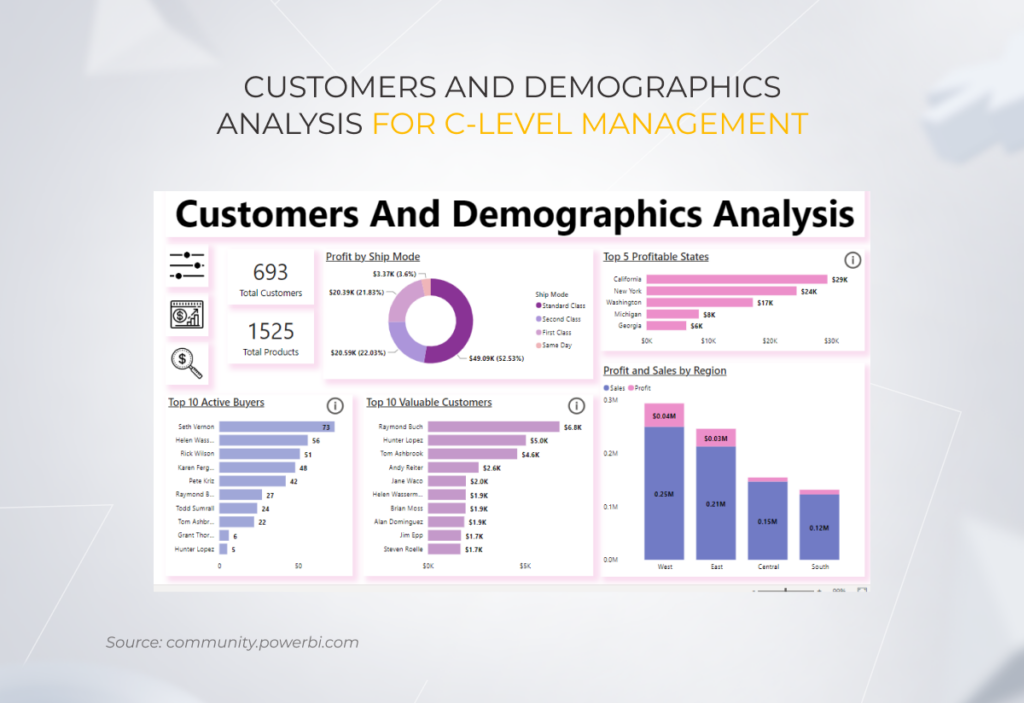
And strategic dashboards for senior-level management include key metrics across the whole organization. 
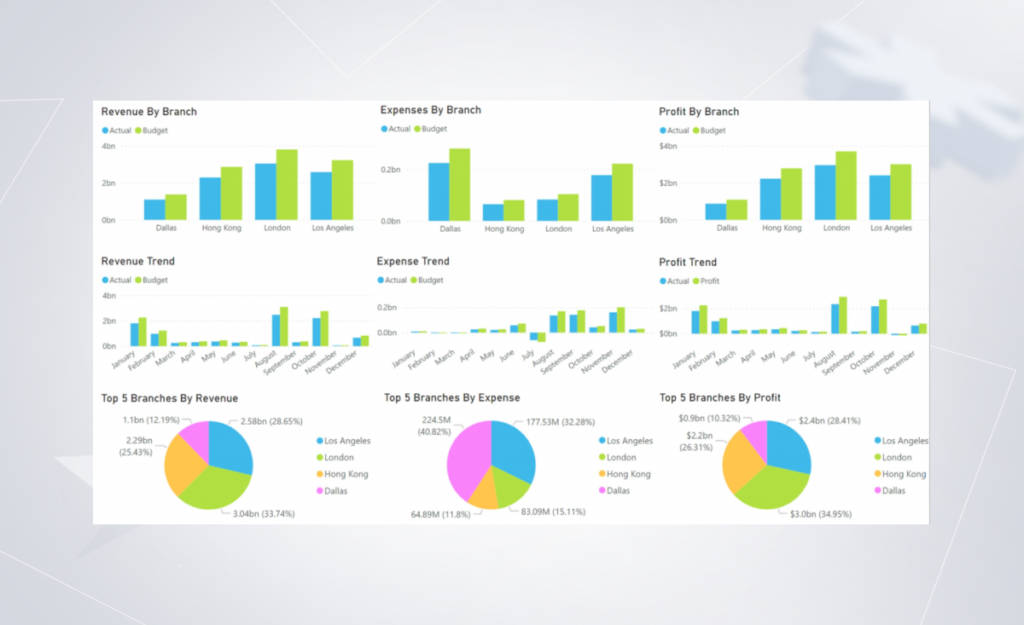
business intelligence strategy

Don’t puzzle over your data analytics pipeline

We’ll help

How we helped a large retailer to increase a turnover by 9%. Spoiler alert: it’s about a logical BI strategy

A well-developed BI implementation strategy empowers you to leverage the technology entirely. Here’s a BI strategy example that allowed one of our clients, a vending machine retailer, to make more accurate decisions faster, keeping up with their business growth trajectory.

The existing solution was inefficient in terms of scalability:

“We never completely realized that we have so much unused data. Only about half of all the data we had was used to make decisions”, says the company’s product and customer experience director.

So how were the carefully designed strategy and the precise BI roadmap developed? 

During the Vision phase, we found that business intelligence could improve several company processes:

  • Finding lost sales
  • Detecting low-margin contracts
  • Monitoring the technical condition of vending machines in real-time

Additionally, the client needed an intuitive tool without limits on how much data they could process. And although Power BI is the most user-friendly tool, it also has a limit of 3,500 data points. Therefore, because of the client’s data volume requirement, we chose Qlik, which has no rigid limitations in the number of data points.

After implementing BI software in accordance with the strategy worked out in advance, the client reduced the number of lost sales by 30%, renegotiated low-margin contracts, and minimized vending machine downtime as much as possible. The confluence of these results led to a 9% increase in total client turnover in half a year. 

For more details on the aforementioned project

download the full case study

Unleash the full potential of a BI system

Ideally, a strategy is developed before any steps are taken to implement the solution. But what about organizations that have already managed to implement the technology themselves, even picked some low-hanging fruit, but then realized that the capabilities of BI could extend much further? 

At some point, users who are not new to BI understand that they can’t unlock the full potential of the technology without a proper business intelligence strategy and roadmap. 

A BI strategy for organizations that already use the technology will include the same basic steps — just like for beginners. It’s just as vital for them to keep the Vision, People, and Process in mind, take care of data quality, reconsider BI tools, etc. However, another thing to pay attention to is emerging. Organizations with self-implemented BI have to constantly extinguish fires that inevitably occur, such as handling backlogs and dealing with issues that popped up after BI adoption and can’t be shelved for later.

One of our customers implemented Power BI for employees of all departments and levels. But ​​over a year, they realized that they were not using all the capabilities of the tool. Therefore, we took action. Working in two directions while establishing the business intelligence strategy, we:

  • Launched in-depth research on the system’s architecture, features, and limitations. It’s a mandatory step to adjust the data storage architecture to the needs of the system’s end users so that employees at any organizational level can independently retrieve the data they need from the data storage and use this information to create customized reports. 

Simultaneously with this large-scale process, we worked with the client’s current tasks.

  • Helped cover ongoing tasks. The customer also had clearly defined tasks, but their in-house BI team was too small and not skillful enough to handle the workload. We tapped into these activities. This way, the client got the reports they needed faster, and we got to know the system’s architecture and the people on the client side so we could pass the knowledge to them.

Planning to develop a business intelligence strategy?

Drop us a line

A comprehensive BI strategy allows you to increase the odds of your BI project’s success

Without elaboration on the Vision, People, and Process areas, you can’t accurately choose the solution architecture or the most powerful toolset for your tasks. Therefore, it’s better to take a holistic approach to implementing a data analytics solution by developing a BI strategy. Also, keep in mind that your BI project doesn’t end with BI deployment. It’s a long-lasting initiative. Your BI software has to evolve constantly as your external and internal conditions change, and new processes, systems, and data appear. To make these adjustments smooth, you need a business intelligence strategy. Without a robust BI strategy that is periodically adapted to the current state of things, it will be much harder to figure out how to move forward.

Need a tech partner for BI strategy, adoption, and ongoing updates?

Get in touch
The Wild West of Open Source Business Intelligence 

Long gone are the days when the market of business intelligence was at the mercy of proprietary BI tools. In 2023, top-flying companies and startups opt for open source business intelligence to supercharge their business resilience. 

The data shows that public BI is on the rise due to its usage among Fortune 500 companies. Nearly all of the most profitable businesses use open source software, and the tech community is heavily backing this trend. On GitHub, there are more than 140 million open source projects.

The high rate of adoption is a result of the advantages that open source BI offers, such as agility, cost effectiveness, and personalization. Nevertheless, like any other technology, it has some potential issues that need to be examined. In this article, we will provide an overview of the risks as well as share the examples of where open source solutions are most suitable.

Three pillars of open-source BI tools

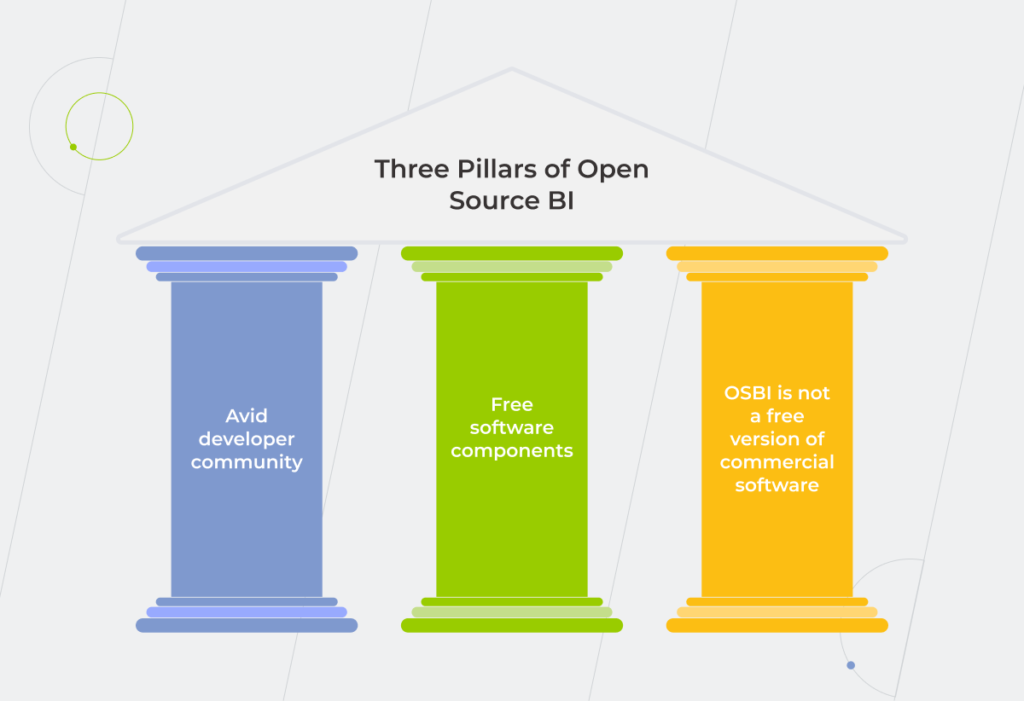
Although non-proprietary software has made significant inroads into enterprise systems, it’s still wrapped in myths. Below, we outlined the main differentiators of open-source BI solutions or OSBI, that separate it from traditional, closed products.

An avid developer community makes business intelligence open source

Transparent BI software is backed by a large community of enthusiasts. These communities don’t have a corporate hierarchy and allow each developer to make their contribution to the open source code. Contributions may include custom extensions, security patches, and others.

Open source BI tools are free. But not completely

Unlike commercial products, public business intelligence software doesn’t charge any license fees to access its core functionality. However, these tools may still bill an additional amount for other add-ons or lack some functionality. That’s why Apache Superset has drill-down limitations in data visualization tools. 

OSBI is not synonymous with free commercial products

Some popular business intelligence companies roll out a free version of their canned BI software. However, a license-free model or a trial period does not make these freebies open-source. Users face different kinds of constraints in free versions of commercial software, for example, Tableau Public.

three pillars of open-source BI

The bright side of open-source business intelligence

Non-proprietary solutions are treasured by thousands of companies and tech-savvy individuals. Just like for-sale products, public business intelligence guides its users into taming huge datasets and generating critical insights.

Here is a breakdown of other unique benefits open source BI software has in store.

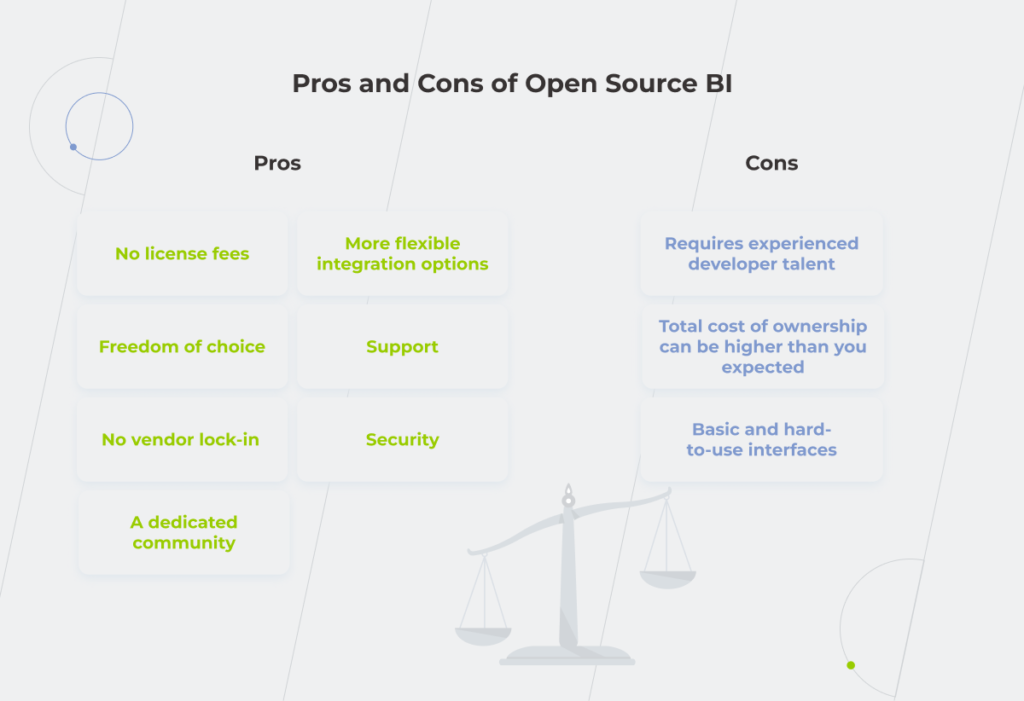
No license fees

Open source business intelligence platforms require little to no upfront investment since they are accessible with no licensing. In most cases, OSBI products offer the core modules at no cost, while additional features can be unlocked for an affordable fee. For example, you can get an infinite number of reports and dashboards, yet your data storage and data connectors will be limited. 

If you already have an in-house team of developers, they can build the needed functionality on top of core modules with no additional costs. In any case, open-source software doesn’t incur the overheads of commercial licensing and offers an affordable takeoff for small and medium businesses.

A dedicated community

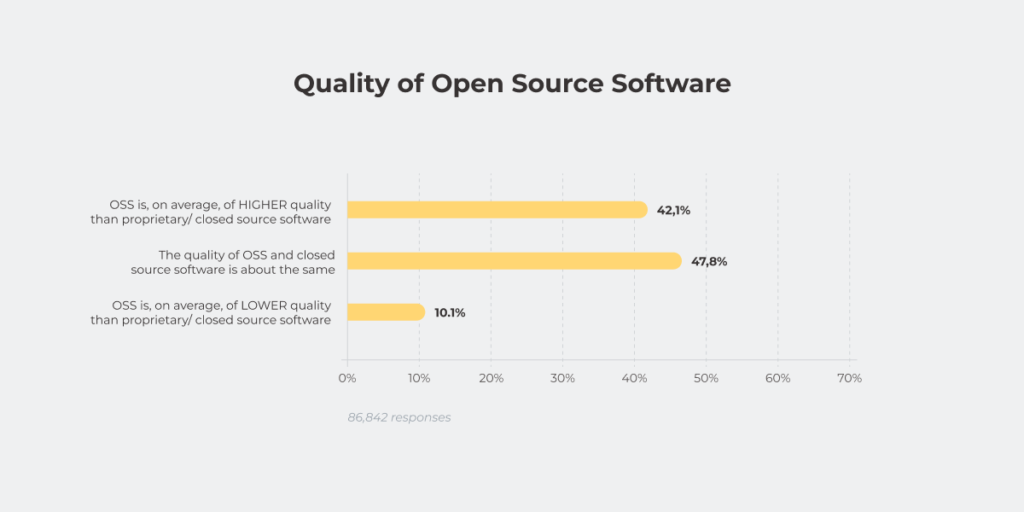
According to StackOverflow, open source solutions often topple or are on par with closed source software in terms of quality. The high quality of open source software is courtesy of a large developer community that is collectively working to enhance the solution. 

open source software

A strong and mature community, in turn, translates into a number of other benefits, including:

  • Faster response to market trends;
  • Faster bug resolution;
  • More consistent release cycles, which equal regular updates;
  • Better reaction to security issues;
  • The diversity of ideas with no bias or lopsided vision.

For companies, it means that it’s not that difficult to find experienced developers. In some cases, enthusiasts can even chip in with a free custom feature for your unique case.

No vendor lock-in

Statistics show that 62% of companies use open source software to avoid vendor lock-in. Open source BI allows businesses to use an optimum set of tools to fit their unique footprint with no price hikes. Most importantly, you don’t need to pay for a package solution from the vendor. Instead, you can get the best of the platform and combine it with the tech stack your company uses. 

Instead of being shackled by one technology, you can test your options and decide on the most optimum one. It also means that you can keep pace with the new transformational trends without costly migration or switchover.  

Freedom of choice

Non-proprietary systems put you in a favorable position to hand-pick each component of your BI solution. While many commercial BI products focus on specific fortes, such as ETL pipelines or interactive dashboards, open sources tend to excel as a solid, full-fledged BI solution. This is a direct result of strong community support and a regular rhythm of new features and updates. 

Thus, your developer team can take out each system component and enhance it or combine it with other functionality. For example, at *instinctools, we use data integration studio and Apache Airflow to set up a custom-built ETL pipeline. At the visualization stage, our BI engineers manipulate visualization components with hand-coded libraries such as D3.js to add funnels, pivot tables, and other custom representations or open source BI tools like Redash or Metabase.

All the benefits mentioned above naturally flow into the power of customization. As developers have access to the core code, they can make changes on demand to better suit their needs. Unlike a closed system that locks users in, open-source allows them to adapt and modify the code to meet a particular need or application.

Therefore, coders can tweak and twist open source software for a unique fit — be it functionality or design — to make it a natural part of any type of operating system for any application.

More flexible integration options

The adaptability of open-source tools allows for integration tolerance to support personal data processing needs. It means that you can seamlessly embed the OSBI solution into your enterprise system, even if it doesn’t consist of open-source components, with no disruption or system changes. Thus, if the rest of your business ecosystem is open source (CRM, CMS, ERPs, etc), you are free to plug them into your open source BI tool to create a blended single platform of data excellence.

Proprietary software, on the contrary, tends to cover a specific set of integrations that may limit your business intelligence. Power BI, for example, sits within the Microsoft ecosystem and integrates naturally within Microsoft products, including Excel, Azure, Access, and others. For instance, we’ve already discussed that you can marry Power BI with Excel to benefit from both tools at once.

Support

Timely and quality support is a must for any business intelligence software, be it commercial or free. However, OSBI tools add a bit more confidence to the business owners if the latter faces an issue or needs a quick walk around. 

Issues are resolved even faster when you have skilled developers at your service. 

Security

The secrecy of your code doesn’t guarantee its security. Instead, making the backend available for the public exposes it to a thousand vigilant eyes. As a result, community involvement accounts for responsible vulnerability disclosures that would take longer to detect if the code was closed.

Moreover, open-source BI software gets faster patches and updates when a severe vulnerability is detected. On average, it may take a couple of days until the vulnerability is eliminated. Open source also fares better for compliance and internal security policies since it’s fully customizable for any regulation.

The dark side of open source BI

Open-source business intelligence may still come at a cost. Below, you’ll find the main downsides of such projects.

Requires experienced developer talent

Ready-to-go technology doesn’t free you from the skill investment. To make the most of open-source business intelligence, you need trained developers who can find their way around it and make it work for your benefit. Improving data quality before loading it into the BI system, adjusting the system to your business framework and maintaining it is also knowledge-intensive and mandates an experienced developer pod.  

If you’re looking for a vetted team of developers that can keep your system up and running, *instinctools provides open-source BI services for companies of all sizes. Drop us a line to get a ready-to-go team of BI experts.

Total cost of ownership can be higher than you expected

Until your BI platform is bug-free and fault-tolerant, it doesn’t need any effort from your side. But once you’re facing an issue, your company is left on its own to resolve it. Therefore, while being free, open BI may still require investment to adjust the infrastructure or eliminate a bug. Introducing extensions is also on your payroll.

Basic and hard-to-use interfaces

Finally, public software is purpose-driven. While it isn’t a bad thing, the user experience of open solutions may not keep up with its functionality. Open source business intelligence doesn’t have a team of UX/UI experts to polish its look. Instead, each community member contributes to the software, which makes it a patchwork, rather than a singularity. 

To improve user experience, businesses can add new design elements or other strategies. However, these modifications will incur additional costs.

pros and conc of open-source BI

This is how we handled an open-source BI project for one of our clients

For 25+ years, our team at *instinctools has been helping global businesses introduce custom data analytics solutions that target their unique needs. Open source BI software is what adds an extra individual touch to our business intelligence services and allows our engineers to sculpt a unique business intelligence infrastructure.

One of our clients, an agency of the federal government, was looking to build a custom business intelligence infrastructure. However, a Qlik-based solution, which had been initially offered, didn’t meet both the technical and budget requirements. A ready-made analytics platform required significant upfront investment and an in-house IT department to manage the solution. Moreover, a commercial solution didn’t cover the user’s needs and experience at a given destination.

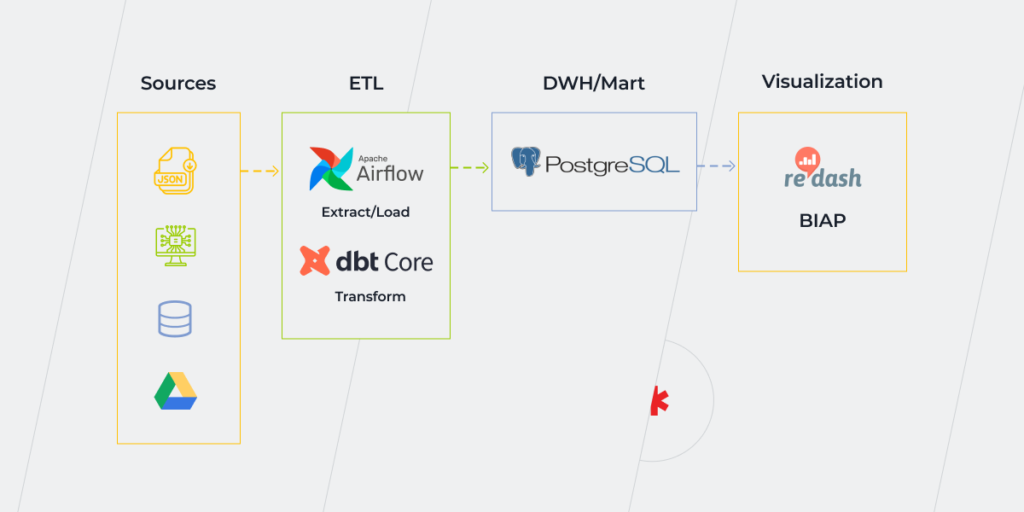
To eliminate these challenges, our BI engineers suggested a get-started BI infrastructure that covers the individual needs of our client. Our team came up with the following plan to accommodate the data needs of this client:

  • Postgres – as an open-source data storage;
  • ClickHouse – as an open-source data storage system for large data analysis;
  • Apache Airflow – for building a robust ETL pipeline and orchestrating the ETL workflow;
  • Python – as a core data processing technology for an ETL pipeline;
  • Redash – as the main data analysis and visualization tool for in-house data scientists;
  • A custom-made application that generates reports for other user groups.

The open-source component in this custom BI setup helps our client to manage and maintain the solution with no additional effort. It also means that our client can easily find a team of engineers to support the infrastructure.

open source BI

Who benefits from open-source BI the most?

Although open data intelligence solutions seem like a go-to option for all verticals, some industries and user groups will reap more benefits from integrating them into their ecosystem.

SME and start-ups

Virtually any small business is looking to avoid financial drains to optimize its sales revenue. Public BI software helps SMEs and startups get value for money and is easy on their budgets. As small businesses usually have limited in-house tech support, community support of OSBI is also the wisest approach to troubleshooting.

Consulting agencies

Software consulting companies are among the regular users of BI open source. The latter allows companies to speed up development for their clients. As consulting agencies also have experienced developers on-site, they can easily adapt the solution to individual requirements.

Companies operating on legacy software

For some organizations, the hassle of software migration isn’t worth the trouble as they are more focused on their business than on the tech components. Typically, it’s the government or finance verticals that rely on a tried-and-true infrastructure. Thus, no matter how edgy the solution is, it won’t bring them any ROI or business value.

Open-source analytics tools, on the contrary, will still help them adapt to the new reality with no switchover or much budget allocation.

Organizations that seek automation and connectivity

Companies that may benefit the most include those using Internet-of-Things-connected devices, autonomous vehicles, and consumer products as well as retail, manufacturing, and industrial applications. Overall, any industry that needs a consistent and 360° data view can easily integrate the OSBI into the existing infrastructure.

Summing up, public BI strategy can benefit anyone who has specific data needs but lacks either time or money to build a full-fledged platform. 

Your shortcut to data supremacy

Staying on top of your data is a mandate in 2023 to make informed business decisions. But despite a widespread opinion, business intelligence doesn’t have to be a pricey undertaking. Public BI platforms enable companies to drive data efficiency without large investments or huge technical dedication. 

Being a go-to option for SMEs and startups, open-source BI solutions can both invite data consciousness at the early stages of a BI journey or become a highly customizable business asset for existing infrastructure.

Ready for a takeoff?

Get a free consultation now

The Role of Business Intelligence in Digital Transformation: How Advanced Analytics Supports Your Business Remodeling

What is the impact of business intelligence in digital transformation? Given the sheer volume of disparate unstructured data that modern organizations have to deal with, you’ll need some technology to enhance data quality and speed up the delivery of valuable insights for your strategic and tactical decisions. Business Intelligence (BI) can become one of the drivers of your transformational efforts. 

In this article, our expert reviews how BI can help you create the right conditions for achieving the ultimate goals of digital transformation, such as agility, resilience, efficiency, and transparency. Explore BI technology and discover real-world examples of how it transforms data into profit.

What elements of digital transformation can be entrusted to Business Intelligence?

A fundamental component of any digital transformation is making well-informed decisions and tracking the impact they have on your business. This is exactly what BI in digital transformation is responsible for.

  • Enhanced quality of information 

Huge data volumes aren’t of much use in their raw form. To clear the way for accurate data analysis, you first need to take care of data quality. Business Intelligence involves ETL processes when you extract structured and unstructured data from various channels, transform it according to your business rules to get standardized sorted data, and load this information into a unified repository. Only then is the data suitable for use in analytics tools, such as Power BI, Tableau, Qlik, etc.
Forming an integral part of business intelligence platforms, ETL processes can be also built as part of an open-source BI project, amplifying the quality of your data at an affordable cost.  

BI in digital transformation
  • A holistic view of an organization’s operations in real-time 

Besides grasping large volumes of information in the blink of an eye, you can uncover hidden patterns that would be barely deciphered from numerical data. Moreover, these improvements can be implemented across the entire organization with custom dashboards for each level of decision-making. Staff from different departments will benefit from the operational dashboards with detailed visualizations of their current activities. Analytical dashboards can save a lot of time for department leaders by providing them with a comprehensive overview of crucial data by periods and categories. Well-honed data analytics sharpens your business acumen, helping you make pivotal decisions, like setting the right prices. Meanwhile, C-suite members can rely on strategic dashboards with key statistics when making fundamental decisions. 

  • An opportunity to track whether you are moving in line with your business strategy

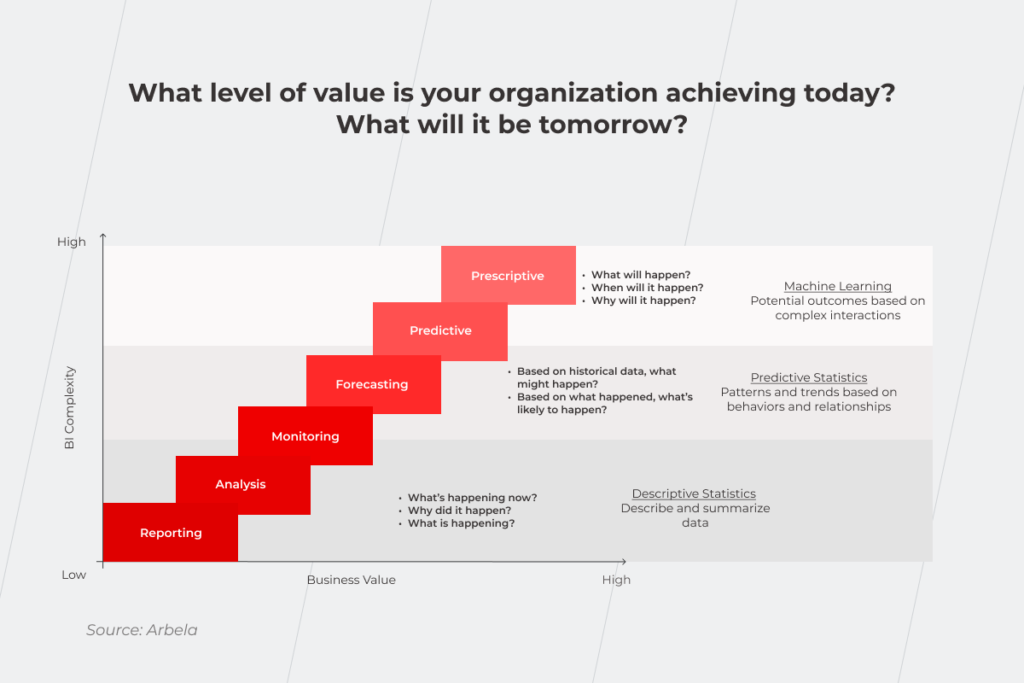
With its basic functionality, Business Intelligence in digital transformation is responsible for reporting, analysis, and monitoring. It helps you answer all-important questions such as “what is happening?” and “why did it happen?” Beyond that, coupled with Machine Learning (ML) and Artificial Intelligence (AI), BI is extremely beneficial for forecasting, predictive, and prescriptive analytics to get responses to “what might happen?” as well as “when and why will this happen?” Making predictions based on historical data, patterns, trends, and complex interactions, your system serves you as a dead-on fortune-telling ball.

BI in digital transformation
  • Improved customer experience

When all the data about your customers from your website, CRM, social channels, etc., is gathered in a single location, it’s easier for you to analyze, segment, and target various customer groups. That way, you can enhance customer relationship management and increase customer satisfaction. 

Moreover, adopting BI in digital transformation allows you to avoid wasting time analyzing data manually. The system handles it for you. Therefore, the information is available ad-hoc – you don’t have to wait for the weekly or monthly reports and can make decisions immediately. Your employees don’t have to waste their time on the operations that can be entrusted to the technology and can dedicate it to more responsive customer service.

BI in digital transformation

Want to get actionable information on time to make well-balanced business decisions? Transform data into value with Business Intelligence consulting provided by our team.

Want to get actionable information faster to make better business decisions?

Transform data into value

Real-life examples of how BI transforms data into actual profit

Business Intelligence is a heavy hitter that empowers you to follow your digital path and become a data-driven organization. It sounds great in theory, so let’s see how the technology works when you put it into practice.

Imagine that there’s a chain of gas stations. Not only is the fuel itself a source of income, but the sales of related products can generate significant revenue as well. However, without proper data analysis and visualization, it’s easy to overlook this potential as the organization doesn’t realize how much data it has and, more importantly, how it can be turned into business-oriented information. Having a clear idea of how much fuel people tend to fill up per visit, how frequently they come to gas stations, etc., you can target promotions more accurately. For instance, if your customers fill up at an average of 6.5 gallons, you can offer a promotion “Fill up at 7 gallons and get a free coffee”. Also, accurate and timely data analysis can uncover what services should be added to the existing ones to increase the average check or the number of customers.

The way we capture, transform, and analyze data determines our decision-making velocity. Making the right decisions faster becomes extremely important when it comes to human lives. That’s why, using BI technology in the healthcare industry provides an opportunity to improve medical services and patient care. 

At the beginning of the COVID-19 era, when the whole healthcare system was in a shake-up and had to really transform its approach to patient care, we created a BI solution for hospitals. The point was to analyze the staffing levels of the hospitals and check available places, ventilators, etc. To keep the intensive care unit running non-stop, you should calculate the number of resuscitators per unit, considering how many patients one can take care of. Data on available doctors was crucial, given the rate at which the number of patients was increasing. 

How have we, with the help of BI, made it possible for hospitals to cope with such a workload? We collected primary data on available doctors and put it on the map so that there was an understanding – if a hospital has extra resuscitators, it can send one of them to a hospital that lacks these specialists. This way, you can quickly reallocate resources while considering the distance between hospitals since doctors are humans after all, and they get tired too. 

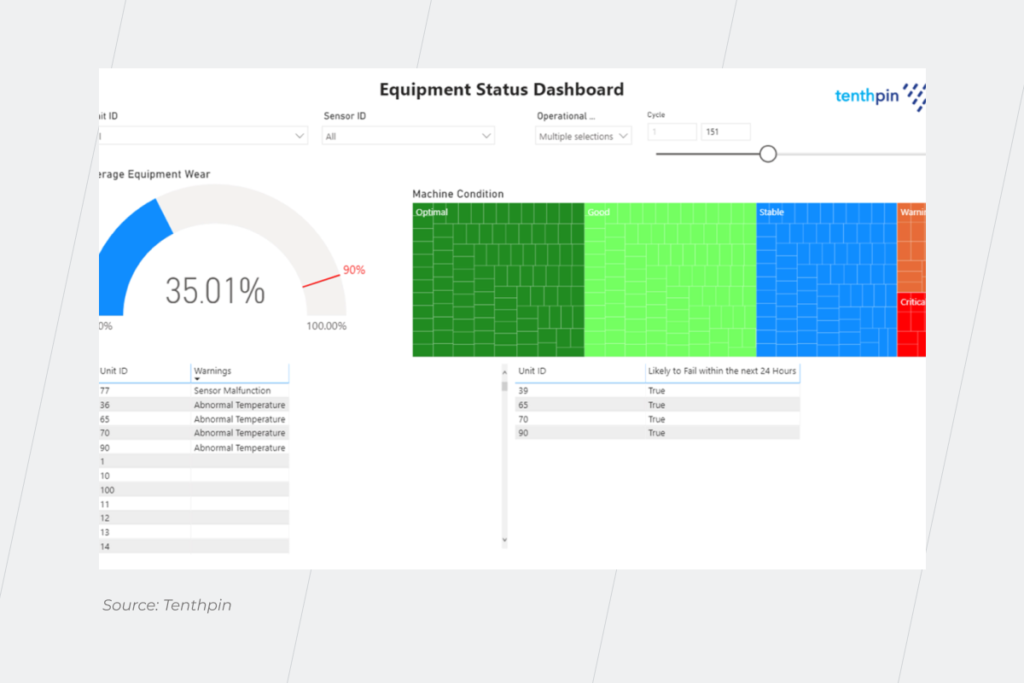
BI can help track not only the people’s condition but also the state of mechanisms. An example from the manufacturing industry proves this. You can leverage BI for predictive maintenance. If you couple the technology with the Internet of Things (IoT), you’ll be able to analyze sensor data such as temperature, the vibration of your machinery, etc. With this data, you uncover even minor issues and fix them before they become severe problems that can cause downtimes. From that standpoint, BI is a way to unlock the pleasure of working with a minimum of accidents.

BI in digital transformation

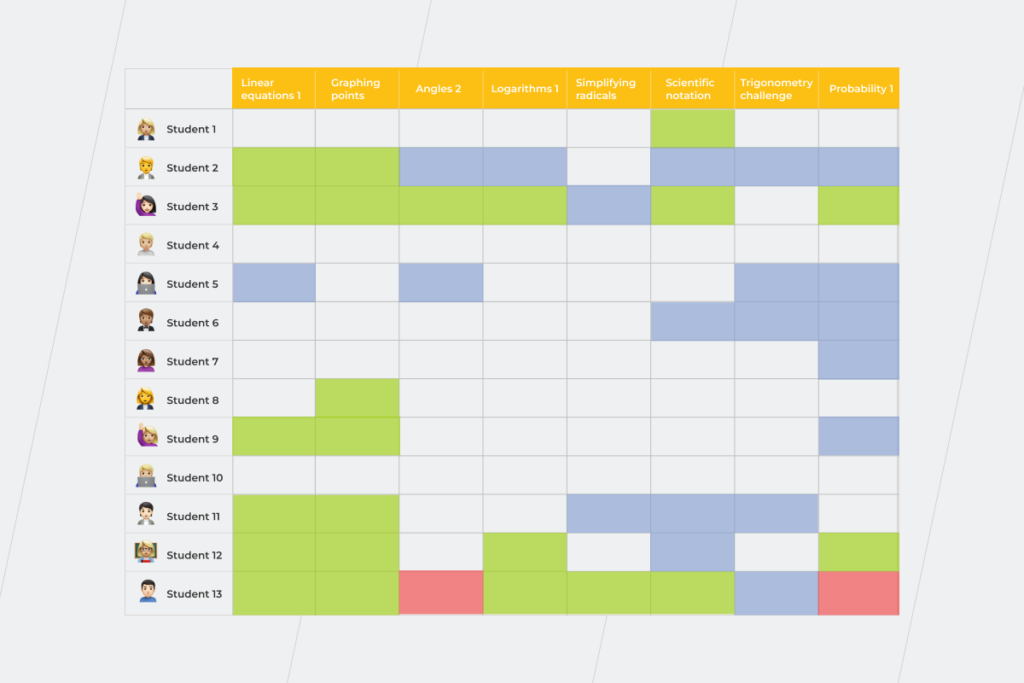
Digital transformation is especially urgent in industries that haven’t changed in a long time and are craving for reinvention. One of these is education. You can take advantage of BI to create personalized experiences for the students instead of a one-size-fits-all approach. How does it work in practice? Teachers can be empowered with custom interactive dashboards that show their students’ academic progress. 

Here’s an example from our guide about EdTech trends that shape the future of education:

BI in digital transformation

On this dashboard, you can see and assess the progress of any student in one discipline. Green columns mean that the student has mastered the topic perfectly, blue identifies students who need to refine and consolidate the topic, and red marks denote underachieving students. With technology support, you can spot gaps and issues in time to help students achieve their best. 

BI is full of outstanding capabilities with each bringing value on its own. By simply monitoring the actual state of what’s happening within your organization, a BI system helps uncover anomalies that you’d like to know about before they hit your wallet. Before the implementation of BI software, one of our clients, a tech retailer that sells devices, once mispriced a category of items on the site by charging $1 instead of $100 for them. As the sales data was analyzed once a week in spreadsheets, the problem was identified later than it should have been and hit the company’s wallet hard. If their data was organized conveniently enough and checked daily, they would notice that the average price of the product had dropped drastically and that would have prompted further investigation.

Be proactive: what to start with?

Implementing technology on an unprepared basis is like stacking bricks on top of bare ground, without a foundation, in the hope that you’ll end up with a livable facility. Just as it doesn’t work for construction, it’s not an option for business either. To make use of the Business Intelligence part in digital transformation, the core processes in a company should already be digital and stable. What processes are considered to be core? It depends on the industry that your company represents. For example, for healthcare, it might be patients’ scheduling, for banking – lending and mortgage operations, etc. They have to be in your system in a digital form, not on paper. So, before rushing into advanced analytics, you first might leverage RPA technology for end-to-end document processing.

It is also crucial to standardize the basic functions of the organization. For example, a medical company that deals with patients should have a standard digitized process for making appointments, etc. 

The fundamental point is that until there are no standard processes and data in a digital format, the technology has nothing to analyze and visualize. Hence, you can’t wrap large volumes of data efficiently. 

If you want to benefit from custom dashboards but can’t identify core processes that should be automated, or have other questions about the stages that precede digital transformation, take advantage of the dedicated team’s expertise.

Fuel your digital transformation with qualitative business analytics

To succeed in digital transformation and build a data-driven organization, you should organize processes around customers and technology around data. Technologies such as Business Intelligence improve the quality of data and, therefore, the quality of decisions that fuel your business. BI offers easy-to-grasp dashboards and provides a transformative speed to business insights. 

Reach out to our experts to discuss your perspectives on leveraging BI during your digital transformation journey. 

10 Business Problems BI Automation Cracks

What opportunities become available to you with business intelligence automation in place? Extracting value from diverse data sources leads to increased customer satisfaction, better staff engagement and productivity, minimized number of human errors, and more. However, utilizing the full potential of BI is possible only when it’s married with a robust automation strategy. 

The rapidly growing demand for automation among the leading analytics platforms proves the point. For instance, a famous analytics vendor, Tibco, was about to merge with Blue prism, a pioneer among RPA vendors at the end of 2021, while Alteryx partnered with UiPath, a company that also delivers an RPA-based platform. Automation is now viewed as not only a facilitator of the repeated processes but also as an essential part of insight delivery. So whether you’re at the beginning of your journey to a data-driven organization or you’ve been leveraging BI for a while, here’s a list of problems that BI automation can help you solve.

1. An inefficient process of discovering and ranking insights

Extracting and ranking data-driven insights manually is quite an exhausting process. Besides, it steals precious working hours that your team could dedicate to more important tasks.

The implementation of BI dashboards is a wise step for organizations overwhelmed with data. It can help them avoid wasting time and human effort and streamline workflows overall. Apart from uncovering actionable insights in real time, automated tools enable users to prioritize them, thus contributing to smarter decision-making. 

Speaking of the opportunities BI automation entails, healthcare is a vivid example of an industry that craves them most. Producing tremendous amounts of data, medical organizations often face the challenges of handling loads of heterogeneous data with a limited number of employees. They might find themselves confused on how to implement high-end software in a clinical setting.

Thus, medical organizations can become more proactive in exploring trends and demographics by using the clustering feature in Tableau. The solution helps to define statistically similar groups based on the indicated attributes, for example, rank insights on pediatrics and compare short-stay patients to the extended-stay ones.

2. Poor data quality

When processing large volumes of data, it’s too hard to overcome the human factor and detect every single error on the spot. Sacrificing data quality can cost you a lot as this leads to large financial losses, a damaged company reputation, inaccurate targeting, uninformed decisions, among others.

Specifically, poor data can affect sales and marketing pipelines. If your mailing lists lack “hygiene”, have wrong contact information, or include addressees who have already unsubscribed, you are likely to have extremely high churn rates and lose potential clients.

In this regard, data preprocessing becomes a big deal in a struggle for accurate and reliable analytics. However, data scientists often fail to perform thorough preprocessing due to the acute lack of time. The use of platforms, such as Microsoft Power BI, can eliminate the need for repetitive manual data cleansing. With the help of Power Query Editor, you can automatically identify and remove duplicates, missing values, or errors, thus waving goodbye to another obstacle to the overall company’s productivity.

3. Analyzing data from disparate systems

Some companies can’t keep pace with digital transformation and fall behind in migrating from legacy systems to more modern ones. A recent survey by CIO Insider revealed that an average IT department across all industries spends about 55% of its technology budget on maintaining existing infrastructures instead of building new innovative capabilities. In this way, legacy systems become a heavy burden as their expensive maintenance and lack of integration with modern ecosystems hold back a lot of organizations.

Business Intelligence automation, in its turn, effectively streamlines data flow from one system to another and helps to collect data into a single source of truth. Additionally, automated solutions simplify structuring content to get it ready for analysis.

4. Limited access to information due to dependence on technical staff 

Though having unimpeded access to data for all teams within an organization seems a sure thing, it doesn’t really work this way in practice. In most cases, legacy systems simply lack flexibility and require the participation of data scientists to derive data-driven insights and distribute them to all levels of the company.

Applying a BI toolset greatly contributes to the democratization of information. The use of cloud databases like Azure or Google Cloud empowers users without deep technical knowledge to access any information in the company’s warehouse and convert data into a convenient format for quick sharing of the important content through corporate channels independently from an IT department.

5. Poor customer experience

Most businesses aim at providing a better customer experience, but very few really succeed. The reason is random guesswork, as confused managers often base their conclusions on insufficient or unreliable data. All this leads to the promotion of the wrong goods, services, or features, resulting in unsatisfied customers.

Why is BI automation a win-win scenario in this case? It hardly needs saying that communication is the key. Customers themselves know what they want. In this regard, collecting feedback with interactive in-app or online surveys and tracking customer behavior on websites are forward-leaning steps on the way to understanding customer needs, being more responsive to market changes, and increasing revenue.

6. Manual data entry

Given that manual data entry is a time-consuming routine process prone to errors and typos, it’s not a practical option for most companies. Whether you need to capture personal information from a CV for HR purposes or extract important data from invoices for an accounting report, automated OCR-based software can successfully optimize these tasks.

Such solutions help to automatically pull out data from varied resources, including PDFs, photos, or websites, and deliver it in a structured visible format in several clicks.

Is the implementation of automated BI among your priorities for 2022?

Learn More

7. Manual querying

Instead of wasting employees’ time on searching and summarizing information, automated solutions gather data from multiple sources, generate reports and present them on schedule, without the need for human effort.

Giants like Netflix and TLC have embarked on their automation journey and their achievements inspire others to do the same. Specifically, TLC claimed its productivity increased by 25%, while Netflix manages to save 50 employee hours daily by leveraging automated reporting solutions.

Recently, our team also helped a media-services provider to optimize the decision-making flows by deploying self-service BI. The implemented solution freed up business users from cumbersome report generation, saving approximately 280 hours per month and increasing customer satisfaction by 85%.

8. Having no idea of what your competitors are up to

Today’s highly competitive business landscape makes companies struggle for their position more than ever before. As they say, forewarned is forearmed, and BI automation should become your major weapon in tracking performance.

While Ahrefs and Semrush can help you find your competitors’ keywords, Google Alerts will timely notify you when your rivals are mentioned online. Detecting and analyzing the key performance metrics with smart BI automation tools will keep you updated about the market situation in real-time and reveal if you are at risk of being out of the running. 

9. Low employee productivity and engagement

Nowadays, employee burnout is spreading almost as fast as the COVID-19 pandemic. The findings from recent research by Deloitte indicated that 77% of employees face the problem of burnout at their current workplace. Apart from working extra hours and lack of vacation time, respondents also mention unclear job expectations and lack of workplace communication as the reasons.

Keeping the staff motivated can be solved by Business Intelligence automation in several directions:

  • As BI dashboards visualize important metrics and provide important statistics, they can be used as tools for keeping employees informed about the company’s mission, vision, and priorities. A transparent information flow creates a sense of engagement and belonging to common goals.
  • In terms of personal performance, BI dashboards are useful assistants as well, enabling employees to easily access all the needed metrics and identify areas for improvement with a click of a button. Such analysis empowers the teams to have a clear understanding of their strengths and weaknesses, better identify priorities and improve in-house communication, thus avoiding overloads and minimizing the risk of burnouts.

10. An overworked and overwhelmed HR department

The COVID-19 pandemic affected the way businesses get the workflows going, and HR departments were among the first to adapt to the new circumstances. 98% of HR leaders highlight that they have experienced significant transformations in their roles and responsibilities throughout the pandemic.

With automated BI, recruiters can gather data about past, current, and potential employees in one place to successfully assess employee strengths and weaknesses, track performance, offer relevant professional courses, motivate the staff, prevent conflicts and burnouts, and a lot more.

Automation unleashes the never-before-seen power of Business Intelligence

Business Intelligence is a valuable asset and critical ingredient of every operational field, regardless of the organization’s size and domain. It ensures that you won’t miss out on any meaningful data insights and put decision-making on a higher level. However, only automation makes the mission of BI a reality. At *instinctools, we’ve helped hundreds of business users to apply intelligent automation and make their BI adventures intuitive and secure, ensuring productivity and prudent use of resources.

5 Challenges in Implementing Big Data Analytics Based on Our Client’s Experience

While well-informed decision-making makes all the difference, it comes with certain data analytics challenges which, if ignored, put your efforts at risk.

As data analytics has become increasingly more influential in the business world, organizations everywhere consider it the main objective. In turbulent times to come, it is vital to get a comprehensive image of how an enterprise works and how its resources are allocated. However, in order to make the most of your data, certain issues have to be addressed, or else the data analysis process can be impeded. 

This article will focus on the biggest challenges in data analytics. Here, our customer’s experience is used to illustrate the obstacles on the way to insights, with advice from our business intelligence consultants on how to handle them.

The scary five of big data analytics

Our client is a fashion retailer looking to get their data initiatives across the goal line. However, the company’s digital transformation was put on pause as it struggled to get hold of the right data management strategy and BI tools. 

Here are the challenges highlighted by our client and the pro tips to solve them suggested by our experts.

1. Inability to define user requirements properly

The company in question has been dabbling into the potential of BI tools and data visualizations for a long time. However, our client had no hands-on experience in business intelligence, and so, couldn’t accurately define BI requirements. 

With a requirement brief on hand, it would be easier to suggest a technological solution. But our BI specialists did an amazing job analyzing the business needs and making the most accurate technical adjustments in accordance with them. Essentially transforming their demands into clearly defined objectives. 

Pro tip: If you are new to the BI ecosystem, make sure to get professional advice from an experienced technology partner. In this case, your vendor will do the heavy lifting of requirement elicitation, while you can choose one of the suggested technical solutions.

Challenges in Implementing Big Data Analytics

As it turns out, our client also struggled to communicate the requirements because they did not have a focus area to start with. Instead, the company was trying to encompass each aspect of business performance, from revenue to inventory turnover, and squeeze all the KPIs into one all-in dashboard. While it is certainly possible, the miscellany of metrics makes your reports less digestible.

Pro tip: Start small by identifying a few core metrics to track and visualize. By going with one functional area at a time, you increase the odds of a more successful and consistent BI adoption process and eliminate the lion’s share of data analytics challenges.

Challenges in Implementing Big Data Analytics

2. Carrying out system changes without considering the impact on data of other departments

In most cases, it’s not enough to map out the KPIs for analysis and tracking. For cross-functional teams, it is also important to first clarify and define what these metrics mean. As departments may do calculations in different ways, a shared understanding of KPIs and their calculation prevents the discrepancy in the value of the metrics.

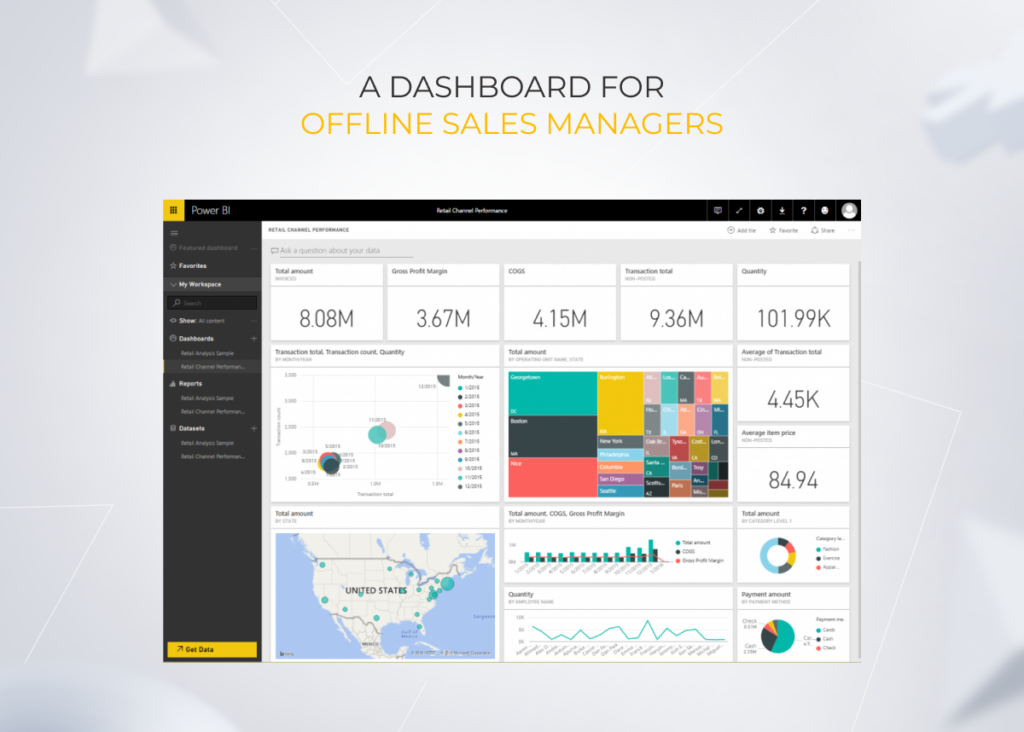
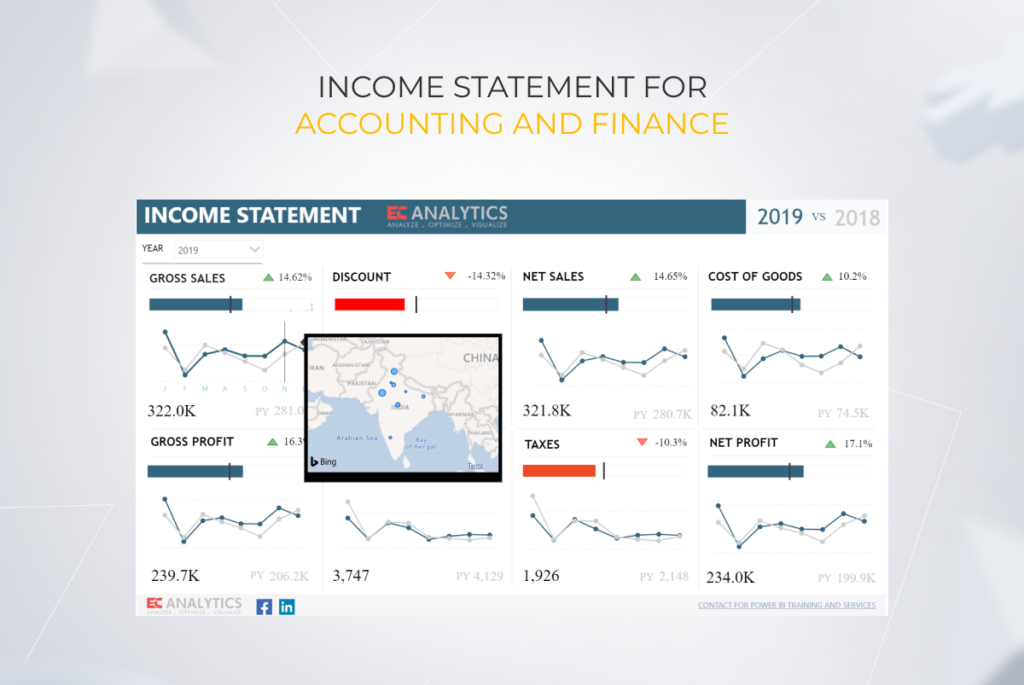
On this line, our client’s another data analytics challenge was the different perspectives on the same metrics across business departments. As such, offline sales managers viewed the sales revenue as everything earned from the sale of the clothing, including the VAT charge added on top. Conversely, the accounting and finance department uses the net revenue of both online and offline sales as the core metric. 

Our team has eliminated this knowledge-sharing gap by introducing a glossary of KPIs for decision-makers. This way, each department gets a fix on the metric in use, associated data sources, and the metric formula. Decision makers also set personal ownership of each performance measure and assign a dashboard owner within a department for a given metric. 

Pro tip: Make sure you have selected the right metrics to display and are fully aware of how KPIs end up in executive and operational dashboards. Consider using separate dashboards for each department to avoid metric ambiguity and overlapping.

Challenges in Implementing Big Data Analytics

3. Lack of a unified corporate picture

While each business unit should get a detailed view of internal metrics, CEOs need a more high-level overview of business performance. A high-level snapshot provides a bird’s eye view of company performance and its bottlenecks. This may be done by providing an executive summary of the top KPIs across business units or by providing high-level reporting dashboards for each department in the company.

The metrics included in an executive dashboard vary by industry and company. Retailers might want to keep tabs on profit and revenue per square foot, logistics costs, profitable marketing channels, top-grossing items, gross margin return on investment, and other vitals.

As for our client, the company needed a unified monitoring report that sources and consolidates predefined values on a company’s performance. The dashboard should offer a quick health check with the possibility of drilling down into a particular metric. As for variables, our client went with three separate screens for sales analysis, profit dynamics, and customer data that demonstrate the YoY (year-over-year) growth.

Challenges in Implementing Big Data Analytics

Pro tip: Bring metrics by a specific department to a common view needed for executives to act on. An executive dashboard should include core, high-level metrics that can be used for a unified business strategy language.

Achieve a unified view of your business

Consult our BI team

4. Collecting meaningful data to the agreed standard

Around 95% of our clients think that it’s enough to compile each piece of business data, send this hoard to the BI tool, and call it a day. While it would be a perfect scenario, in most cases, companies are inundated with scattered data sources that lack administering. This is a textbook example of data management gone wrong.

What are the challenges of data analytics in this case? In the absence of the right data architecture, modeling and administration, your data quality does not stand a chance of producing remotely accurate and meaningful insights for decision-making. As a result, 77% of companies struggle to derive high-quality data, which leads to distrust in the organization’s data and analytics.

Challenges in Implementing Big Data Analytics

Pro tip: According to our big data experts, the issue of data quality cannot be solved at the analytics level. It should be eliminated by introducing a unified data management strategy within the organization. A business intelligence tool can then be used as an acid test for your data quality.

Getting back to our client, the organization had the same problem of missing data values, incomplete input, duplicates, and other snags. Moreover, the company did not have the integration architecture to share information between various subsystems automatically. 

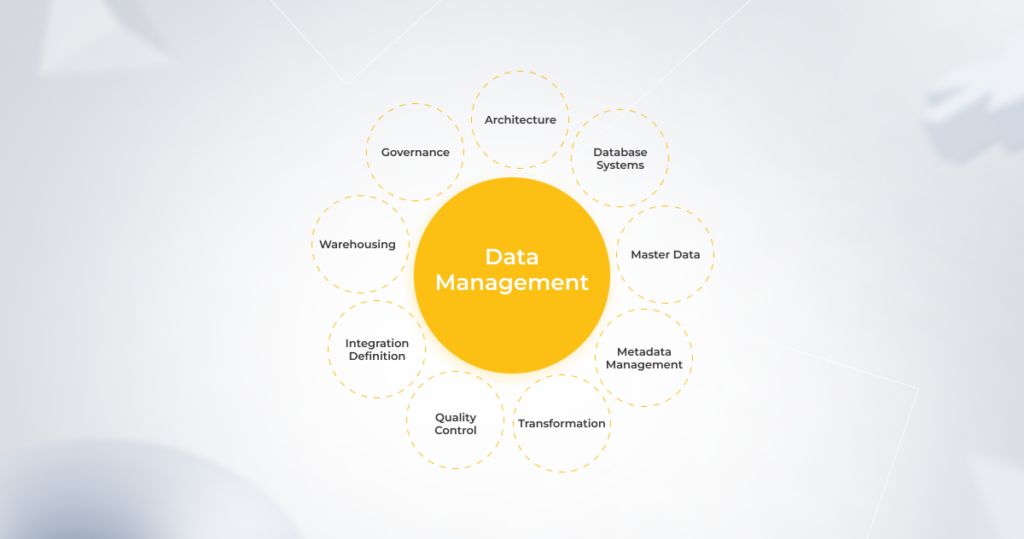
Our team advised the organization on the best practices of collecting, storing, and transforming their data as well as took over the technical aspects of seamless data sharing between the business systems. Our data engineers identified the source of master data within each business unit (CRM, ERP, and others), selected the right data model, and calibrated the sharing process between master sources and data warehouses. 

Whip your data management in shape

Get a free consultation now

5. Staff resistance to adopting a new system

A low adoption level of BI among your employees can also become a significant roadblock to your data analytics efforts. Currently, the ceiling on analytics adoption among its end users stands at an average of 25%, while others favor traditional spreadsheets or gut-based predictions. 

The root cause of this problem can stem from low-level skill training, the complexity of a BI tool, or the fear that automation can displace an employee. Each type of rationale should be approached individually, while the overall value of a reporting system should be clearly communicated and demonstrated to each employee. 

At first, our client struggled to get employee buy-in on having Power BI as an analytics standard. The main reason for the aversion among employees seemed to be people’s natural resistance to change.

Following the unique user needs of each business unit, our BI specialists have adjusted the interfaces to the specific department. The onboarding was followed by internal workshops for each department and facilitated by creating documents with guides on the tool.

Based on our tried-and-true experience, we know that any business transformation initiative, including big data analytics implementation, brings the most value only when process optimization, the deployment of cutting-edge technologies, and cultural shifts in people’s minds move towards each other, not further apart.

Pro tip: Low business intelligence adoption is inevitable if you neglect the role of the people involved in your processes. Build a BI interface with the end user in mind and ensure a smooth take-off by setting up single onboarding training.

Navigating your company through data analytics challenges: the easy way

Just like every house is built on solid ground, insight generation is built on a data foundation. Ironically, data itself is one of the biggest challenges in data analytics that can cripple your BI management and lead you to the wrong decision.

We helped our client to realize the full potential of data analytics and use it to their advantage. By having a unified data architecture and the right technology footing, the company can now get a real-time view of core business operations and act on the data to grow, innovate, and adapt to the fast-past retail market ahead of the competitors. 

Get your data analytics right

Contact our data experts

Automated Data Lineage: Remove Chaos From Your Data

Impeccable data quality and accuracy are deemed vital precursors in the quest for data-driven decisions. This strategic reliance on information leaves no room for error and places input transparency at the heart of the data management process. Automated data lineage is what gives you confidence in your assets and helps eliminate any errors throughout your data flows.

Data lineage tools allow companies to look into the “what”, “when”, and “where” of their data. They give the full context to the final insights, be it the input source or the evolution cycle. Let’s see what else this data-related practice can bring to the table.

What is automated data lineage?

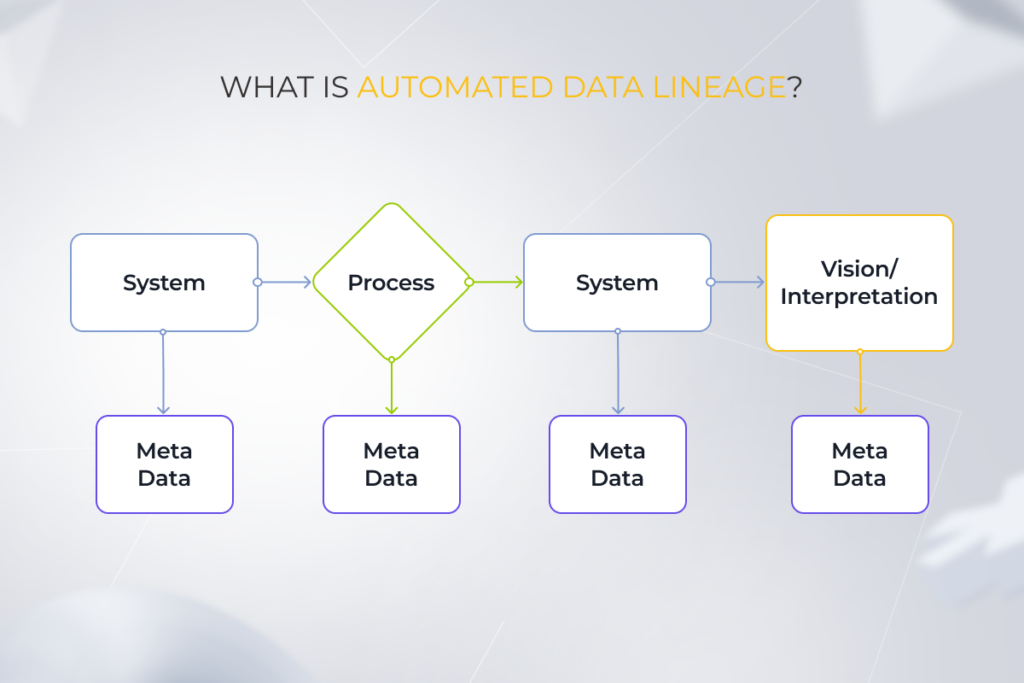
Data lineage refers to the process of tracking and visualizing data flows throughout the organization – from the source to the ultimate destination. Lineage graphs tell the story of your company’s data and demonstrate how it took its current shape, whether it’s by merging, transforming, or integrating.

Origin tracing goes hand in hand with metadata. The latter summarizes information about the data itself, including its type, format, author, date created and updated, etc.

Because of this, data lineage produces a data mapping framework by gathering metadata from each step of the pipeline. Lineage tools then store these insights in a metadata repository and demonstrate over-time changes via metadata through simple visual flows.

Automated data lineage

How can data lineage bolster your analytics?

Over 80% of companies report revenue growth after adopting real-time analytics systems and processes. But how can you get your analytics right against the odds of multiple business systems and applications? Data lineage (and not just some lineage, but an automated one) can save you a lot of effort when it comes to business analysis.

Simplify root cause analysis

It’s common for different business units to act on the same metric. However, when it comes to quarterly planning meetings, each department head suddenly reports a different number on the same KPI. Let’s take ‘sales per quarter,’ as an example. The sales department might claim that they’ve made $1m, while the finance department says it’s $0.75m, as that’s the amount of money that has been deposited into the account As a result, the persistence of erroneous data throughout the enterprise’s systems and robs decision-makers of time and productivity, as they must continuously vet data to ensure it remains accurate.

By automating data lineage, business leaders can easily trace the origin of reporting errors. The stepwise record of data assets sheds light on the black box of insight generation and builds trust in the data estate of the given organization.

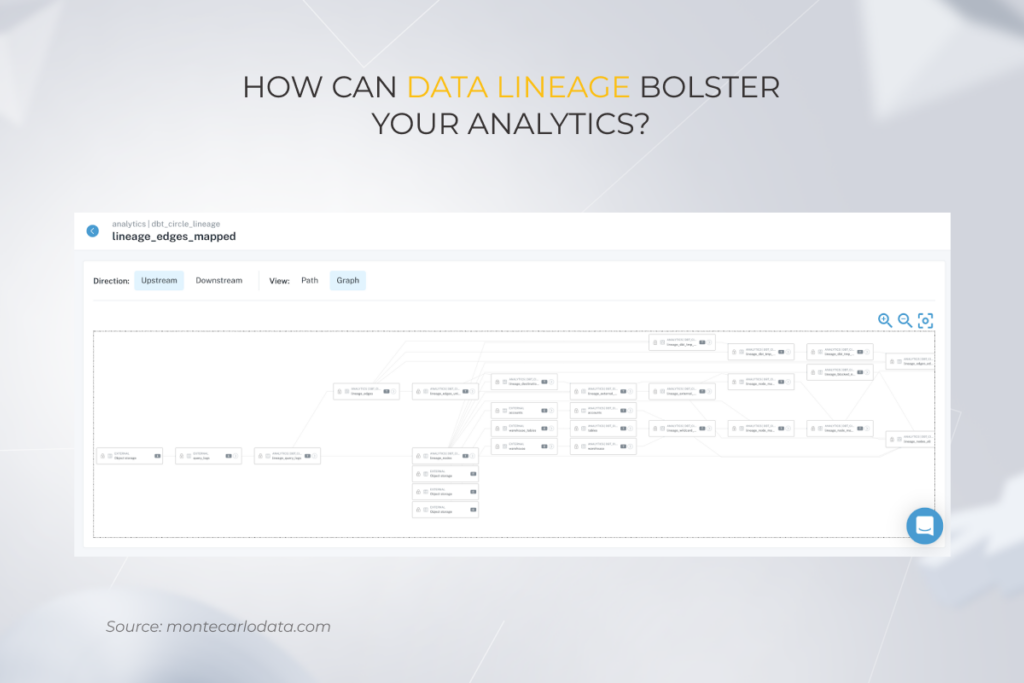
In particular, up-to-date data lineage helps you locate the most upstream nodes of your system that experience the issue. Most likely, this would be ground zero for your problem. The following lineage graph visualizes the hierarchy of data within the organization.

Automated data lineage

Also, if your data and BI management are in good shape, you won’t even need the help of a BI team to trace it back. Meanwhile, mature data architectures that saw little maintenance might need a dedicated BI unit to restore the origins.

Achieve and maintain compliance

The complex data landscape makes adherence to regulations an uphill struggle for compliance-heavy organizations. Companies just cannot provide the required level of transparency needed to meet HIPAA, GDPR, and other guidelines.

Data-lineage documents help organizations map data flow pathways with Personally Identifiable Information to store and transmit it according to applicable regulations. In this case, companies can capture the entire end-to-end data lineage (including depth and granularity) for critical data elements.

Get answers as questions arise

Although pipeline mapping alone cannot ensure data accuracy, automated data lineages can at least deliver a full view of the metadata so that you can see why exactly you have this number in your report. Put simply; you can locate a given business term and trace it to multiple applications, data sources, models, analytics, and other elements of your digital estate.

Unlike manual data tracing, automated data lineage tools minimize errors and return the result in seconds with each manipulation logged.

Simplify data migration

Data integrity and quality issues tend to haunt the majority of migration projects. According to the study, 44% of U.S. organizations admit that poor data quality slows down the migration process. Moreover, unless eliminated, these issues can affect downstream systems and manifest themselves when it comes to the end user. Also, these are tricky to spot during data testing.

To tackle migration challenges, data engineers need to identify the location and lifecycle of data sources. By using automated data lineage, your data migration team can obtain this information flat out, minimizing migration risks. Your engineers can leave all duplicate, outdated, and redundant data behind and identify the structure of a data asset slated for migration.

Instant impact analysis

To estimate the scale of data change, tech specialists resort to impact analysis that demonstrates which downstream systems will be affected in the process. Automated lineage helps pinpoint dependencies and identify the exact stages under impact – with little to no manual effort. Those stages can then be revised to accommodate the changes and promote data consistency across systems.

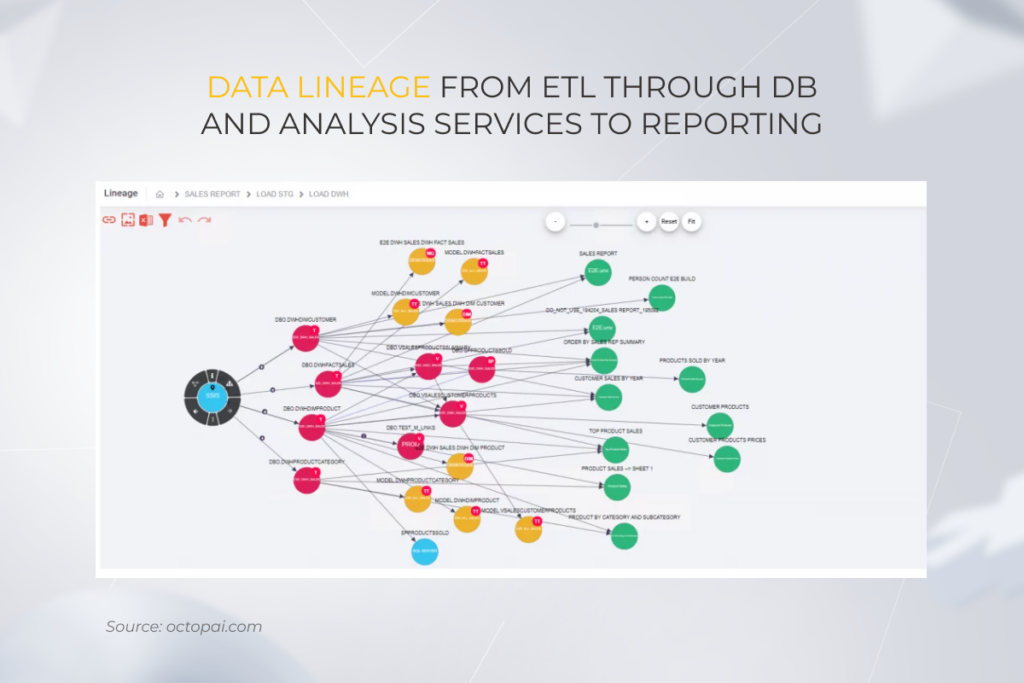
The following data lineage diagram example demonstrates how data flows through four different applications:

Automated data lineage

This is why if you introduce changes to your data warehouse, you can easily see which dashboards the alterations will impact.

Leverage the power of data lineage for analytics

Contact our data analytics team

Manual vs. automated data lineage: which does it better?

When it comes to origin tracing, companies and their IT departments have two options. They can either delegate this task to automated data lineage tools or rely on manual, also known as descriptive, data lineage.

Descriptive data lineage

A descriptive data lineage is one documented manually. In this case, data analysts dedicate effort to recording the information about how the data element is updated over time and how it ends up in a warehouse. This type of lineage is extremely time-consuming and prone to errors stemming from manual input.

Automated data lineage

By delegating lineage to a tool, you automatically handle the metadata recording process. Automated tools trace the asset changes and transformations throughout its lifecycle and make that information readily available via visualizations. From a tech standpoint, you provide meta-integration components to the tool and can then access the visualizations even with no prior knowledge of ETL processes.

However, data lineage automation calls for careful scope selection as this initiative can turn out quite expensive with the wrong choices. Also, the more legacy systems you have, the more data lineage challenges you will face, as aging ecosystems cannot provide metadata sources.

Tracing automation allows you to reduce the expense and effort required to document data lineage. Tools offer autodiscovery and integrations based on machine-learning techniques for creating metadata and building interactive data-lineage flows. Conversely, manual tracing has its inherent challenges linked with resource intensity and isolated workflows as it sits within the remit of the data governance team.

Сommercial or open source data lineage tools: which one to choose?

Data is a man of a thousand faces. And it’s either canned solutions or open-source data lineage tools that can reveal the true face of your assets. Let’s have a closer look at the dichotomy between the two.

Costs

Although it’s impossible to put an accurate price tag on both, making your data lineage open source appears to have more cost-saving potential, at least at first sight. However, free lineage tools typically cannot suffice your unique business needs, thus requiring pricey customizations to an indefinite extent. Commercial tools have all pricing options laid out for you.

Ease of use

Open-source data lineage tools usually require more time and effort from users to navigate due to complex user interfaces and little onboarding guidance. Contrarily, commercial tools tend to walk the user through the interface with more intuitive flows, solid documentation support, and managed pathways.

Alignment with your architecture

If your tech ecosystem already revolves around a particular provider, such as Microsoft Azure, it’s only logical to choose a lineage tool from the same supplier. In this case, the tool will integrate natively into your ecosystem and have no compatibility issues. However, if your stack isn’t centered around a specific offering or you don’t want to go big with your lineage efforts, you can opt for open-source tracing.

For example, one of our clients has a well-calibrated data management process where the team has almost complete visibility into how the data circulates between the systems. The client’s team injects lineage graphs only when they need to dig deep into the data. In this case, open-source tools will be enough.

Integrations and scope of visualizations

As lineage involves tracing the data footprint throughout its entire journey, data lineage tools should be able to integrate easily with your current stack. This includes everything from storage, injection, and visualization and all other stages where your data is originated, stored, or transformed.

Commercial software usually takes over the whole data lifecycle, thus having access to all processing stages via proprietary APIs. As a result, canned software visualizes detailed, all-encompassing insights about your data lineage.

For example, data lineage in Power BI integrates natively with the entire Azure ecosystem, while open-source software requires you to build custom APIs to access metadata.

Struggling to choose the right lineage tool?

Ask our experts

Adopting data lineage: best practices

The main rule of thumb in implementing lineage is to balance this practice against your unique needs and existing capacities. For example, in some cases, the project agenda of our clients requires our data engineers to resort to dedicated lineage tools such as Monte Carlo. In other cases, we build and connect this feature on top of other tools like Apache Airflow.

While lineage experience varies by company, we still have some universal advice on how to track your data origins in the most holistic and comprehensive way.

Keep it omnipresent

To remain authoritative, data lineage should permeate each stage of your data journey, including the phases of sourcing, ingesting, storing, analyzing, and visualizing. However, its presence at each stage should be meaningful and insight-rich, contributing unique nuggets of information to the knowledge body. So when deciding on the integrations, make sure you map data elements at every stage.

Prioritize quality over quantity

Over the last few years, there has been a dramatic shift from vast reams of data to knowledge centered around individual data components. The same trend applies to lineage automation. Instead of embracing the entire data landscape, it’s better to look into relevant metadata details, such as the asset owner and the presence of the asset in downstream sources. This way, you can define the value of each asset for your analysis.

Have the lineage view at the field level

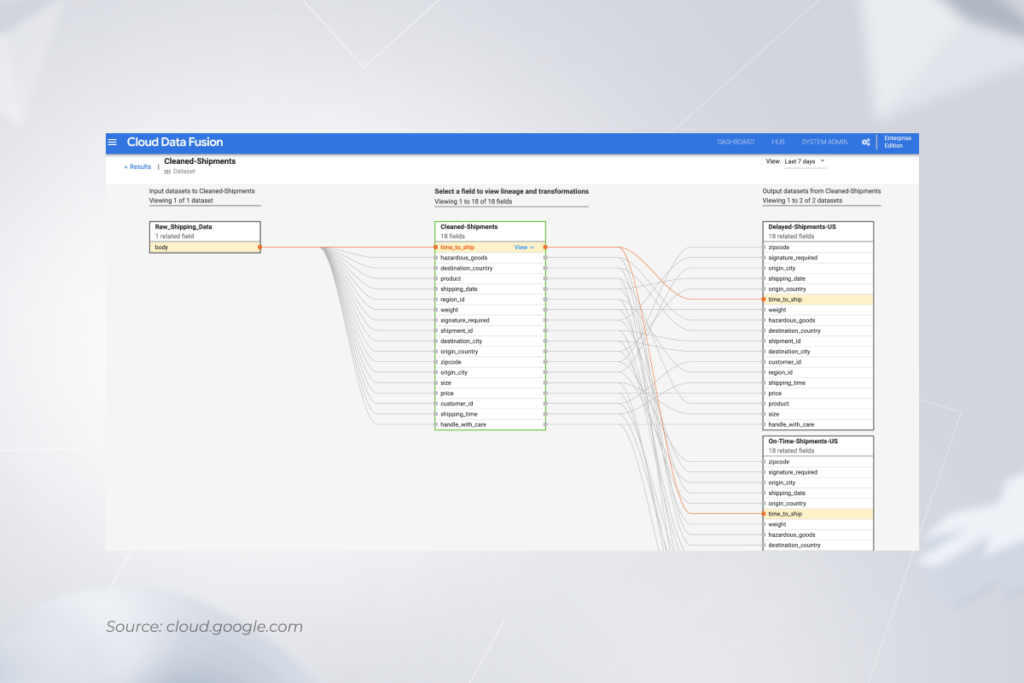
Field-level lineage is key to understanding the relationship between the fields in the data set, thus facilitating root cause analysis. When your pipeline cracks, field-level lineage automation allows your data teams to see exactly how each field of your data circulates in your system and which transformation it has been subject to.

Automated data lineage

Keeping it at the field level helps to ensure the accuracy and quality of insights, point out errors in a revenue report, and trace columns with sensitive information to downstream dashboards.

Decide on the unified data lineage language

Just like any business communication, data lineage should be based on the common dictionary of terms to spread knowledge within the company. To establish a common understanding, your data lineage should rely on clear naming, which represents the data it’s describing. Naming conventions and style guides help people analyze data consistently, making data lineage diagrams easily digestible for all team members.

You can also streamline communication about data lineage between multiple stakeholders to maintain a shared understanding and get feedback on your graphs. To do that, your lineage tools should include built-in collaboration capabilities and notify asset owners about data changes.

Collect, store and prioritize metadata

While troves of high-level data hardly translate into accurate data lineage graphs, substantial amounts of metadata are beneficial to your tracing efforts. Therefore, having a rich metadata repository leads to a more comprehensive snapshot of all report components and faster troubleshooting. Also, including the relevant metadata for a given data asset makes your lineage graph exhaustive and helps you fully realize how potential changes will turn out in reports.

Let data lineage grow with your business

As your business expands, the data footprint of your business processes also builds up. To maintain data tracing complete and full coverage, your lineage architecture should be scalable and include an ever-evolving input stretch. This is why, no matter the analysis area, your lineage tool should look into every pipeline, report, and stack layer at the field level, joined by ample metadata.

Solving the mystery of data discrepancies

Knowing what goes into your report gives you confidence in your data and guarantees the right course of action afterward. Automated data lineage helps you develop a full view of your data evolution and track an individual number to its place of origin, preventing errors in decision-making. However, getting an accurate lineage graph requires a well-balanced data architecture to let the lineage tool mine metadata throughout the entire data lifecycle.

On the journey to better data quality?

Contact our data experts

When Cloud Meets BI: Cloud BI Solutions to Refine Your Business Results

When combined with cloud technology, business intelligence hits its stride in the form of cloud BI solutions.
For quite a while, the cloud has been viewed as the rescuer of business processes. Its speed and scalability are essential to embrace digital business opportunities. Business intelligence is another significant factor that allows organizations to generate value through high-quality and blazingly fast analytics and reporting.
54% of enterprises have already cross-bred these two and claimed that cloud business intelligence solutions are essential to their current and future initiatives. Let’s see why yet another business infrastructure blends well with cloud computing.

What is cloud business intelligence?

Cloud-based business intelligence, or cloud BI, refers to the process of consolidating and crunching data with the help of cloud computing — either partially or fully. With unmatched scalability and processing speed offered by the cloud, companies can pull new meanings from their data across a wide range of devices and applications with none of the overheads associated with locally run infrastructures.

How does cloud BI work? 

When it comes to deploying business intelligence on the cloud, organizations have three options: private, public, or hybrid solutions. While each of the three, abstracts, pools, and shares scalable computing resources across a network, they all differ by the control level over the infrastructures. 

Private

This type of cloud-based analytics business intelligence is premised on rented, vendor-owned data centers. Unlike the popular opinion, privately-run cloud, BI can be located off-premises, yet it’s still dedicated exclusively to the needs of a particular company. 

This type of cloud-based business intelligence software is usually a go-to option for compliance-heavy organizations that have to adhere to regulatory compliances.

Public

Public cloud business intelligence is accessed as an on-demand software-as-a-service solution. Public BI applications cater to multiple companies and are under a full dominion of a cloud provider. As the cost is divided among all tenants, public business intelligence is greatly favored among small- and mid-sized businesses with middle to low regulatory compliance needs.

Hybrid

This access model is the middle ground between private and public environments. A hybrid cloud infrastructure runs business-critical workloads on private clouds, while less sensitive data flows into the public cloud assets. The two environments operate seamlessly side-by-side and allow workloads to move between the two interconnected environments.

Cloud BI Solutions

Cloud-based business intelligence architecture

Cloud BI solutions thrive on an integrated and unified data hub that further sets data analytics in motion. That’s why cloud business intelligence tools need a data warehouse to manage disparate data flows and bring data from various sources under one hood. 

A data warehouse has the upper hand over on-premise warehouses as a more scalable, flexible, and all-in data storage option with less routine management burden and a shared pool of computing resources. Companies are no longer shackled to physical data centers and can dynamically ramp up or down their storages to meet evolving business needs. 

Cloud BI Solutions

But how does all data end up in a warehouse? A cloud BI ETL (extract, transform, load) process is what helps transform raw insights and inject storage-ready bits from multiple points into a single data warehouse. Using cloud-based ETL technology, companies can automate the whole data lifecycle and copy source data to the warehouse destination regularly to facilitate data import.

Besides a data warehouse and ETL, organizations need a few other add-ons to stoke up their cloud BI software. According to a report, users give high marks to relational database support as an element that connects data from different tables (transactions, customer information, etc.) to a cloud data warehouse for a more comprehensive assessment of business performance. 

Compatibility with on-premise digital estates such as ERP and CRM and open client connectors are also critical priorities for seamless data sharing with cloud architecture. NoSQL source support sits on the sidelines of architectural priorities, suggesting that the public cloud is mostly viewed in the context of standalone applications. 

Cloud BI Solutions

Want to build a high-performing BI architecture?

Reach out!

What can you gain from cloud BI solutions?

By 2028, the global cloud analytics market is slated to reach over $86 billion, driven by the data connectivity imperative. Here are the core advantages of cloud BI that contribute to its proliferation.

Fast and easy implementation

Since cloud business intelligence doesn’t require any additional hardware or software installations and cluster set-ups, it takes off faster compared with on-premise ecosystems. A wide range of baked-in features, modules, and governance measures put up to the speed and ease of implementation provided that you know your way around all configurations.

Ease of use 

Cloud BI tools enable self-service insight gathering through simple questions, easy visual analysis, and an intuitive web-based authoring interface. The miscellany of guided workflows suggests minimal adoption barriers for cloud analysis, resulting in higher user buy-in and a low learning curve.

Scalable resources

A cloud architecture auto-scales to growing users with high availability and dynamically allocates resources to match evolving BI initiatives. It means that teams don’t have to build up databases for high workloads immediately, and can easily scale up or down computing resources on an as-needed basis.

Cost savings

The cost reduction potential of cloud BI stems from lower CapEx as you don’t have to spend money on hardware. It gets tricker with operational expenditure where a medley of configurations enters the equation. Without a dedicated team, you risk throwing money down the configuration drain as you fine-tune your cloud domain.

CriterionCloud Business IntelligenceOn-premise BI system
Initial investmentLowHigh
Associated IT costsLowHigh
ImplementationFastLong
Level of customizationMedium to lowMaximum
Data security managementVendorCompany
Total cost of ownershipPredictableEvolving

Advanced data sharing

Cloud analytics is the epitome of collaborative knowledge-sharing and joint workflows as it allows any team member seamless and on-the-go access to the data estate. The infrastructure also allows you to blend data from on-premise and cloud, and augment it with real-time and web-based insights within a single interface.

Automatic updates 

Update management is an irritating inconvenience for on-premise estates that gets hassle-free in a cloud infrastructure. Cloud service providers usually cover hosting, maintenance, and updates so that you can focus on mission-critical tasks.

Rapid data processing

For complex and hefty analysis, companies can leverage high-performance computing available on the cloud. Available at an additional cost, cloud rapid data processing can speed up resource-intensive analysis without a swath of hardware while rechecking your input for maximum accuracy and consistency.

Ease of integration

Although both local and cloud business intelligence boast rich data integration potential, cloud tools still excel at built-in data connectors. Companies can instantly go from data to insight to visual display by integrating all data into a cohesive whole from databases, online services, and other supported data connection types. 

Conversely, on-premise solutions require a more dedicated effort to set up an integrated blanket of data due to the lack of ready-to-go data connectors.

Security & Compliance

Cloud BI compliance benchmarks provide good baseline security as cloud providers focus on the ever-changing regulatory landscape. A BI solution helps you take care of common industry-specific standards and local regulations by offering robust built-in security measures and compliance enablers — gift-wrapped.

Analytics tools keep your guard up with data encryption, automated security updates, multi-tiered caching, and advanced authentication measures. It’s like having a whole team of data security experts at your disposal instead of wading through guidelines and acting on your own.

Learn how to make the most of cloud BI benefits

Drop us a line

What to pay attention to in cloud-based business intelligence software?

A business intelligence tool is an umbrella interface made up of various components to uncover, analyze, and report data from a wide array of data sources. Although the stuffing differs by solution, any BI tool needs four main ingredients to convey the taste of data excellence.

Data management

From data quality to security to governance, an end-to-end data management strategy demands a multidisciplinary approach reinforced by the company, its people, and its digital ecosystem. 

A cloud-based BI tool cannot make up for a holistic data management regimen. But it can become your most integral asset that promotes better data health by integrating, contextualizing, analyzing, and protecting your data assets. 

Some BI solutions provide in-built data management capabilities that help you prepare, model, and bring your data to life within a single interface. The Microsoft BI stack is a prominent example of end-to-end analytics architecture that guides each step of your business intelligence journey with a variety of purpose-built tools.

Advanced analytics

Complex analytics capabilities turn descriptive insights into prescriptive knowledge. This is why your business intelligence system should be premised on built-in AI capabilities, such as image tagging, sentiment analysis, and others, to make every bit of data work to your advantage.

Data visualization and reporting

Visualizations make insights more digestible for all decision-makers and help your data tell stories, instead of throwing puzzles in a spreadsheet of numbers. A BI tool should allow you to slice, filter, highlight, and drill into visualizations with built-in charts, graphs, and maps, along with custom drag-and-drop dashboards. 

Collaboration

Finally, a tool should promote unified team efforts through multiple collaboration channels and sharing options. Some solutions also have a presentation mode to display reports, an embedded functionality for seamless data-sharing, and shared datasets for user-based report creation.

According to a report, other BI mainstays include an ad-hoc query for more niche business questions, production reporting for manufacturing companies, and self-service capabilities for IT-independent business units. The percentage distribution also suggests a direct correlation between the set of features and a user’s job function.

Cloud BI Solutions

Set up your BI initiative for success

Get in touch!

Who can benefit from cloud BI solutions the most?

Over the last few years, business intelligence has emerged as a game changer for different industries. However, some verticals have hit the mark with cloud analysis. 

According to Statista, marketing and sales stand as the biggest gainers of cloud BI, with 50% of respondents marking this asset as critical for their importance. The R&D area has seen a growing importance of BI as well, – with 42.5% of respondents reporting its critical potential. 

Cloud BI Solutions

Another report demonstrates a weighted-mean interest in cloud analytics in higher education and customer services, while healthcare and financial services are still testing the waters of business intelligence.

Cloud BI Solutions

This upward tendency in certain industries implies a tie-in to the growing data in the fields, the demand for greater business flexibility, and the need to measure business performance at scale. All these and more are conveniently packed into cloud business intelligence. 

Which cloud BI provider to choose?

Your business intelligence initiative doesn’t need to be a big bang from the start. You can start small by testing popular SaaS solutions from renowned cloud providers. Microsoft Azure is an acknowledged leader in the field, with 77% of users reporting its critical or very important impact.  

Cloud BI Solutions

The positive user sentiment is well justified for Microsoft Azure as it offers the complete suite of data analytics, BI, and visualization tools on top of its mature, cloud ecosystem. Backed by a multi-layered security approach with 96 compliance offerings, Microsoft Azure helps companies use their data strategically and safely with no back-and-force of third-party tools.

The dominance of Microsoft Azure is indisputable. This ecosystem has your data worries covered on all tracks with data lakes, Power BI, Azure Synapse Analysis, and whatnot can be built with Azure Stack.

As a Microsoft consulting partner, *instinctools helps companies accelerate Power BI adoption and optimize this cloud ecosystem to fit their unique business and data needs. 

Amazon Web Services and Google Cloud Platform also sit on top of leading BI platforms with 66% and 41% combined critical and very important scores, respectively. Both allow users to explore data through interactive dashboards, pattern detection, and outliers powered by machine learning.

The powerful duo of business intelligence and cloud

In an increasingly winner-takes-all business environment, any organization that doesn’t put its data to good use lives on borrowed time. Cloud BI tools help you achieve business impact with data and get a comprehensive perspective — at any time, at reduced costs, and at your convenience. Powered with analytics and visuals, cloud BI solutions give voice to your data and help you translate the language of numbers into the language of action.

Need help with your cloud BI tools?

Contact our experts

Power BI vs Excel: which tool fits your business needs

Often, companies that analyze data with Excel spreadsheets consider this tool the best option for this task. Power BI fans, on the other hand, are sure that their favorite rocks. To make the right decision on which Microsoft product to choose for your company, you need an unbiased view of them both.

This article encompasses a very detailed comparison of the two business analytics tools. The insights are based on the facts of the fast-growing big data market size.

big data market size revenue

So, if your company faces the issues connected with the efficient processing of big data and is looking for an option of how to cope with data volume growth, keep reading this article and find the best solution to meet your needs.

Power BI vs Excel: A comprehensive comparison

This section analyzes the difference between the two reporting tools based on the exact tasks you manage in your ordinary working life. This will help you understand the Power BI advantages over Excel and vice versa, depending on what you need, and consider it in your BI strategy.

Multiple sources input

Task: you need to connect multiple data sources for automating data inputs in real time.

Power BI vs Excel comparison: both reporting tools can address this issue almost with the same efficiency. For this, they use Power Query and get data from almost anywhere in real time.

However, for the process automation and exclusion of manual inputs, Microsoft Power BI uses Direct Query, whereas Excel has data connectors.

As for the ease of the data entry process, it is similar in both cases. The advantage of Excel, though, is the possibility to use unstructured data sets from unstructured sources and their manual or macros-driven processing afterward. However, people looking for Power BI benefits over Excel sometimes say that it’s not effective enough for steady dataflows, although it may be helpful for the operational work of the back office.

Data transformation

Task: you need to automate the data conversion from one format or structure to another for data processing at a later date.

Power BI vs Excel comparison: both business analytics tools efficiently handle this task thanks to Power Query. The latter allows for about 350 data transformation types. For instance, you get data from SQL Server, CSV file, OData, or any other data sources and convert them into a format convenient for data processing in Power BI or Excel. Power Query will do this transformation for you automatically.

Big Data Performance

Task: you need to analyze big data and build pivot tables for better data performance.

Power BI vs Excel comparison: both tools claim they work with millions of data rows, but Power BI still benefits over Excel in this task. *instinctools’ analysts who are experienced in using both Microsoft Power BI and Excel deny the two have a similar efficiency level.

According to the tests we’ve run, Excel effortlessly handles about 200-300 thousand rows, with one Excel sheet covering a bit more than one million rows. If you want to process more, you need to compile data from different sheets, which is time-consuming and not very convenient at all. Meanwhile, Power BI is more efficient when it comes to a data volume of up to 50-100 million rows, which is 100-200 times more than you can do in Excel.

— Dzianis Yushkevich, Senior Business Intelligence Analyst, at *instinctools.

Another drawback of Microsoft Excel is that the Power Pivot data model is not available in all the Excel versions. Apart from building pivot tables as the standard Excel does, Power Pivot creates the more sophisticated data models, with filtering data, renaming columns while importing data, and much more.

Data refresh

Task: you need to update your data regularly to support its relevance.

Power BI vs Excel comparison: both reporting tools allow for automatic and scheduled data refreshing. Although some sources say that Excel automates data updates only with VBA, the pre-scheduled data refresh is also available.

automated data refresh in Excel

When it comes to VBA usage, it cannot automate the data refresh process entirely because sometimes it will require a user to confirm certain steps. Apart from the inconvenience, the key stopper here is that users without basic knowledge of VBA cannot do this effectively. 

Data modeling

Task: you need to do data calculations.

Power BI vs Excel comparison: in Power BI, the only option for data modeling and calculations is to use data analysis expressions (DAX). This is a library encompassing functions and operations that can be used for building expressions and formulas. In Microsoft Excel reports you can operate both DAX and standard Excel formulas, which is easier for people not acquainted with DAX.

Data visualization

Task: you need to visualize datasets for a better understanding of trends and fluctuations.

Power BI vs Excel comparison: the visualization toolset is very similar in Power BI and Excel. Users highlighting Power BI advantages over Excel may not know that the extra modules and add-ons can be used in Excel, too. Excel even has a module for building advanced business diagrams. Although both data analytics tools utilize the functionality of Power Query (to automate the processing of raw data), Power Pivot (to handle big data), and DAX (to make advanced calculations), Power BI forces users to get acquainted with this toolkit, whereas Excel does not.

Generally, Power BI is like a combination of Excel and Access in one application, but with more powerful options for data processing and a broad portfolio of ready-to-use visualization solutions. Power Query is also integrated better into Power BI thanks to its more powerful internal memory and processing.

— Dzianis Yushkevich, Senior Business Intelligence Analyst, at *instinctools.

If you are looking for a tool with better interaction opportunities, Microsoft Power BI will come in handy here, too.

When it comes to diagrams, Power BI benefits over Excel because it is more convenient in use, there is less room for error, and since the diagram is connected to the dataset directly, the transformation of data into visual happens almost instantly.

— Dzianis Yushkevich, Senior Business Intelligence Analyst, at *instinctools.

Flexible analytics

Task: you need to aggregate data in different ways depending on the task.

Power BI vs Excel comparison: Power BI automates the reporting process and can work with multiple dataflows. Meanwhile, Excel allows for versatile advanced modeling and solving non-trivial analytic tasks. Taking a helicopter view, Power BI utilizes matrix tables, decomposition trees, insights, and key influencers. But, only in Quick Insights are there up to 32 insight cards.

Quick Insights Example

As for Microsoft Excel, you can create dashboards and easily analyze data with Pivot Tables, using formulas anywhere you want, entering data, or applying visualization templates.

data visualization Excel

Data security

Task: you need to share your reports inside or outside your organization, and still prevent any hijacking associated with the fraudulent activities of third parties.

Power BI vs Excel comparison: generally, Power BI is considered a more secure tool than Excel because of its highly secure password access and restricted access to roles.

Mobile reports

Task: you need to access reports on a smartphone.

Power BI vs Excel comparison: Power BI benefits over Excel reports in this question because Power BI allows for much easier interactions with its mobile-driven version. As for Excel, although it claims to have the same functionality as the desktop version has, actually, it is only convenient for the report reviewing. If you’d like to make any on-the-go changes, Power BI is a better option for any mobile device.

Cost 

Task: you want to choose a cost-efficient tool for your data analysis.

Power BI vs Excel comparison: since Power BI and Excel use different approaches to pricing, it’s better to calculate the total cost of each tool. Power BI has two plans, Pro and Premium. The Pro plan for $9/user/mo allows for a 1GB model size limit, 10GB/user data storage, and standard Power BI functionality. However, if you need paginated reports, advanced AI, dataflows, or application lifecycle management, you need to choose one of the Premium options, for $20/user/mo or at a flat rate of $4,995/capacity/mo, which is more relevant for an enterprise-scale level organization. More detail on the plan difference is available here.

Microsoft Excel comes at a flat rate of $135 if you buy a standalone version or $6.99/mo if it is a part of Office 365 Suite.

What are Power BI benefits over Excel?

To summarize the benefits of Power BI, let’s use the following list:

  • It processes larger data volumes.
  • It has more functionality for data visualization.
  • It automates the processing of data coming from multiple sources.
  • It assures higher data security.
  • It is more convenient to use on a mobile device. 

Power BI and Excel: the perfect combination of both

If you are still undecided about whether to switch to Power BI, you can benefit from using both tools at once. Although Excel will remain your main tool, you can connect Power BI for some of its functionalities. For instance, you can build Power BI dashboards with multiple workbooks in a single view.

Power BI add-on for Excel

Also, you can easily discover insights with Power BI reports. 

Self-service data visualization
Self-service data visualization. Source: Microsoft

In addition, you can enrich your analytics and maintain the flexibility you need.

When is the right time to move forward?

It’s time to start thinking about Power BI refresh data from Excel if your data volumes are growing and you need an efficient tool that can cope with such datasets. This migration will let you process big data, use data on the go, and make your reports more secure. If you don’t know where to start or how to tune up the data analysis process in your company, turn to *instinctools — we’ll provide you with an efficient and cost-saving Power BI service.

How is business intelligence changing the retail industry?

The customer is always right. That’s the first rule of the retail industry, isn’t it? But how do you know what your customer wants, even before they do, and keep them satisfied? After all, customer demand is constantly evolving with new trends emerging every day. That’s where business intelligence (BI) comes in. BI is a small tool for analyzing your business and getting you the results you need. So, how is business intelligence changing the retail industry? And, what can we expect from the future of smart retail? 

What is business intelligence?

In a nutshell, business intelligence is a powerful tool used by companies to understand their target customers and market better. Otherwise known as BI, this software takes raw data and turns it into valuable information. This is then transformed into actionable insights that lead to future business decisions. 

To understand the value of BI for the retail businesses today, we just need to ask one simple question: which of the following is an example of technology’s impact on the wholesale/retail trade industry?

  • Amazon
  • Blockbuster

We’ll give you a hint. One is a company with a market cap of over 1.5 trillion USD, and the other is a nostalgic memory from the past. The difference? One was future-focused, the other looked only at the current market. The results speak for themselves. 

Today’s business intelligence tools provide companies with new opportunities and allow them to take advantage of data not only to predict current sales but to see future potential, trends and understand customer demand on a deeper level. But how does BI work and why is it so effective?

Fuelled by data: how would the retail industry use business intelligence?

One does not simply BI and win. Reaping its benefits of a BI tool implementation can only be achieved when the application of business intelligence in the retail industry forms an integral part of the company’s overall BI strategy. 

From product to inventory management, sales, marketing, and beyond, business intelligence solution should underline everything. It helps develop that closer customer connection essential to dominating the marketing and predicting future trends. Below are some of the crucial techniques that BI has at its core.

Data analysis visualization. This is all about how you see your data. Data analysis visualization presents data in dashboards and uses customized metrics relevant to your retail company to make informed decisions quicker and based on facts. Moreover, BI tools can be embedded into your existing applications to empower users with immediate access to data. 

Reporting. When the bottom line is finance, making sure your business is in the black is vital. BI tools for reporting gather data from all over your company and process it to allow better data analytics and reporting and financial decision-making with a cool head and rational mind.

Predictive analytics. How do you know a strategy will work? The truth is you can’t, not 100%. However, with business intelligence, you can make an evidence-based decision to drive business further. BI allows you to analyze data and make a reasonable guess at the latest trends and customer behaviors that drive sales and impact the company’s future growth.

But, most of all, all that data tells you one important thing – all about your customer and the market. This is what those statistics really mean. 

Data tells meaningful stories: benefits of business intelligence in the retail industry

Your customer is an individual. They are not a statistic. Not a market segment. And not a group. In today’s market, they expect to be treated as such. Brands that can tap into personalization and good customer service can deliver 5.7 times more revenue than competitors. 

But how do you know who your customer is and what they desire? This is where business analysis steps up to the plate. It allows retail companies to absorb mass amounts of data about their business and customer data – from sales to market trends, consumer behavior and needs, and more – and using BI transforms it to tell meaningful stories. 

It is these stories that help you connect with your company’s bottom line – your customers. After all, isn’t how good you think your product or service is. It is how good your client thinks your product or service is.

Need to make sense of the sea of data to get closer to your customers?

Drop us a line

Here are the six advantages of business intelligence in the retail industry

Instead of just witnessing how business intelligence is changing the retail industry, be an active player in the process. With the technology in place, your employees will be able to rely on meaningful information when making decisions, uncover pain points in your business processes in the early stages, gather data about your customers from heterogeneous sources to create deeply personalized offers, and identify the most appropriate way to connect with each consumer.

Improve your decision-making

Data isn’t just numbers. It’s behavior. By engaging data in a meaningful way, businesses can better understand their market and capitalize on it. Utilizing all that big data and transforming it into easy-to-digest actionable steps allows retail companies to plan and strategize more effectively based on actual market need, not presumed ideals. 

Optimize your processes

No business strategy is perfect from the start. What’s important is to identify and eliminate those errors early on. BI solutions empower companies to continuously assess how their business operations run to gain operational efficiency. By identifying pain points early on, these can be quickly eliminated, and improvements made.

Know your customer

Business is driven by market demand. If no demand exists, what you have is a hobby, not a business. BI tool allows you to gather data about your customers, like never before. And this applies whether you are a brick and mortar store or an online platform.

Here’s an example of a visualization of a customer’s decision-making process that helps you simulate customer-switching and estimate the likelihood of switching from one need state to another.

BI tools enable your business to take both structured and instructed data and transform it into actionable insights. These tell not only about your sales process and any issues but who your customer is. This allows you to optimize for them and their needs, increase customer engagement or predict customer churn and mitigate the impact of this process. 

Personalize to perfection

As we said, consumers now expect businesses to interact with them on an individual level. This is crucial to client satisfaction. After all, a satisfied customer is four times more likely to refer a friend and five times more likely to make a repeat purchase. But, can a business do so without jeopardizing profit? 

Business Intelligence, of course. This solution helps you to identify areas within your business and customer journey that can be personalized, and cost-effectively. For example, it may be the purchase process on your app or how your staff interacts with clients.  

Keep your staff in-the-know

Henry Ford once said, “The only thing worse than training your employees and having them leave is not training them and having them stay.” One of the key benefits of business intelligence is helping your staff better understand your clients and their needs. 

Empowered with knowledge, your team can better trouble-shoot issues, adapt to customer needs and behaviors, and, thus, increase customer satisfaction level and improve sales. For example, this could be as simple as allowing shoppers to shop independently or providing assistance. Knowing that your shoppers prefer home delivery over pick up or having an option to do so. Or even as complicated as offering recommendations based on previous choices. 

Connect the right way

Sales and marketing probably make up a significant chunk of your budget. That’s why it’s vital that they’re effective. No longer are sales and marketing campaigns merely targeted to customer segments or around special occasions, such as the holidays. Your sales and marketing need to directly connect with an individual customer as 96% of consumers expect a seamless shopping experience across channels. 

BI empowers your retail business, first to understand what makes your customer tick, and utilize it in a meaningful way to connect on their level. What platforms do they use? Where do they shop? And could will they know about your business? Saving you time, money, and allowing you to plan effectively.

Want to reap these benefits of BI adoption?

We’ll help

So then, how is business intelligence changing the face of the retail industry?

This is retail, but not as we know it. Data is driving everything, and only those who can lasso the great bull of ones and zeros can hope to control the market. Smart retail is here to stay. It is data-driven, efficient, and, most of all, customer-focused. 

In the digital world, the bottom line of business is the ability to adapt, be future-focused, and personal. And the tool to achieving it is business intelligence. BI is changing how retail is done, making it forward-facing and customer-focused in a way unlike ever before.

Keep up with BI adoption trend and leverage the technology to the fullest!

Get in touch
Big Data Security Concerns for 2025 and Beyond

Nearly 97,2% of firms invest in Big Data initiatives, confident that data will give them a serious leg up. In reality, only 1 in 4 business executives see profitability in their efforts. Among the biggest hurdles blocking payoffs — cited by 36% of surveyed leaders — are Big Data security concerns.

This article outlines the common security concerns related to Big Data and provides you with results-oriented methods to protect your sensitive data.

Big Data complexity and collateral security issues

Because of the Big Data diversity, its security can be viewed from two sides — corporate data and customer data. Organizations should be aware of business data security as the data loss of proprietary information is equivalent to exposing your weak points to your competitors and handing them a competitive advantage on a silver platter. 

Imagine a logistics provider that has prepared a special transportation offer for its clients over the Christmas period. What if information about it leaks out right before the holiday season? Knowing the targeted audience and specifics of the promotional offer, your competitors will have the opportunity to improve their advertising campaigns and make them more attractive than yours. 

Though business data leakage is one of the large-scale issues of data security, it affects only the organization itself. But along with corporate data, companies also keep sensitive data about their customers. In case this information falls into unreliable hands, the severity of the problem skyrockets as more than 90% of people state they want to control who can get information about them.

Leakage of customer data might have major repercussions for the company in terms of the compensation fee it’ll be liable for and losing the clientele to competitors that offer the same services but with higher security levels. The largest recorded U.S. data breach in the healthcare sector was in 2015 at Anthem Inc., a health insurance provider in the United States when criminal hackers stole sensitive data affecting 80 million individuals. After two years of litigation, Anthem paid $150 million to settle lawsuits over the incident. 

The recent breach involving National Public Data, one of the biggest background check companies, exposed 2,9 billion records of sensitive personal information — names, social security numbers, and addresses. Much of the data was put up for sale on the dark web for $3,5 million. As of January 2025, the company has yet to fully resolve the damage, although it has acknowledged the breach and is cooperating with law enforcement. They’ve even filed for bankruptcy, citing the financial blow from the incident as a key factor.

Cost of a data breach by industry, 2023-2024


What security best practices can you leverage to protect your business and customers’ data considering the diversity of data structure and format, storage location, origin source, device type, etc.? We’ve listed seven common data security problems and their solutions.

1. Network perimeter insecurity

When information enters a company’s network, it goes through various security checks. But if your system fails to separate potentially destructive data among incoming data, it can get into the infrastructure and cause a lot of damage.

Cyber-attacks are continuously evolving and becoming more sophisticated, so organizations should rethink their Big Data security management and adopt zero trust architecture solutions. These assume a dynamic digital identity-based perimeter and approach where any user or device, application or system, outside and inside the network, is classed as untrusted by default. In this case, organizations’ resources are secured regardless of their location because access control moves from the perimeter to each device and user, and the network is divided into micro-segments to make it harder for hackers to attack.

Zero trust architecture: key capabilities

2. Social engineering attacks

A classic example of this type of attack is known as phishing. This is when attackers send you messages that seem to be from a known, trusted source but, in reality, are malicious. If your employee unknowingly clicks on an untrustworthy link, hackers can access the corporate network.

Implement gateways to prevent scam emails that may contain spam, malware, or phishing attempts. Gateways are useful for identifying bad emails thanks to their antivirus, anti-spam, and anti-phishing functions.

But what if the malicious link isn’t in the email but in an attached PDF file? That way, gateways won’t identify the suspicious email and quarantine it. To confront the current data security problems and threats, take advantage of the additional features the gateways can provide you with, such as a sandbox. It’s a safe isolated replica of your real environment where you can open potentially malicious letters without impacting a system or platform on which they run. 

Email sandboxing architecture

3. Data cleansing problems

Big Data is known for promising benefits such as improved decision-making, but to get valuable data, you should first separate the wheat from the chaff and deal with the dirty and messy data. Otherwise, you’ll get stuck in a vicious cycle of poor data and a garbage-in-garbage-out trap. 

Here’s where an automated data cleansing process enters the battlefield to provide you with correct, complete, and properly formatted data from your warehouse stores. But if those tools are not configured correctly, data cleaning will result in inconsistent data and Big Data analytics security concerns won’t go anywhere. An algorithm can fail at the data classification stage — it may define sensitive data as normal and share it with a wide range of people. 

4. Flawed data masking measures

Organizations adopt data masking policies to distinguish data that identifies customers (characteristics by which one person differs from another, such as date of birth, name, and age) from confidential information about them (data that also is connected to a customer persona, but is changeable, like home address, driver’s license number, bank account number).

The purpose of data masking is to prevent big data security risks by stopping cybercriminals from matching customers and their sensitive information. If data masking is done incorrectly, it can be reversed by hackers.

A key solution for securing big data is data encryption. But it takes time to implement effectively, so how to keep the data processing speed up (since velocity is one of the five core Vs of Big Data along with variety, volume, value, and veracity)? Use these techniques of data encryption at the last stage of data processing to ensure big data security.

  • Data scrambling. Input data characters are randomly reorganized and replaced in data storage.
  • Data substitution. Fake data replaces real information, you can use random names from a phone book instead of real customer names. 

In both cases, original data is still available at your warehouse or data lake. You use substituted or scrambled information to make decisions as you can’t use sensitive data for those purposes according to data protection regulations including GDPR.

In addition, so that your security efforts don’t go down the drain, make sure to set access controls so that specific data masking algorithm settings were available only for data owners in the relevant departments and no one else.

5. Fake data generation 

Cybercrime attacks can result in fake numbers that your dashboards will show as it happened with Amazon when the site’s algorithms (Amazon’s Choice, top sellers, products ratings) were manipulated with fake products’ reviews that overrated certain products and sellers artificially. If you can’t see the real picture you’ll end up getting the wrong insights and making flawed decisions that can also result in big data security issues. 

Data that has gone past its sell-by date also becomes a fake that can badly affect your decision-making process and, thus, business operations. Which fake results can it show? Learn from the story of United Airlines. They lost $1 billion a year because of an inaccurate pricing model that was based on the passengers’ seating preferences that used to be relevant 10 years before. 

Your ability to secure data and protect client and company data is diminished if you can’t identify fake or outdated data in your central repository. Take advantage of BI consulting to analyze the current state of your data systems, use Machine Learning (ML) models to find anomalies in your data, and apply a fraud detection approach. Studies show an accuracy rate of 97,9% for detecting fraudulent transactions with ML. ML-powered fraud detection also helps to reduce fraud investigation time by up to 70%.

6. Unauthorized changes in metadata

Bearing in mind the gargantuan volume of Big Data, unauthorized metadata modifications make it challenging to manage changes in ‘data about other data’ and identify the relevant information afterward as you don’t know for sure which changes are trustworthy. 

To exclude unauthorized access and its displeasing consequences, such as wrong data sets and untraceable data sources: 

  • implement user access control and obligatory authorization processes for employees
  • use nulling out when data is replaced with NULL for an unauthorized user 

Since even basic sensitive information such as a document author’s name, revision history, type of software, in the wrong hands may lead to a potential data breach, you’d better use one more measure to secure your metadata — sanitization. This is the process of removing sensitive data from the document. After sanitization, the file may be distributed to a broader audience. 

Unauthorized changes in metadata can also jeopardize data security and make things awkward if you prepare an offer for the customer by copying a previous file. If the document doesn’t go through the sanitization, your hypothetical client will have access to the history of changes and find the corrections of the original budgets or the scope of work for your previous customer.

Therefore, don’t underestimate the importance of this activity. Use automated data sanitization tools to ensure that only the intended information can be accessed. 

7. Employees’ carelessness

Have you heard about the Equifax breach that was caused by an employee’s error? An individual in the technology department had ignored security alerts, which led to exposing the sensitive data of nearly 146 million Americans. 

A Verizon’s report states 74% of data-related incidents involved human error. The level of accidental staff negligence rises alongside the growing number of devices accessing the company’s and customers’ sensitive data — not to mention the risk of employees exposing it to popular gen AI chatbots. With staff accessing data from personal and over unsecured networks, sharing a file with unauthorized parties — whether accidentally or maliciously — can be as easy as snapping your fingers.

The technical aspects of the solution that will help you detect security breaches in time and ensure big data security include the implementation of multi-layer authentication and an inside threat detection approach to get notifications about security threats by your staff. As for the ‘people’ part, create an atmosphere where employees feel safe to report on a lost or stolen device and do it immediately.

Security audits and actualization of your Big Data strategy are initial, yet critical steps in resolving Big Data and security concerns

Big Data technology is a world of opportunities. It helps you better grasp your customers’ needs, create detailed hypotheses for market testing, and find ways to improve the product. And yet, Big Data technology is only worth using if the solutions you have are properly secured. Start with a security audit to identify the areas of concern, for example, those referred to data storage or data cleaning, and don’t ignore them when developing your Big Data strategy. Not sure you can deal with all the Big Data security challenges by yourself? Our BI experts have you covered, get in touch to find out how.

FAQ

What are major security concerns of Big Data?

The complexity of data in terms of its structure, source, storage location, format, device type, etc. is one of the key security concerns related to Big Data. Coupled with the diversity of processes that occur with Big Data — storing, cleaning, masking, etc. — controlling various data transformations is challenging.

What are various security and privacy challenges of Big Data?

Ensuring security and confidentiality of business data and customers’ sensitive information are the main security issues in Big Data. You have to improve your system’s cyberattack resilience level, configure automated data cleaning, data masking, and document sanitization tools, establish mandatory authorization for employees, and adjust continuous monitoring of the system’s state.

Anna Vasilevskaya
AI modified real photo
Anna Vasilevskaya
Account Executive

Get in touch
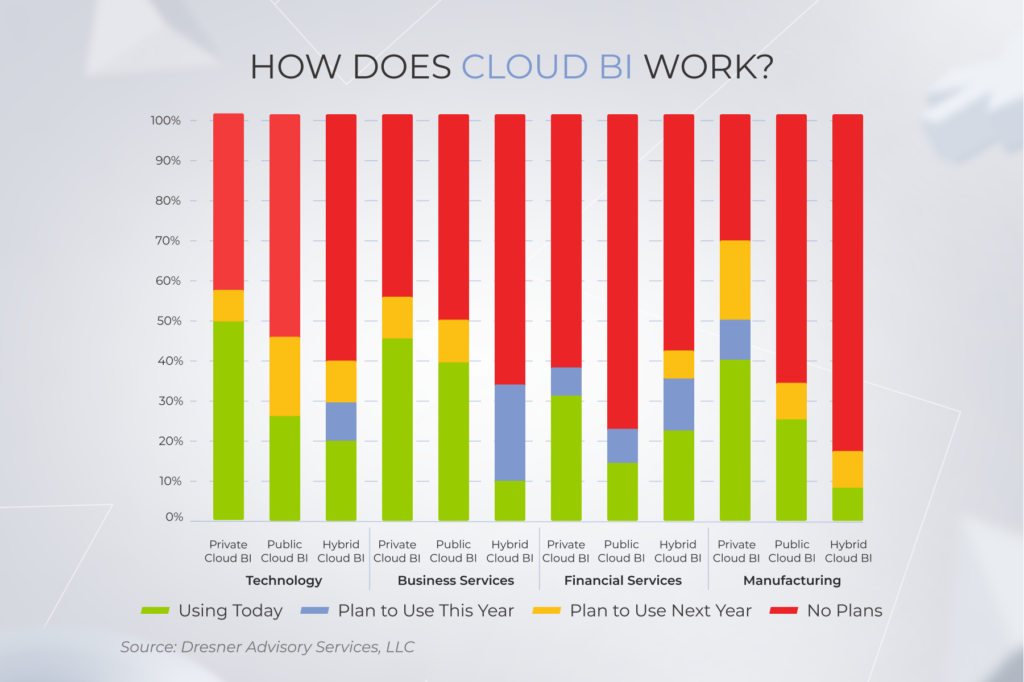
Drop us a line about your project at
[email protected] or via the contact
form below, and we will contact you soon.