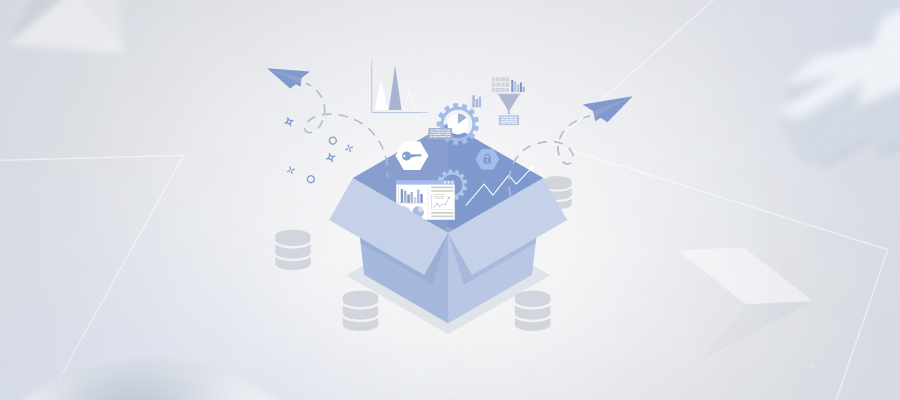
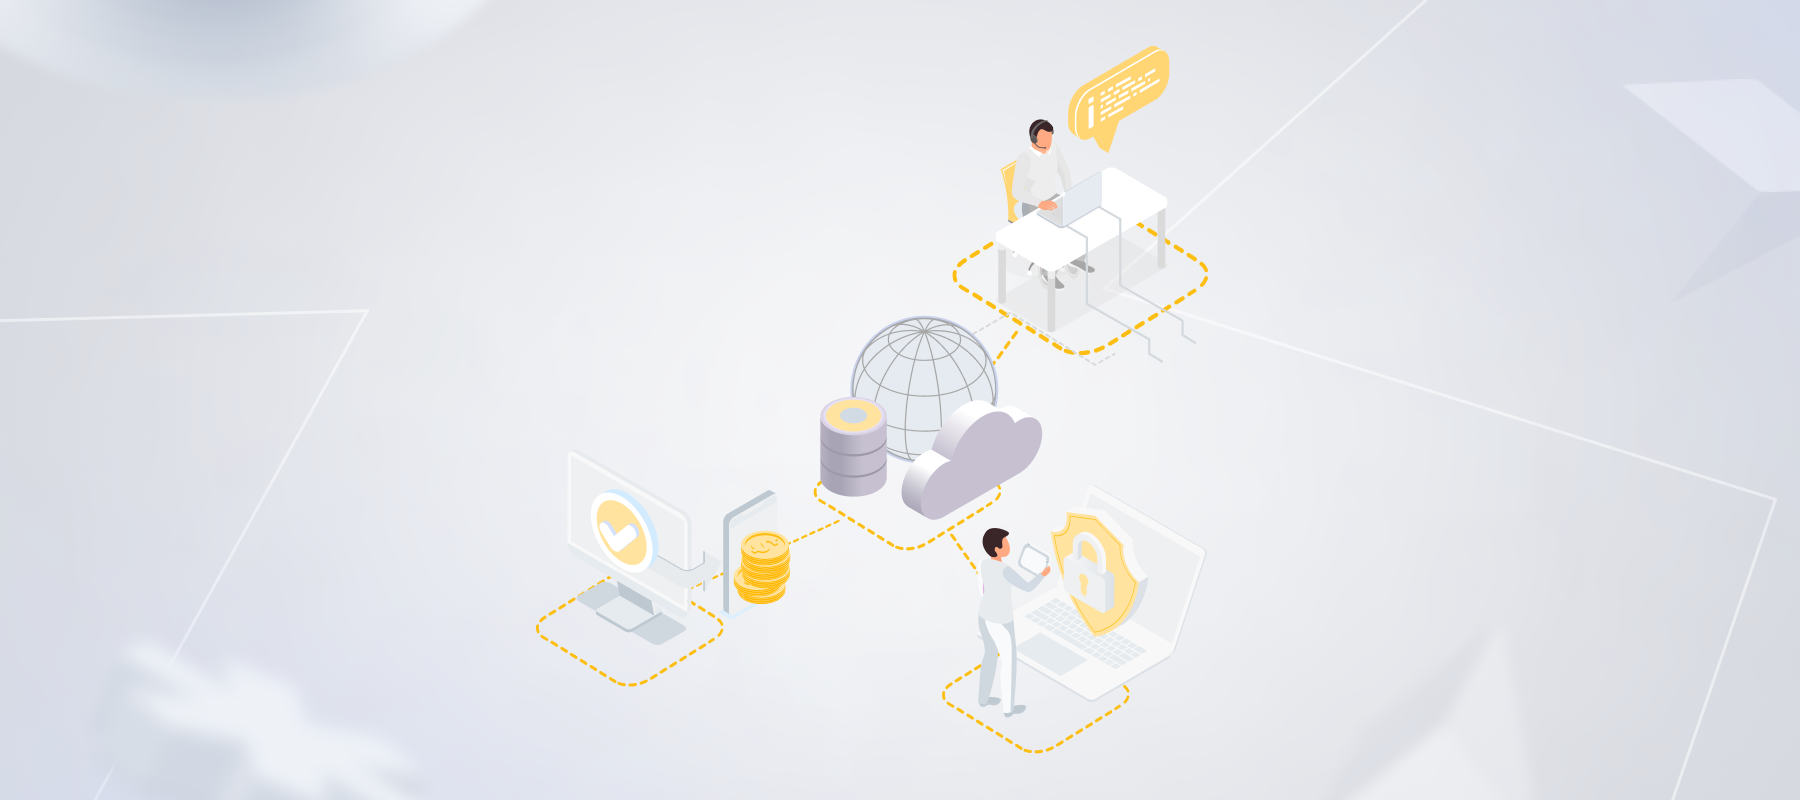
Most businesses deal with a gigantic amount of data on a daily basis. The question is how to make the most of it. It turned out the biggest issues associated with Big Data are not really analytical ones. In many cases, these problems refer to data integration.
Why is data integration important?
Perhaps, the only thing worse than a shortage of information is an overflow of information, which is inaccurate or useless. Although the lack of data makes one flying blind, at least, it provokes taking actions, while a number of low-quality pieces of information can lull businesses into a false sense of security. Intelligent decisions can only be based on trustworthy and relevant data – data, which is integrated from multiple sources into a single, unified, bird’s-eye view. This process, however, involves certain challenges, and to tackle them successfully, enterprises should be perfectly aware of what these challenges are.
Data integration challenges
Data compatibility
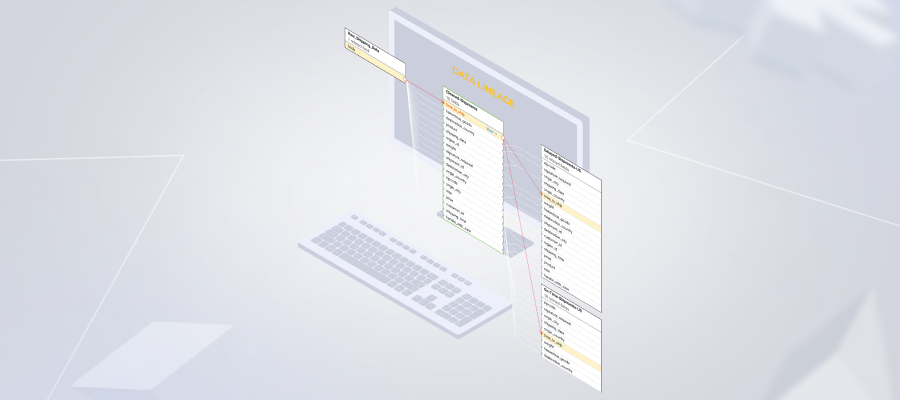
Databases, web applications, CRM systems, and many more – there are tons of sources that enterprise data is coming from. As long as each source has its own interaction rules, no wonder extracting, transforming, and making data compatible with a destination system becomes time and resource-consuming. Besides, it’s only getting worse with time since the number of data sources grows along with the company.
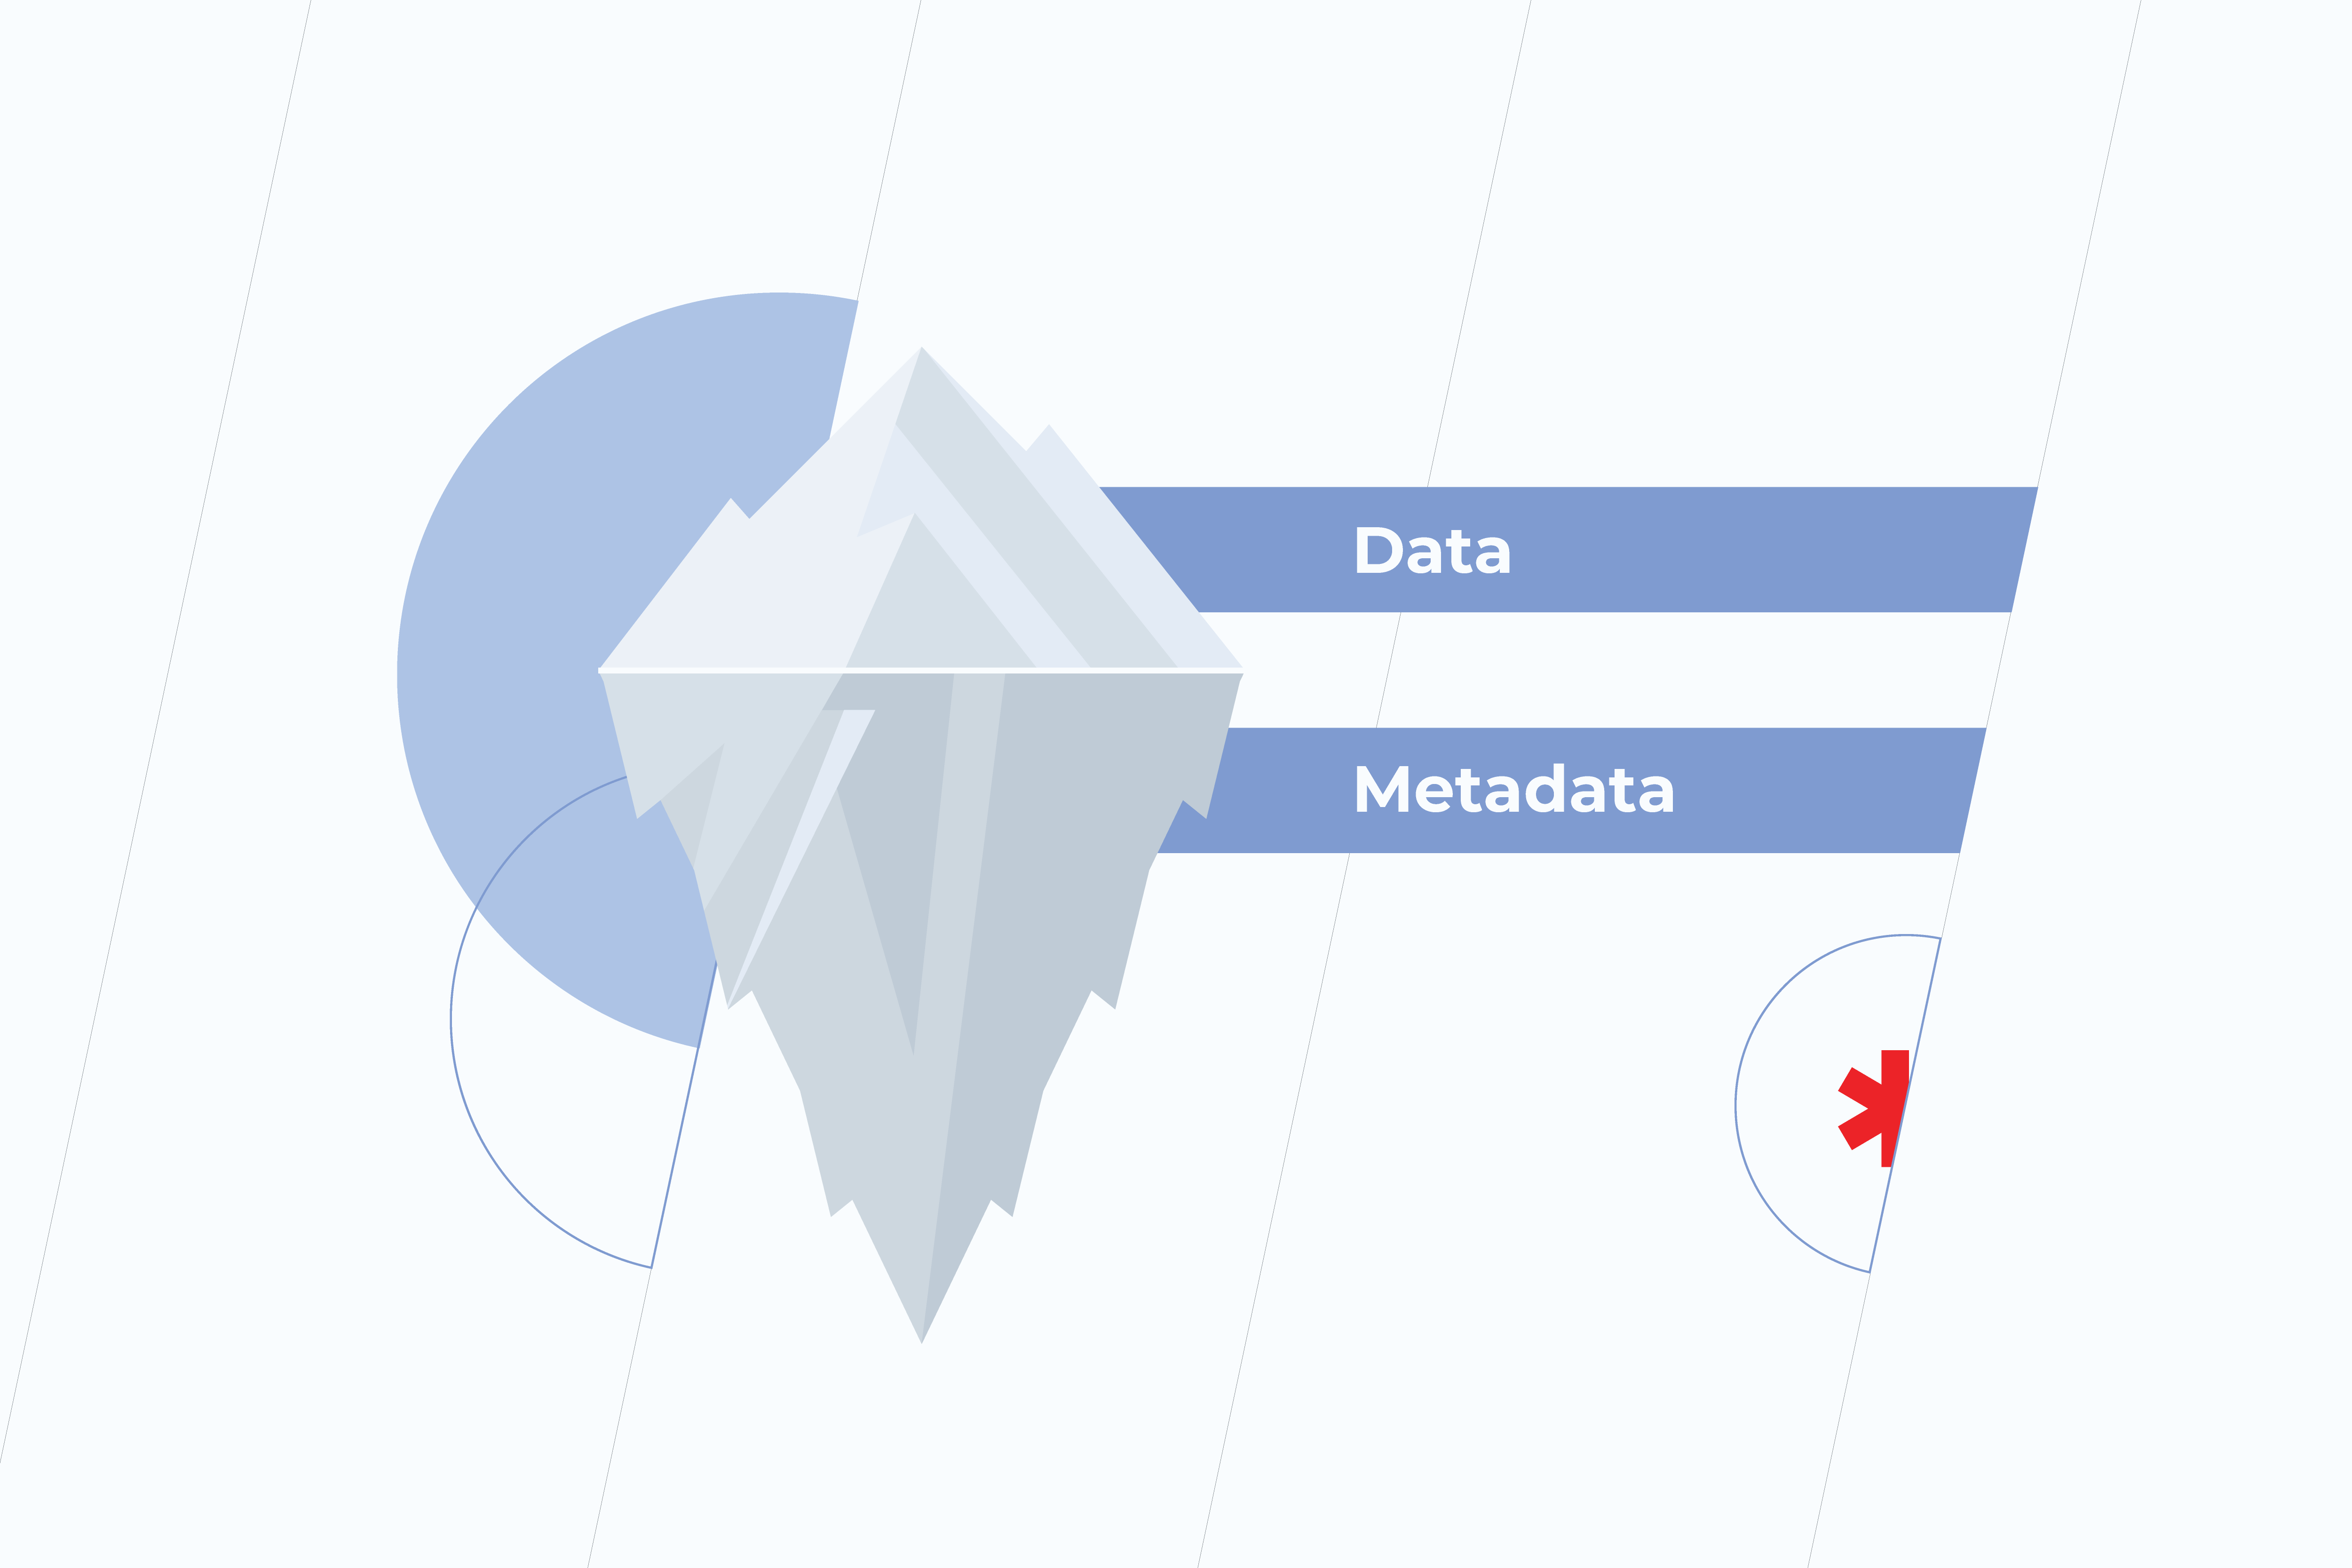
In a Big Data world, the best way to address this problem is using metadata, which, simply put, contains basic information about other data. It supports the validity, accuracy, and usability of related data. Metadata helps to harness the power of data, enabling your team to extract all the necessary information faster and more accurately, as a result, to speed up decision-making. Without metadata management, data initiatives can spiral out of control.
Data silos
Data which is organized within individual departments might not be fully accessible for the rest of the organization. These separate sets of overlapping but inconsistent information turn out to be in silos. Doing nothing about it sounds like a bad plan since the quantity and diversity of data grows and so do silos.
This puts a huge barrier to a holistic view of enterprise data. When it comes to data analysis, data silos cause problems as the information is often stored in formats that are inconsistent with one another. Moreover, not having the shared data in one source often results in wasting time and effort on duplicated work.
The approach that addresses the aforementioned problems is called data harmonization. In a nutshell, it includes taking data from disparate sources, removing misleading or inaccurate items, and making all that cleaned and sorted data compatible.
Taking into account the size and complexity of data, smart data tools, Machine Learning, and Artificial Intelligence turn out to be the key part of the data harmonization process. They make it easier to prepare data from various sources, hence speeding up the adoption of big data techniques.
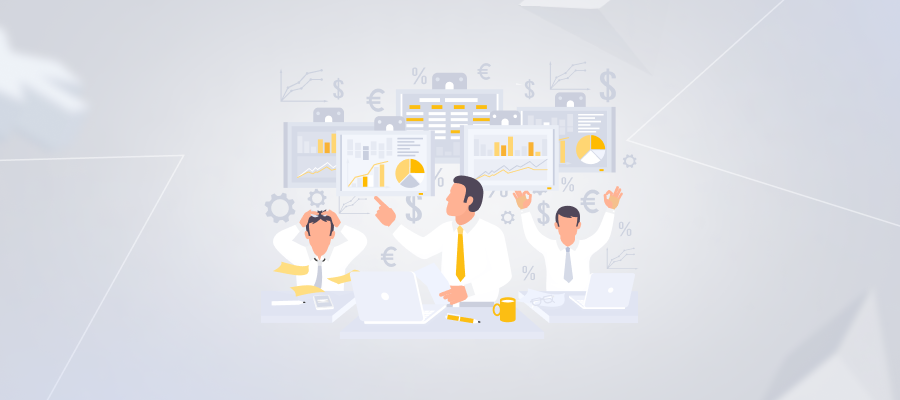
Data quality
Those, who at some point have analyzed data, understand the pain of discovering that it’s badly structured, incomplete or overflowed with inaccuracies. There might be several reasons for that to happen. First of all, human errors. Even such a seemingly insignificant mistake as spelling can bring about difficulties in data analysis. Secondly, storing data in disparate systems leads to the fields with the same meaning but different names occurred across systems. Finally, analysts might not be aware of the changes made to data by data administrators or engineers. Anyway, whatever the reasons may be, dirty data needs to be fixed. Otherwise, there’s a good chance to end up with inefficient analyses and distrust in organizational data.
A high level of data quality can be achieved by improving company culture and assigning certain roles responsible for accurate data, adopting best practices like the data quality cycle, and embracing technologies that support people in their processes via software features. Data quality cycle is made up of analyzing, cleansing, and monitoring data quality. Primarily, you have to define the data quality metrics that correlate with your business needs – you should understand what data to analyze and what makes data complete. Then, the data needs to be cleaned according to established business rules. And, certainly, to protect the quality of data, constant monitoring and checking of it is a must.
Do the adjustments that have to be made seem complex? You can start with a few data optimization initiatives and gradually evolve. If they turn out to be successful you may continue launching other ones. With reliable data at hand, it can’t be long before you notice the improvements in your business processes.
Legacy systems

Legacy software is a double-edged sword for a company’s future development. On the one hand, it has proved to be reliable. On the other hand – it’s rarely compatible with newly bought systems. Anyway, it’s a long shot for legacy systems to fade away. They usually support a company’s mission-critical operations so replacing them becomes a daunting task.
A tremendous amount of business data and processes is tied up in legacy systems, but accessing that information and integrating it with other database systems can be very difficult. And, yet, no matter where your data resides, it’s a vital asset that must be leveraged to its fullest potential.
Fortunately for C-suites, who are not ready for major business transformations, a long-term software modernization project is not the only option. Another one is ETL (Extract, Transform, and Load) data integration. It’s a three-step process in which data is extracted from one or more data sources, converted into the required state, and loaded into a data warehouse. Being equipped with connectors that allow an enterprise to combine legacy data with data collected from new platforms and applications, ETL makes your legacy data available. This provides a historical context through which organizations can recognize long-term trends. Historical context helps companies to derive useful insights for better strategic decisions.
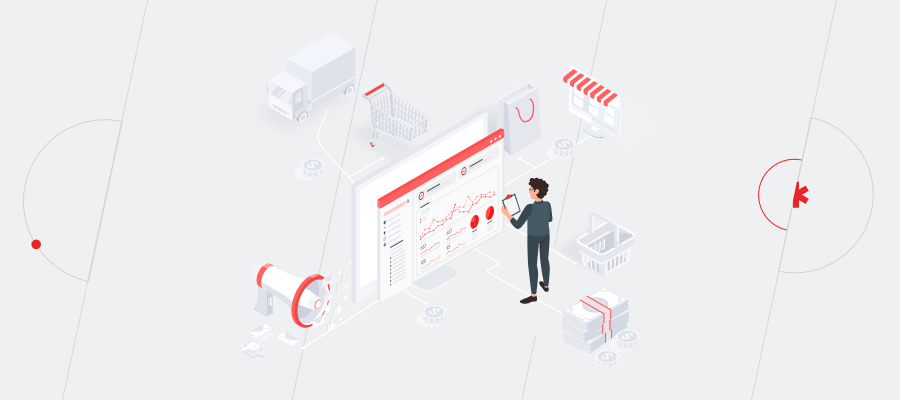
Unoptimized data
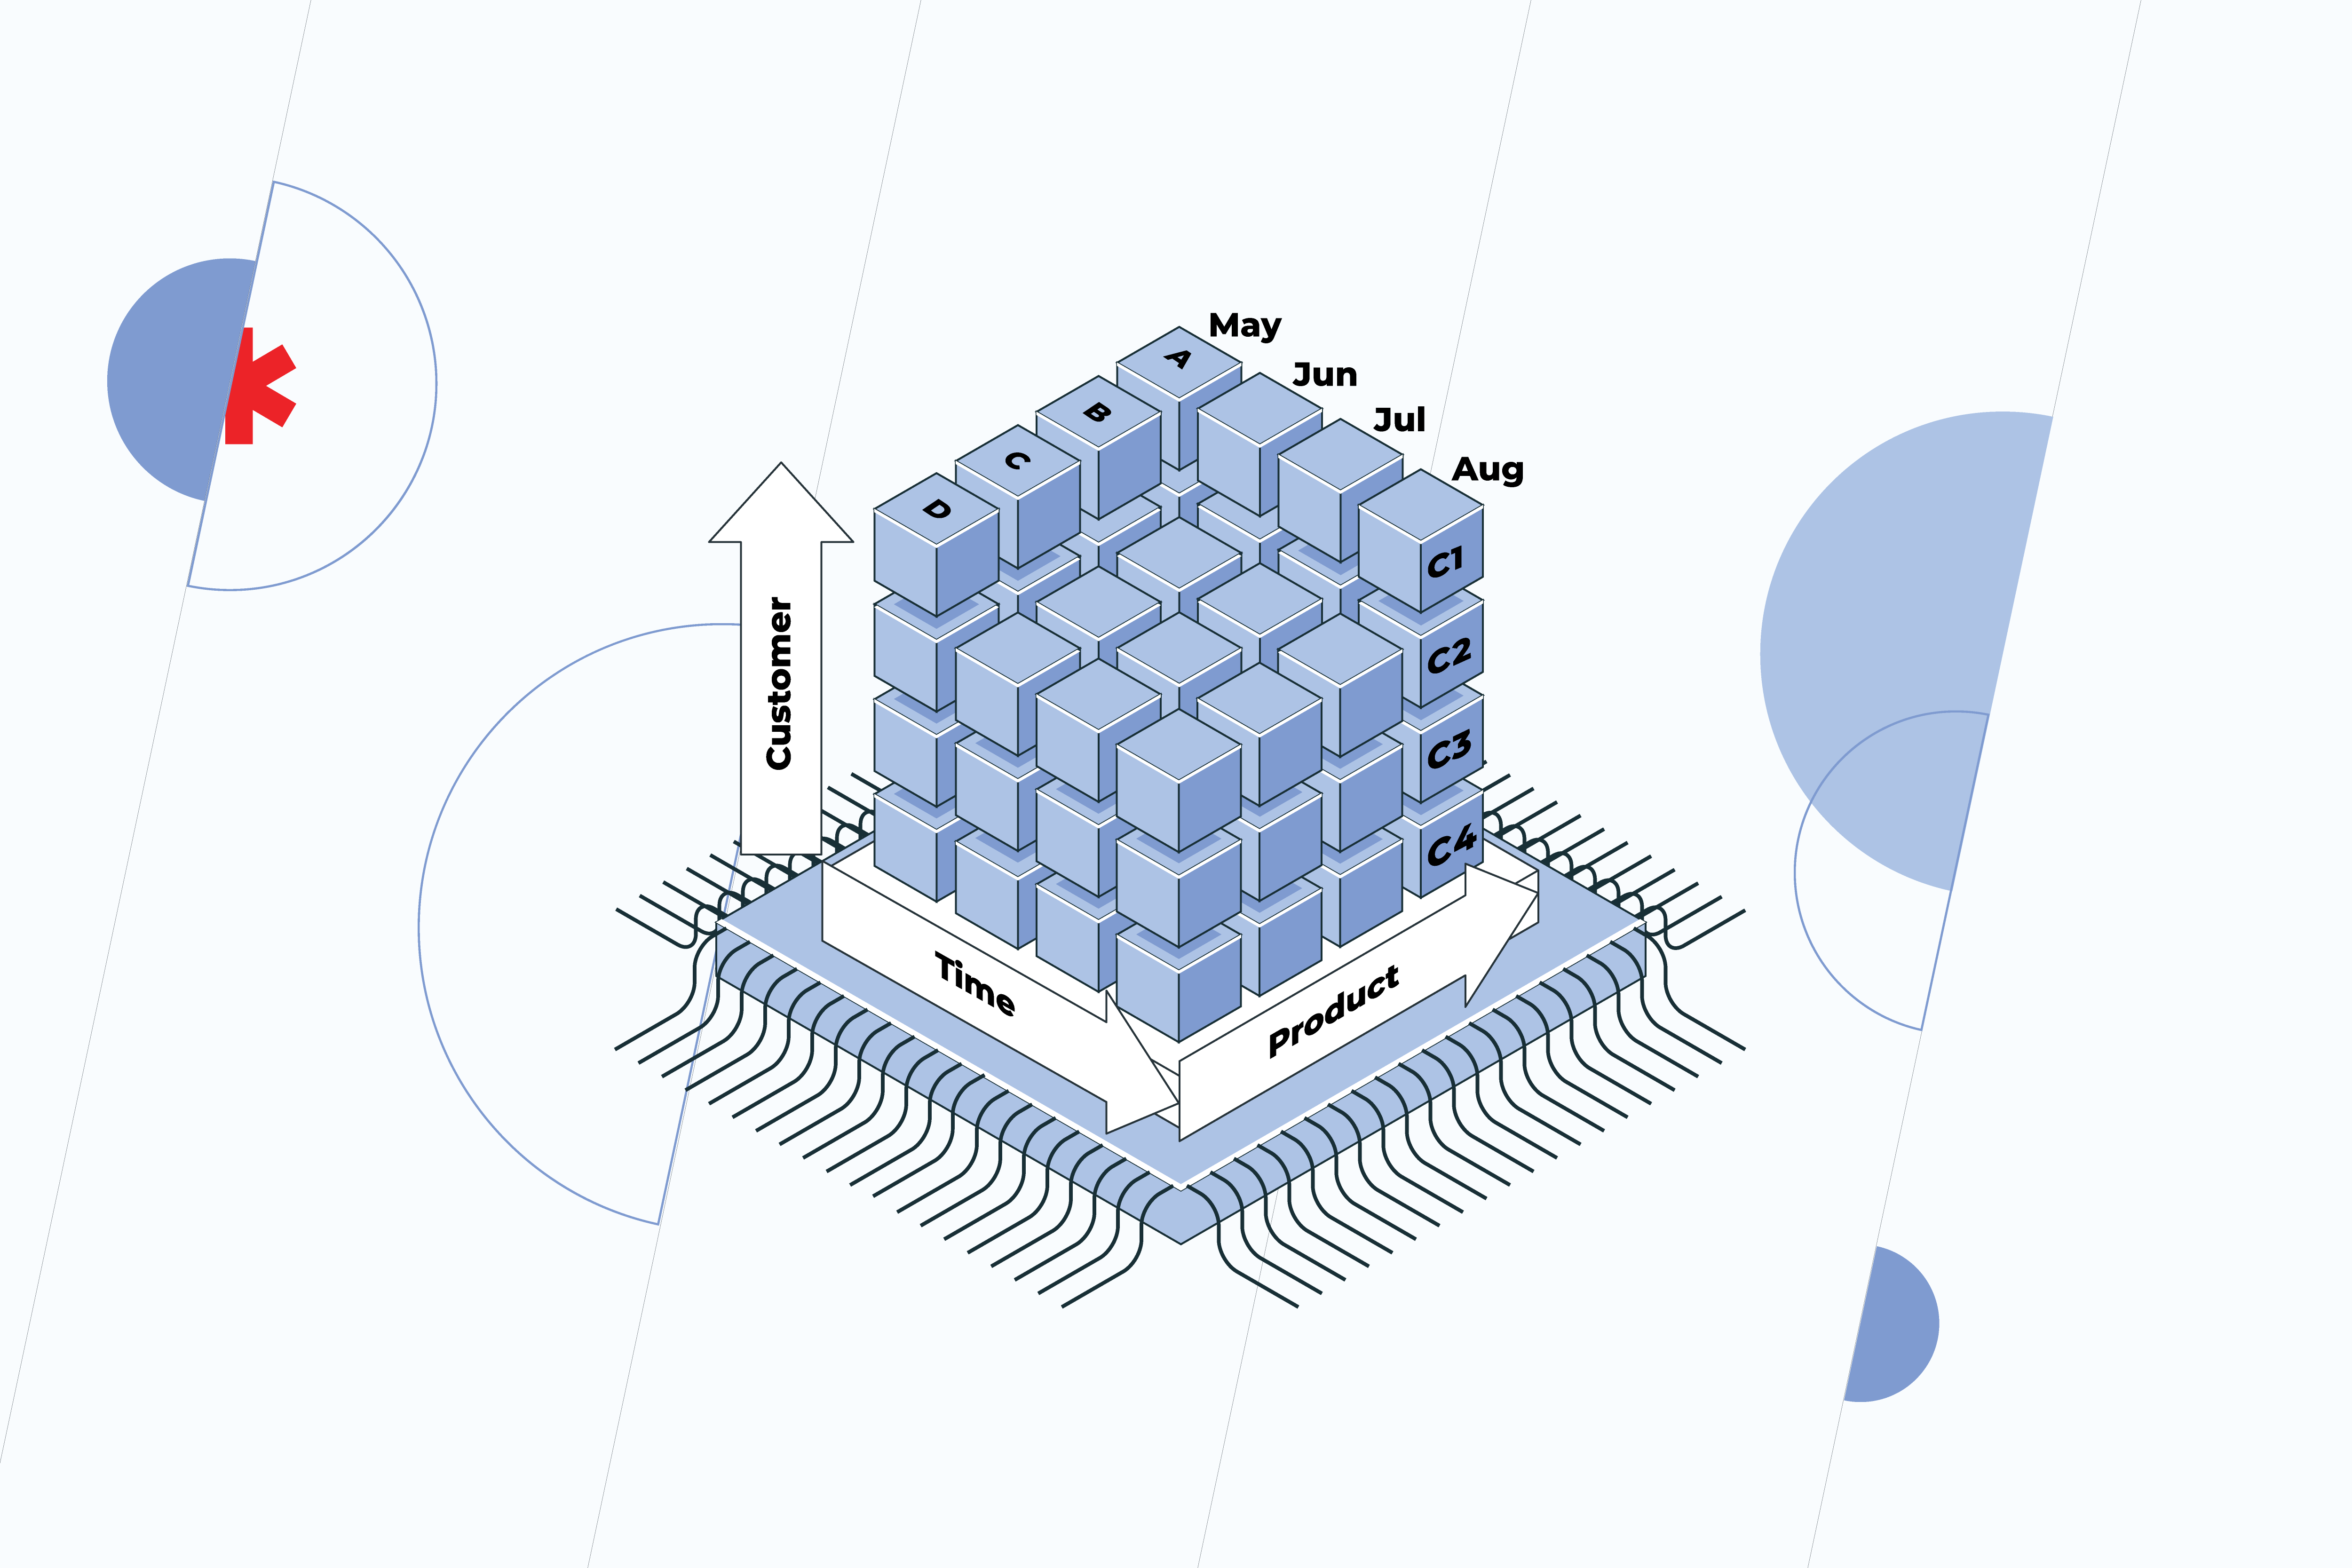
In a data-driven world, the more data is generated, the more important it becomes for organizations to be able to collect and analyze it. However, the question is how to get all the data together, translate it into a readable and clear format, and perform a holistic analysis without wasting tons of time? Querying data out of conventional relational database systems is quite difficult. Not only are queries slow, but they simply aren’t flexible enough to navigate the data. Thus, data analysis is a weak spot for many organizations. In contrast, analytic databases are specifically designed for users to easily find and extract the information they need. That’s why more and more companies are implementing Online Analytical Processing (OLAP) – software that allows users to examine data from multiple databases simultaneously. Its major value lies in a multidimensional approach to data organization and analysis. The OLAP system is represented by cubes – special data structures optimized for very fast data analysis. The cube is categorized by dimensions, such as location, time, customers, etc. Each dimension contains different levels that are organized hierarchically. For the location, these are countries and cities, for time – years, months, and days. Such an approach enables users to see information from different perspectives and quickly create adhoc reports. OLAP cubes are often pre-calculated and pre-aggregated across dimensions to drastically improve query time compared to relational databases. The data within the cube can be:
- rolled up (summarized along the dimension, e.g. moving up from a city to a country)
- drilled down (fragmented into smaller parts, e.g. moving down from a country to a city)
- sliced (by selecting a single dimension, e.g. a “slice” for time)
- diced (by selecting several dimensions, e.g. a “slice” for time and location)
- pivoted (by rotating data axes to gain a new view of data)
All in all, instead of collecting and validating the data using endless Excel sheets, OLAP technology allows users to enter the data directly into the multidimensional database, which significantly simplifies the analytical and reporting processes.
Addressing the challenges of integration is the first but crucial step toward transforming your data from some random figures into information that actually works for you. Ready to take a step forward? Find out more about how we can help.