When Cloud Meets BI: Cloud BI Solutions to Refine Your Business Results

When combined with cloud technology, business intelligence hits its stride in the form of cloud BI solutions.
For quite a while, the cloud has been viewed as the rescuer of business processes. Its speed and scalability are essential to embrace digital business opportunities. Business intelligence is another significant factor that allows organizations to generate value through high-quality and blazingly fast analytics and reporting.
54% of enterprises have already cross-bred these two and claimed that cloud business intelligence solutions are essential to their current and future initiatives. Let’s see why yet another business infrastructure blends well with cloud computing.

What is cloud business intelligence?

Cloud-based business intelligence, or cloud BI, refers to the process of consolidating and crunching data with the help of cloud computing — either partially or fully. With unmatched scalability and processing speed offered by the cloud, companies can pull new meanings from their data across a wide range of devices and applications with none of the overheads associated with locally run infrastructures.

How does cloud BI work? 

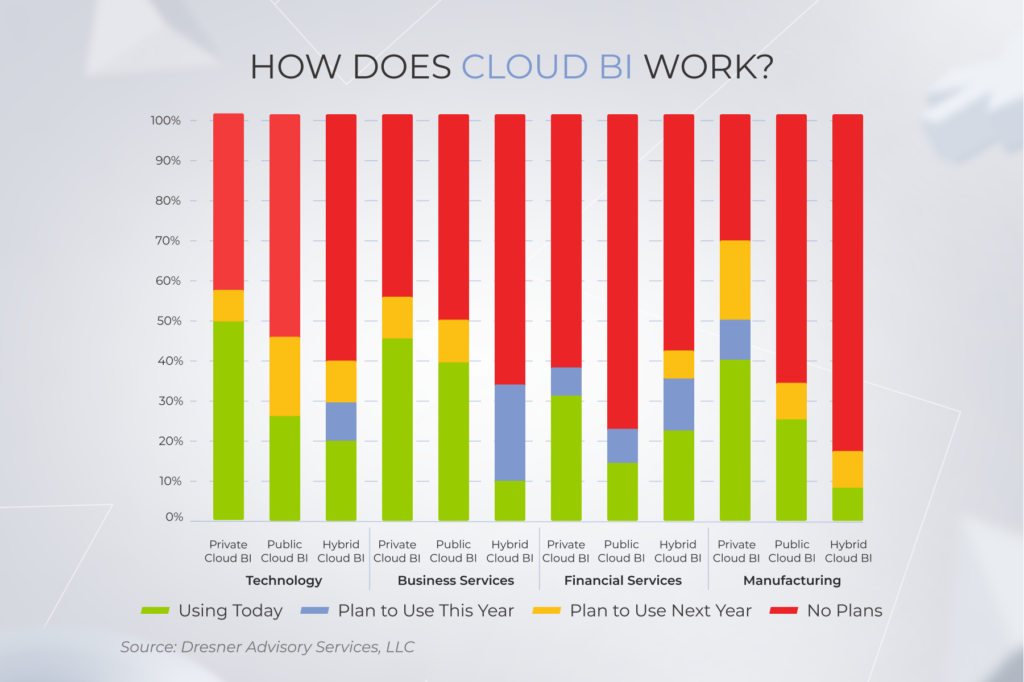
When it comes to deploying business intelligence on the cloud, organizations have three options: private, public, or hybrid solutions. While each of the three, abstracts, pools, and shares scalable computing resources across a network, they all differ by the control level over the infrastructures. 

Private

This type of cloud-based analytics business intelligence is premised on rented, vendor-owned data centers. Unlike the popular opinion, privately-run cloud, BI can be located off-premises, yet it’s still dedicated exclusively to the needs of a particular company. 

This type of cloud-based business intelligence software is usually a go-to option for compliance-heavy organizations that have to adhere to regulatory compliances.

Public

Public cloud business intelligence is accessed as an on-demand software-as-a-service solution. Public BI applications cater to multiple companies and are under a full dominion of a cloud provider. As the cost is divided among all tenants, public business intelligence is greatly favored among small- and mid-sized businesses with middle to low regulatory compliance needs.

Hybrid

This access model is the middle ground between private and public environments. A hybrid cloud infrastructure runs business-critical workloads on private clouds, while less sensitive data flows into the public cloud assets. The two environments operate seamlessly side-by-side and allow workloads to move between the two interconnected environments.
Cloud BI Solutions

Cloud-based business intelligence architecture

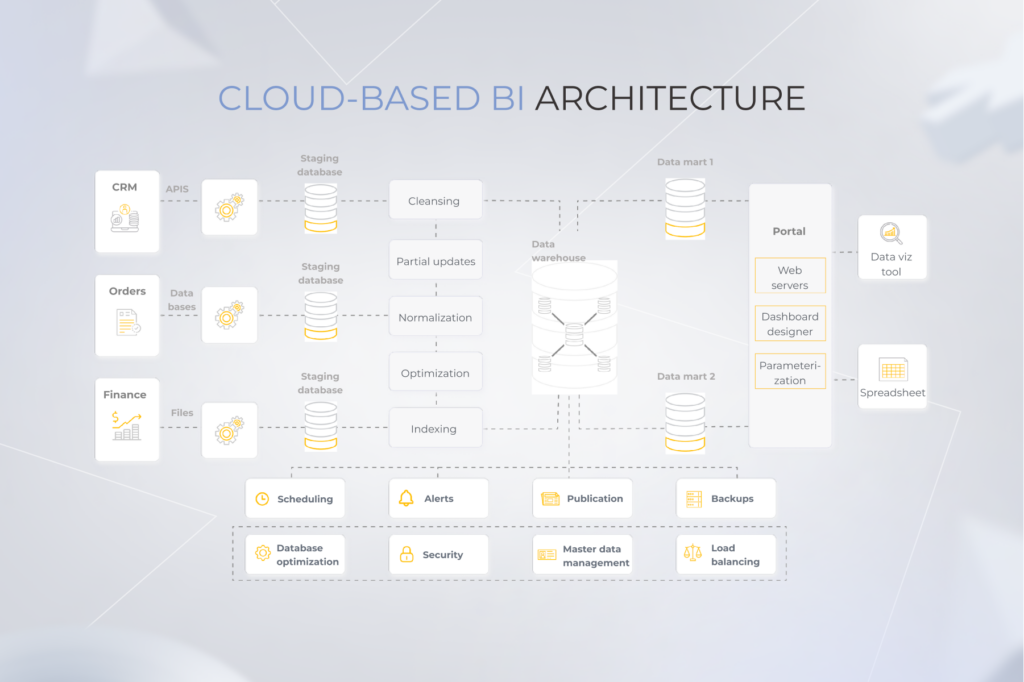
Cloud BI solutions thrive on an integrated and unified data hub that further sets data analytics in motion. That’s why cloud business intelligence tools need a data warehouse to manage disparate data flows and bring data from various sources under one hood. 

A data warehouse has the upper hand over on-premise warehouses as a more scalable, flexible, and all-in data storage option with less routine management burden and a shared pool of computing resources. Companies are no longer shackled to physical data centers and can dynamically ramp up or down their storages to meet evolving business needs. 
Cloud BI Solutions

But how does all data end up in a warehouse? A cloud BI ETL (extract, transform, load) process is what helps transform raw insights and inject storage-ready bits from multiple points into a single data warehouse. Using cloud-based ETL technology, companies can automate the whole data lifecycle and copy source data to the warehouse destination regularly to facilitate data import.

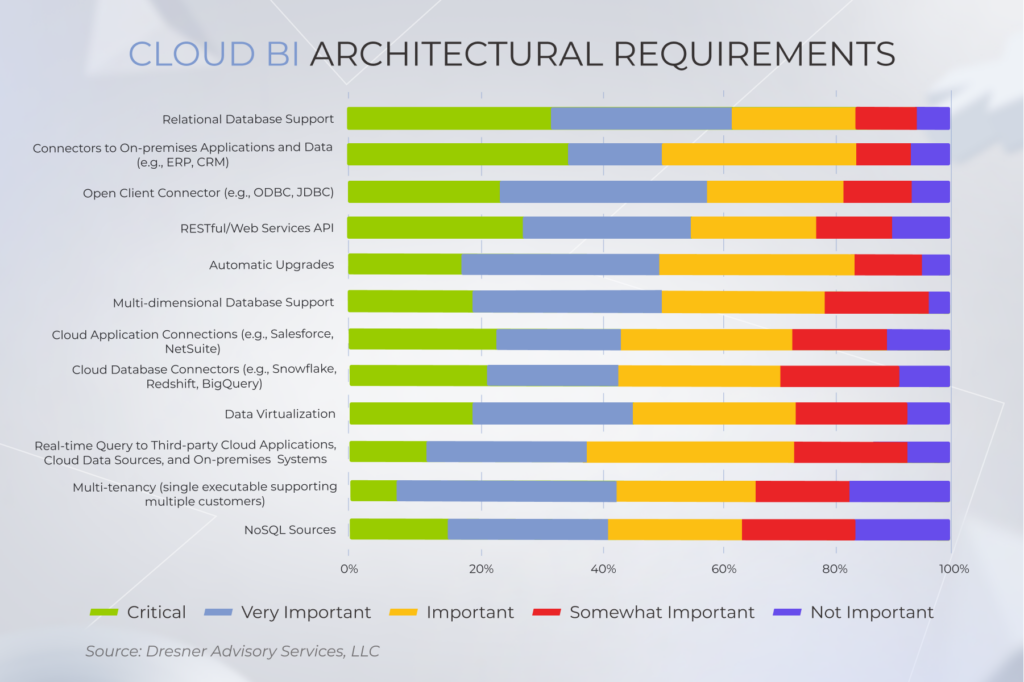
Besides a data warehouse and ETL, organizations need a few other add-ons to stoke up their cloud BI software. According to a report, users give high marks to relational database support as an element that connects data from different tables (transactions, customer information, etc.) to a cloud data warehouse for a more comprehensive assessment of business performance. 

Compatibility with on-premise digital estates such as ERP and CRM and open client connectors are also critical priorities for seamless data sharing with cloud architecture. NoSQL source support sits on the sidelines of architectural priorities, suggesting that the public cloud is mostly viewed in the context of standalone applications. 
Cloud BI Solutions

Want to build a high-performing BI architecture?

Reach out!

What can you gain from cloud BI solutions?

By 2028, the global cloud analytics market is slated to reach over $86 billion, driven by the data connectivity imperative. Here are the core advantages of cloud BI that contribute to its proliferation.

Fast and easy implementation

Since cloud business intelligence doesn’t require any additional hardware or software installations and cluster set-ups, it takes off faster compared with on-premise ecosystems. A wide range of baked-in features, modules, and governance measures put up to the speed and ease of implementation provided that you know your way around all configurations.

Ease of use 

Cloud BI tools enable self-service insight gathering through simple questions, easy visual analysis, and an intuitive web-based authoring interface. The miscellany of guided workflows suggests minimal adoption barriers for cloud analysis, resulting in higher user buy-in and a low learning curve.

Scalable resources

A cloud architecture auto-scales to growing users with high availability and dynamically allocates resources to match evolving BI initiatives. It means that teams don’t have to build up databases for high workloads immediately, and can easily scale up or down computing resources on an as-needed basis.

Cost savings

The cost reduction potential of cloud BI stems from lower CapEx as you don’t have to spend money on hardware. It gets tricker with operational expenditure where a medley of configurations enters the equation. Without a dedicated team, you risk throwing money down the configuration drain as you fine-tune your cloud domain.

CriterionCloud Business IntelligenceOn-premise BI system
Initial investmentLowHigh
Associated IT costsLowHigh
ImplementationFastLong
Level of customizationMedium to lowMaximum
Data security managementVendorCompany
Total cost of ownershipPredictableEvolving

Advanced data sharing

Cloud analytics is the epitome of collaborative knowledge-sharing and joint workflows as it allows any team member seamless and on-the-go access to the data estate. The infrastructure also allows you to blend data from on-premise and cloud, and augment it with real-time and web-based insights within a single interface.

Automatic updates 

Update management is an irritating inconvenience for on-premise estates that gets hassle-free in a cloud infrastructure. Cloud service providers usually cover hosting, maintenance, and updates so that you can focus on mission-critical tasks.

Rapid data processing

For complex and hefty analysis, companies can leverage high-performance computing available on the cloud. Available at an additional cost, cloud rapid data processing can speed up resource-intensive analysis without a swath of hardware while rechecking your input for maximum accuracy and consistency.

Ease of integration

Although both local and cloud business intelligence boast rich data integration potential, cloud tools still excel at built-in data connectors. Companies can instantly go from data to insight to visual display by integrating all data into a cohesive whole from databases, online services, and other supported data connection types. 

Conversely, on-premise solutions require a more dedicated effort to set up an integrated blanket of data due to the lack of ready-to-go data connectors.

Security & Compliance

Cloud BI compliance benchmarks provide good baseline security as cloud providers focus on the ever-changing regulatory landscape. A BI solution helps you take care of common industry-specific standards and local regulations by offering robust built-in security measures and compliance enablers — gift-wrapped.

Analytics tools keep your guard up with data encryption, automated security updates, multi-tiered caching, and advanced authentication measures. It’s like having a whole team of data security experts at your disposal instead of wading through guidelines and acting on your own.

Learn how to make the most of cloud BI benefits

Drop us a line

What to pay attention to in cloud-based business intelligence software?

A business intelligence tool is an umbrella interface made up of various components to uncover, analyze, and report data from a wide array of data sources. Although the stuffing differs by solution, any BI tool needs four main ingredients to convey the taste of data excellence.

Data management

From data quality to security to governance, an end-to-end data management strategy demands a multidisciplinary approach reinforced by the company, its people, and its digital ecosystem. 

A cloud-based BI tool cannot make up for a holistic data management regimen. But it can become your most integral asset that promotes better data health by integrating, contextualizing, analyzing, and protecting your data assets. 

Some BI solutions provide in-built data management capabilities that help you prepare, model, and bring your data to life within a single interface. The Microsoft BI stack is a prominent example of end-to-end analytics architecture that guides each step of your business intelligence journey with a variety of purpose-built tools.

Advanced analytics

Complex analytics capabilities turn descriptive insights into prescriptive knowledge. This is why your business intelligence system should be premised on built-in AI capabilities, such as image tagging, sentiment analysis, and others, to make every bit of data work to your advantage.

Data visualization and reporting

Visualizations make insights more digestible for all decision-makers and help your data tell stories, instead of throwing puzzles in a spreadsheet of numbers. A BI tool should allow you to slice, filter, highlight, and drill into visualizations with built-in charts, graphs, and maps, along with custom drag-and-drop dashboards. 

Collaboration

Finally, a tool should promote unified team efforts through multiple collaboration channels and sharing options. Some solutions also have a presentation mode to display reports, an embedded functionality for seamless data-sharing, and shared datasets for user-based report creation.

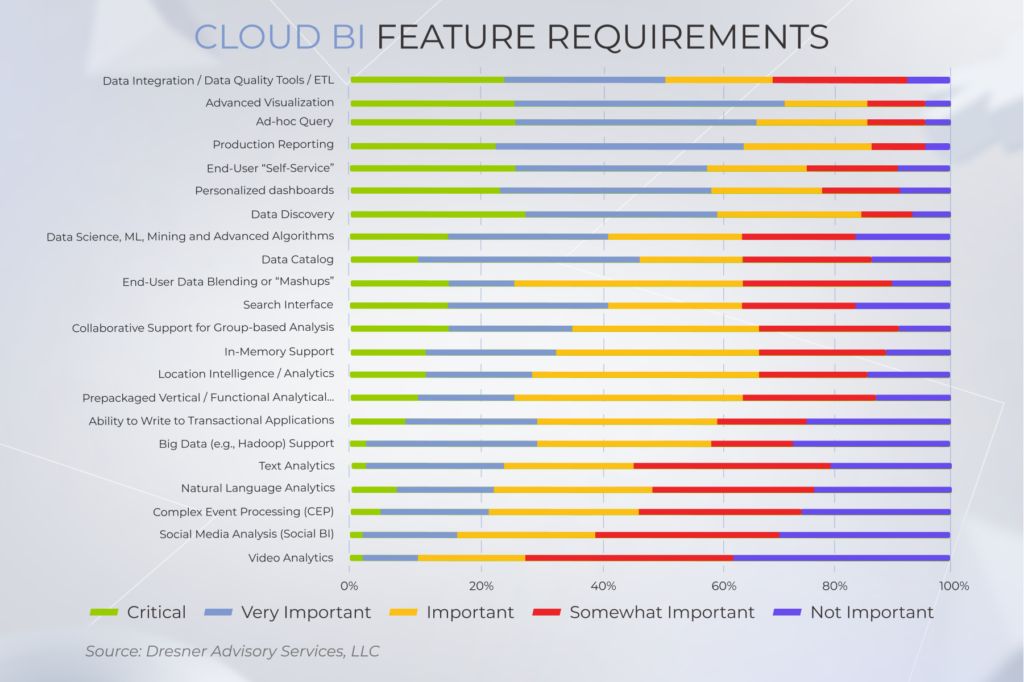
According to a report, other BI mainstays include an ad-hoc query for more niche business questions, production reporting for manufacturing companies, and self-service capabilities for IT-independent business units. The percentage distribution also suggests a direct correlation between the set of features and a user’s job function.
Cloud BI Solutions

Set up your BI initiative for success

Get in touch!

Who can benefit from cloud BI solutions the most?

Over the last few years, business intelligence has emerged as a game changer for different industries. However, some verticals have hit the mark with cloud analysis. 

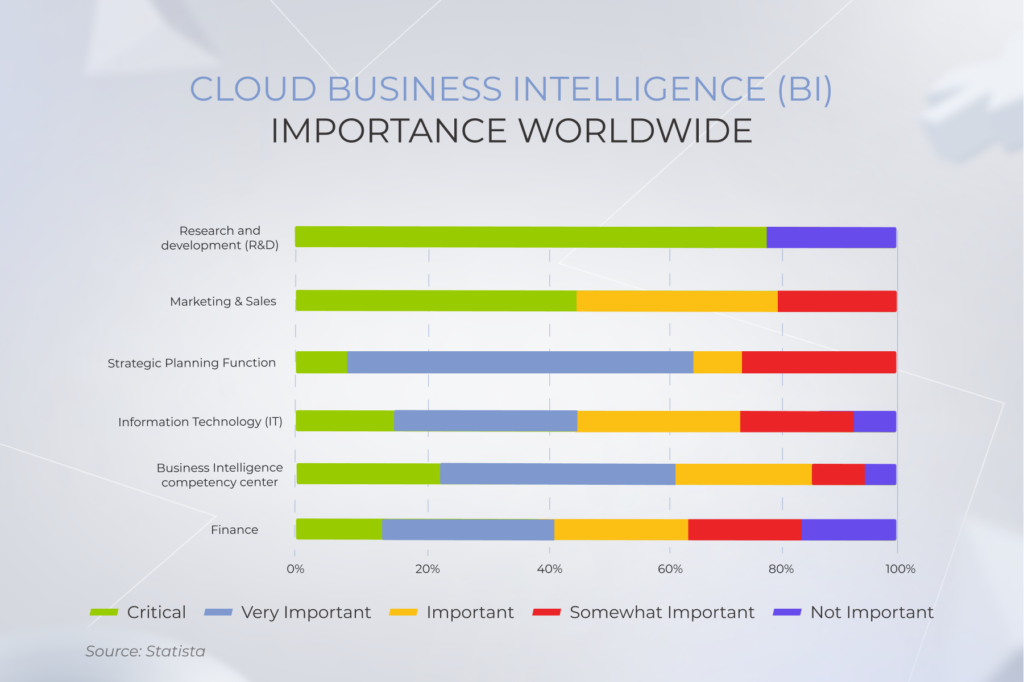
According to Statista, marketing and sales stand as the biggest gainers of cloud BI, with 50% of respondents marking this asset as critical for their importance. The R&D area has seen a growing importance of BI as well, – with 42.5% of respondents reporting its critical potential. 
Cloud BI Solutions

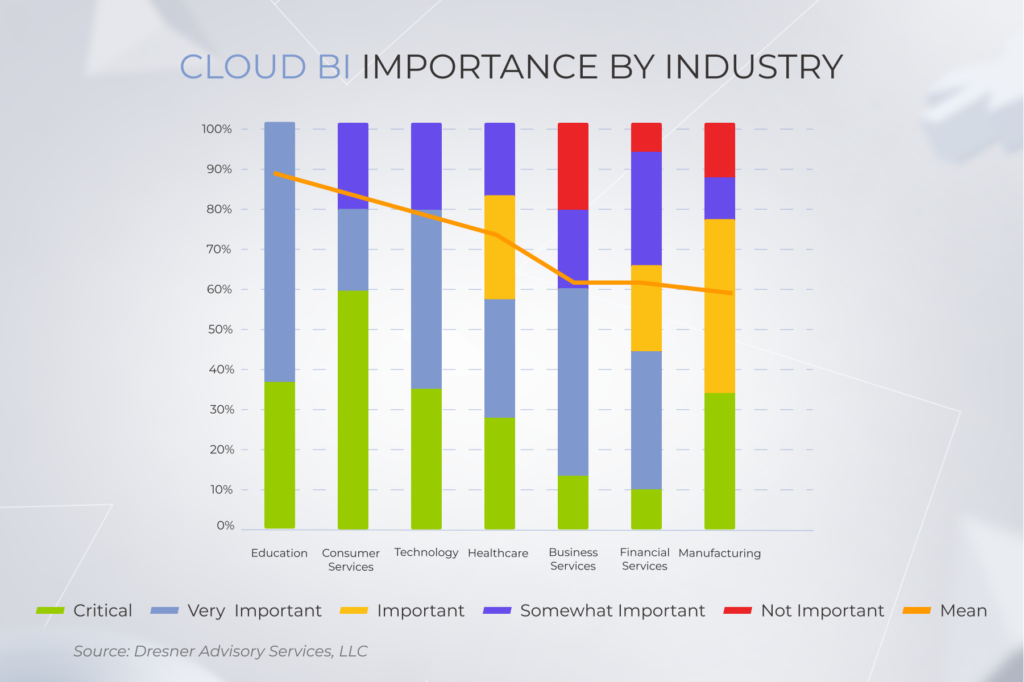
Another report demonstrates a weighted-mean interest in cloud analytics in higher education and customer services, while healthcare and financial services are still testing the waters of business intelligence.
Cloud BI Solutions

This upward tendency in certain industries implies a tie-in to the growing data in the fields, the demand for greater business flexibility, and the need to measure business performance at scale. All these and more are conveniently packed into cloud business intelligence. 

Which cloud BI provider to choose?

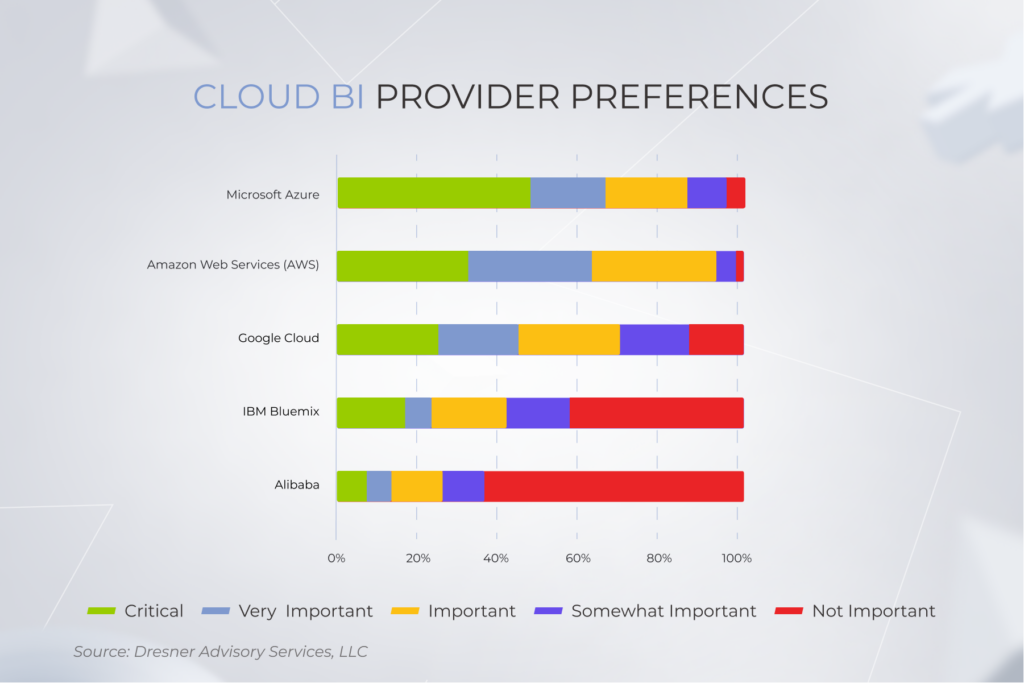
Your business intelligence initiative doesn’t need to be a big bang from the start. You can start small by testing popular SaaS solutions from renowned cloud providers. Microsoft Azure is an acknowledged leader in the field, with 77% of users reporting its critical or very important impact.  
Cloud BI Solutions

The positive user sentiment is well justified for Microsoft Azure as it offers the complete suite of data analytics, BI, and visualization tools on top of its mature, cloud ecosystem. Backed by a multi-layered security approach with 96 compliance offerings, Microsoft Azure helps companies use their data strategically and safely with no back-and-force of third-party tools.

The dominance of Microsoft Azure is indisputable. This ecosystem has your data worries covered on all tracks with data lakes, Power BI, Azure Synapse Analysis, and whatnot can be built with Azure Stack.

As a Microsoft consulting partner, *instinctools helps companies accelerate Power BI adoption and optimize this cloud ecosystem to fit their unique business and data needs. 

Amazon Web Services and Google Cloud Platform also sit on top of leading BI platforms with 66% and 41% combined critical and very important scores, respectively. Both allow users to explore data through interactive dashboards, pattern detection, and outliers powered by machine learning.

The powerful duo of business intelligence and cloud

In an increasingly winner-takes-all business environment, any organization that doesn’t put its data to good use lives on borrowed time. Cloud BI tools help you achieve business impact with data and get a comprehensive perspective — at any time, at reduced costs, and at your convenience. Powered with analytics and visuals, cloud BI solutions give voice to your data and help you translate the language of numbers into the language of action.

Need help with your cloud BI tools?

Contact our experts
Cloud ERP vs. On-Premise ERP: Which One Wins the Duel?| Expert’s Opinion

Over the last few years, ERP systems have become imperative for streamlining enterprise operations and maintaining business resilience. The pandemic-induced shock has also contributed to an upswing in resource planning software. As a result, the global market of ERP digital solutions is projected to hit over $93 billion in 2028. But while the bright prospects of ERP systems are statistically proven, the dilemma of cloud ERP vs on-premise hosting remains unsolved.

Each option has its advantages and limitations, and you have to find a balance between a bunch of factors. You need to consider the cost of ERP ownership, your requirements for system performance, its customizability, and many more. In this article, we’ll look at these and other main debating points of cloud ERP vs. on-premises ERP through an expert prism.

Key considerations before going for cloud vs. on-premise ERP

According to Accenture, around 58% of companies prefer private or public cloud-based ERP systems. On-site platforms make up 25% of all ERP software. While these figures may already suggest the winner, the choice of cloud vs on-premise ERP depends on a whole range of factors.

Cost of ownership

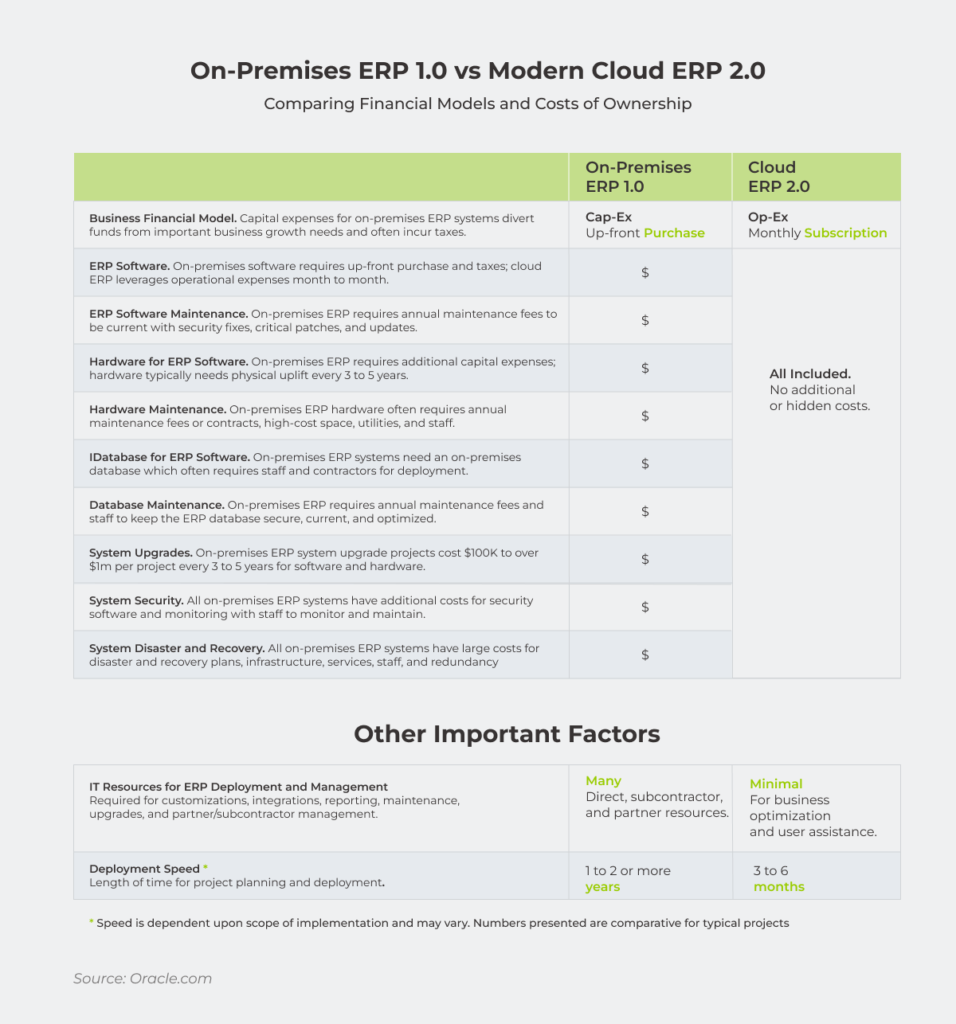
Comparison table on cloud ERP vs. on-premise ERP costs of ownership

The question of costs is one of the first to surface when debating cloud ERP vs on-premise one. Cloud-based enterprise systems can be purchased and governed without large upfront costs. Cloud users are charged a recurring fee which can go up or down based on the resources used and the number of users.

Operating expenses such as infrastructure maintenance, recovery, updates, and others lie on cloud providers as well and are distributed among all cloud adopters. It means that cloud-based ERP software translates into total cost-of-ownership savings thanks to the shared business model.

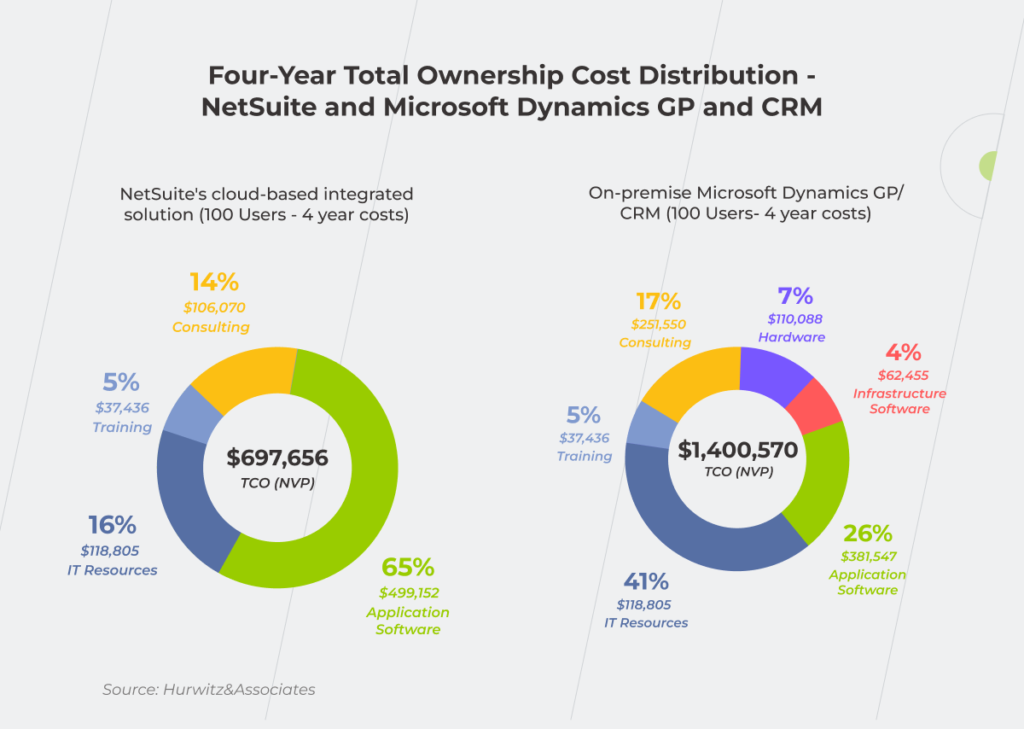
Moreover, the absence of additional IT infrastructure costs for the cloud solution also contributes to the cost-saving potential of a cloud ecosystem. This has been highlighted in the TCO case by NetSuite, where small and medium businesses have seen lower overall TCO for a cloud-based NetSuite system compared to on-premise enterprise platforms.

Statistics on the four-year TCO distribution within cloud-based and on-premise systems

Conversely, local systems imply a higher initial investment for adopters. Companies also cover hardware costs, database maintenance, security, and other capital expenditures, all combined into a significant initial outlay. However, there are more and less cost-efficient options among on-premise ERPs. Let’s take SAP vs. Odoo as an example. When opting for SAP, you have to pay for maintaining servers and a license fee, while on-premise Odoo is license fee-free.

Therefore, cloud solutions are more affordable for businesses looking for a lower initial bid price.

System performance

Critical business applications must be available 24/7, making uptime and reliability paramount for enterprise business management systems. At first sight, cloud servers give odds to on-site systems due to automated monitoring, disaster recovery, easier back-ups, and downtime expectations which are the core prerequisites in cloud SLAs. 

Moreover, data centers scattered across different locations eliminate a single point of failure, making your data accessible even if one of the cloud servers shuts down. 

Unlike cloud-based solutions, with your data backed up by different instances, an on-premise system won’t work if your server crashes. Therefore, an on-site enterprise takes diligence and dedicated resources to ensure minimized downtime and stable performance.

Yet, distributed servers aren’t immune to unplanned outages, leaving business owners at the mercy of connectivity issues. And in this case, an outage or unstable internet connection can knock out your access to important files and enterprise applications.

Security

Companies seem to place a high degree of trust in cloud data security, with 48% of organizations storing their critical data in the cloud. Indeed, cloud ERPs come with in-built advanced security measures beyond what most businesses can afford. Role-based access controls, end-to-end encryption, threat detection, and other safeguards reduce the risk of a data breach or unauthorized data access for cloud adopters, and thus, minimize your data security concerns in general.

However, cloud-based solutions do not grant full control over your software and threat landscape. Also, if any sensitive data spills through the cracks, it’s the business that faces incurring costs and legal repercussions. Cloud misconfigurations also account for 15% of breaches.

With on-premise ERP applications, you are in charge of data governance and the entire infrastructure, which makes it possible to implement tailored security measures and meet strict security requirements relevant to financial institutions or governmental organizations.

Integration

Cloud ERP solutions offer rich integration capabilities that help connect software applications for better visibility and data interoperability. With low maintenance and easy deployment, companies can set up the cloud ERP infrastructure from a variety of stand-alone modules based on their business processes and needs. Odoo-based ERP solutions, for example, allow businesses to join a broad spectrum of business apps into a centralized well-integrated system.

But despite a plethora of integration options, cloud integrations are still tied to a limited number of connectors. Therefore, you might not be able to cover all the integration needs or establish a seamless connection with other internal business systems.

On-premise ERP solutions, on the contrary, bode well for bespoke integrations that do not need an Internet connection. Yet, on-premise data connectivity calls for a dedicated IT team and a significant one-time investment.

Customization

Cloud ERP vendors offer customizable innovation as paid a-la-carte options. Since around 85% of business processes are the same across companies, standard cloud modules and extensions meet the majority of customization needs and best business practices.

But despite their diversity, cloud extensions tend to be more rigid, especially when it comes to individual ERP deployment. The collection of unique design changes, e-forms, integrations, and system dependencies are impossible to take into account with the generic cloud approach.

Local platforms take the lead in terms of customizations since your development team can adjust your ERP system to internal processes. Yet, custom deployments and configurations come at a high cost and require rich tech expertise.

Let’s make your ERP a success together

Get in touch!

Control

Ownership of data is another big rub in the duel of ERP cloud vs on premises. Legal concerns, vendor lock-in, and unpredicted fees incur risks to business operations and a company’s well-being. Since the cloud provider can be legally considered a custodian of the data, your access to data assets can be suspended at the provider’s sole discretion during an investigation of any suspected violation.

On-premise ERP systems are based on single-tenancy infrastructure which keeps your critical data assets away from prying eyes. This way you have higher control over data configuration, security, and management because you can access the data physically. Full data control is especially important for mature enterprises with strict internal security standards.

Compliance with standards and regulations

Data governance and compliance issues have been plaguing cloud systems since the dawn of time. Over 50% of the companies struggle to meet compliance and audit requirements when employing Infrastructure as a Service cloud solutions. The root of compliance worries is often the shared nature of the cloud. Once an organization moves to the cloud, managing access controls or keeping an eye on the available compliance enablers becomes much more difficult.

But despite higher compliance risks, distributed cloud systems cover the majority of data protection regulations, including GDPR, CCPA, HIPAA, and others.

On-premise solutions help meet the evolving regulatory landscape thanks to full control over user access policies, security patches, and other compliance measures. Moreover, data localization regulations prohibit data from being processed in the cloud, making on-premise hosting the only option.

Updates

Dubbed better than on-premise software due to its flexibility, the cloud eliminates the hassle of maintaining software. Cloud ERP providers make sure you’re always running the latest ERP version with cutting-edge functionality, while your IT department can save the time and effort of installing new patches. However, the choice of updates is left to the vendor, putting you in a subjective position.

On-premise infrastructure makes updates more resource-intensive, yet grants full control over the choice of innovation.

Mobility and accessibility

Finally, ERP on premises vs in the cloud differs in how portable they are for users and applications. On-site platforms can usually be accessed locally. Remote access is only possible using VPN or remote desktop technologies. It can complicate the team’s collaboration and limit the accessibility of the system.

Conversely, the cloud is accessible from anywhere provided you have a stable internet connection.

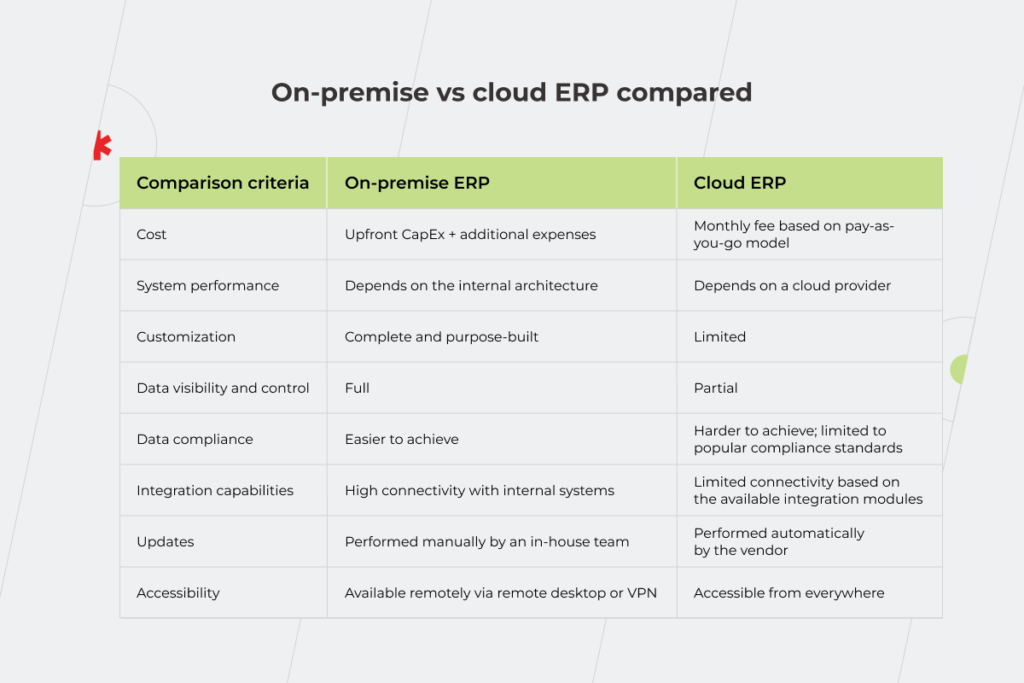
To sum up the differences between both systems, we’ve curated the main differentiators in a concise table below.

On-premise vs cloud ERP compared

Comparing cloud ERP vs on-premise software according to a variety of criteria

On-premise vs. cloud ERP dilemma: three questions to ask

Along with the criteria mentioned above, there are additional factors that should guide your choice.

What project timeline can you sign up for?

Cloud resource planning software is almost a synonym for fast and easy implementation. On average, an experienced development team can get your cloud solution up and running within a few days to a couple of weeks. The specific timeline can vary based on your migration needs and system maturity. On-site infrastructure is more time-consuming since it is built from scratch.

Therefore, if you’re aiming for reduced development time, the cloud is a great tradeoff between fast deployment and decent customization.

Do you need a unique solution?

The next thing to look at is whether the ready-made functionality covers your business and development needs in full. Contacting a team of specialists is the easiest way to validate each building block for your cloud ERP system.

However, if your business vision runs counter to a ready-made suite, a custom on-premise infrastructure is the best way to fill in the functionality gaps.

Should your system be able to scale?

Usually, resource planning platforms do not have ambitions for rapid growth or high workloads. However, scalability is still important to help your enterprise systems adapt to the changing needs and demands of your business.

In this case, cloud elasticity can easily attend to your scalability needs. On-demand cloud scaling allows you to ramp up or down your IT resources without building out more hardware. Conversely, on-site software is more challenging to scale, since it requires additional hardware, CPU, RAM, or other boosters.

In terms of scalability, cloud infrastructure grabs the trophy as an easily scalable enterprise solution.

Cloud vs on-premise ERP: which one is right for you?

The best ERP hosting solution will be unique for each company based on the budget, time constraints, compliance requirements, and other prerequisites. Cloud ERP infrastructure is the preferred solution for a quick and easy take-off that doesn’t need a large upfront investment. Locally installed systems grant full control over your assets along with unmatched customization and integration options.

If you are struggling to choose between on-premise and cloud, our vetted experts are ready to help you make the big decision. We can also take over your deployment needs and set up an ERP platform fully tailored to your business requirements. 

Ready to build an ERP on time and on budget? Reach out.

Big Data Security Concerns for 2025 and Beyond

Nearly 97,2% of firms invest in Big Data initiatives, confident that data will give them a serious leg up. In reality, only 1 in 4 business executives see profitability in their efforts. Among the biggest hurdles blocking payoffs — cited by 36% of surveyed leaders — are Big Data security concerns.

This article outlines the common security concerns related to Big Data and provides you with results-oriented methods to protect your sensitive data.

Big Data complexity and collateral security issues

Because of the Big Data diversity, its security can be viewed from two sides — corporate data and customer data. Organizations should be aware of business data security as the data loss of proprietary information is equivalent to exposing your weak points to your competitors and handing them a competitive advantage on a silver platter. 

Imagine a logistics provider that has prepared a special transportation offer for its clients over the Christmas period. What if information about it leaks out right before the holiday season? Knowing the targeted audience and specifics of the promotional offer, your competitors will have the opportunity to improve their advertising campaigns and make them more attractive than yours. 

Though business data leakage is one of the large-scale issues of data security, it affects only the organization itself. But along with corporate data, companies also keep sensitive data about their customers. In case this information falls into unreliable hands, the severity of the problem skyrockets as more than 90% of people state they want to control who can get information about them.

Leakage of customer data might have major repercussions for the company in terms of the compensation fee it’ll be liable for and losing the clientele to competitors that offer the same services but with higher security levels. The largest recorded U.S. data breach in the healthcare sector was in 2015 at Anthem Inc., a health insurance provider in the United States when criminal hackers stole sensitive data affecting 80 million individuals. After two years of litigation, Anthem paid $150 million to settle lawsuits over the incident. 

The recent breach involving National Public Data, one of the biggest background check companies, exposed 2,9 billion records of sensitive personal information — names, social security numbers, and addresses. Much of the data was put up for sale on the dark web for $3,5 million. As of January 2025, the company has yet to fully resolve the damage, although it has acknowledged the breach and is cooperating with law enforcement. They’ve even filed for bankruptcy, citing the financial blow from the incident as a key factor.

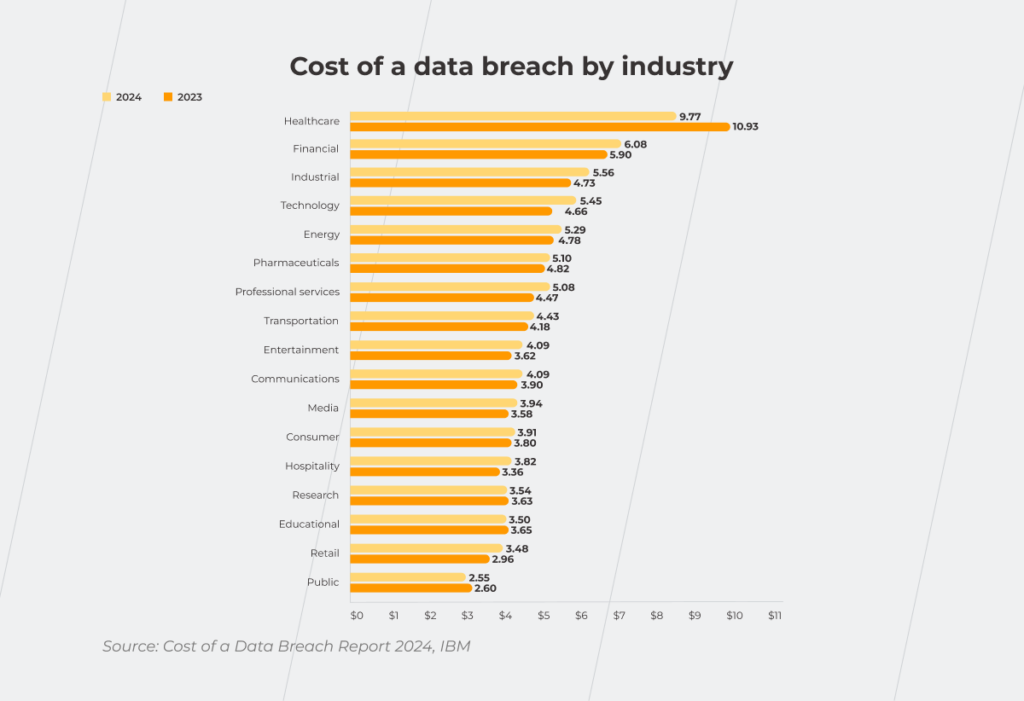
Cost of a data breach by industry, 2023-2024


What security best practices can you leverage to protect your business and customers’ data considering the diversity of data structure and format, storage location, origin source, device type, etc.? We’ve listed seven common data security problems and their solutions.

1. Network perimeter insecurity

When information enters a company’s network, it goes through various security checks. But if your system fails to separate potentially destructive data among incoming data, it can get into the infrastructure and cause a lot of damage.

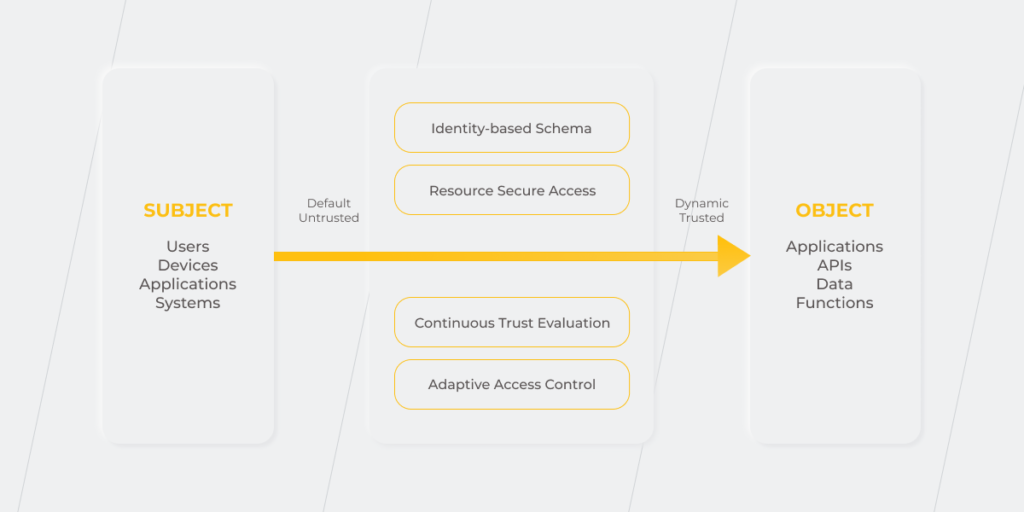
Cyber-attacks are continuously evolving and becoming more sophisticated, so organizations should rethink their Big Data security management and adopt zero trust architecture solutions. These assume a dynamic digital identity-based perimeter and approach where any user or device, application or system, outside and inside the network, is classed as untrusted by default. In this case, organizations’ resources are secured regardless of their location because access control moves from the perimeter to each device and user, and the network is divided into micro-segments to make it harder for hackers to attack.

Zero trust architecture: key capabilities

2. Social engineering attacks

A classic example of this type of attack is known as phishing. This is when attackers send you messages that seem to be from a known, trusted source but, in reality, are malicious. If your employee unknowingly clicks on an untrustworthy link, hackers can access the corporate network.

Implement gateways to prevent scam emails that may contain spam, malware, or phishing attempts. Gateways are useful for identifying bad emails thanks to their antivirus, anti-spam, and anti-phishing functions.

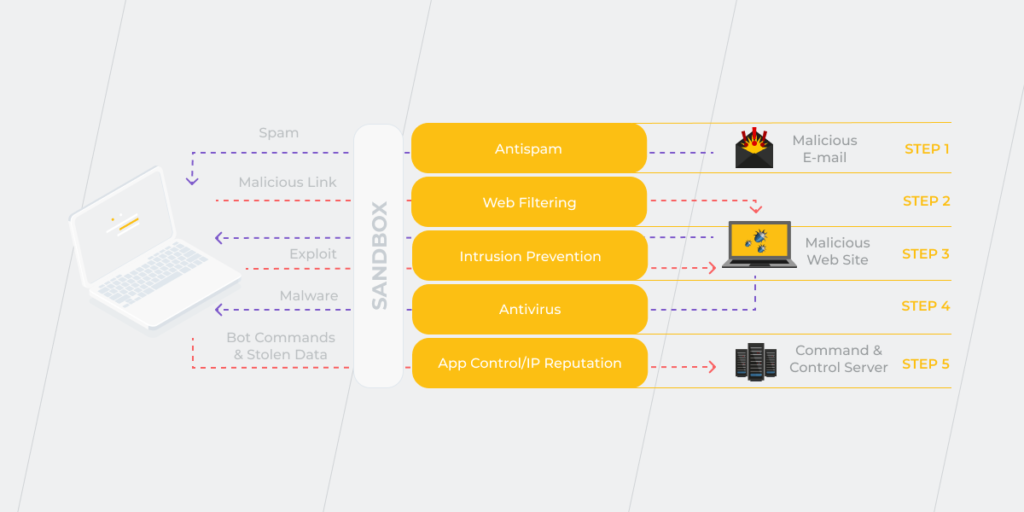
But what if the malicious link isn’t in the email but in an attached PDF file? That way, gateways won’t identify the suspicious email and quarantine it. To confront the current data security problems and threats, take advantage of the additional features the gateways can provide you with, such as a sandbox. It’s a safe isolated replica of your real environment where you can open potentially malicious letters without impacting a system or platform on which they run. 

Email sandboxing architecture

3. Data cleansing problems

Big Data is known for promising benefits such as improved decision-making, but to get valuable data, you should first separate the wheat from the chaff and deal with the dirty and messy data. Otherwise, you’ll get stuck in a vicious cycle of poor data and a garbage-in-garbage-out trap. 

Here’s where an automated data cleansing process enters the battlefield to provide you with correct, complete, and properly formatted data from your warehouse stores. But if those tools are not configured correctly, data cleaning will result in inconsistent data and Big Data analytics security concerns won’t go anywhere. An algorithm can fail at the data classification stage — it may define sensitive data as normal and share it with a wide range of people. 

4. Flawed data masking measures

Organizations adopt data masking policies to distinguish data that identifies customers (characteristics by which one person differs from another, such as date of birth, name, and age) from confidential information about them (data that also is connected to a customer persona, but is changeable, like home address, driver’s license number, bank account number).

The purpose of data masking is to prevent big data security risks by stopping cybercriminals from matching customers and their sensitive information. If data masking is done incorrectly, it can be reversed by hackers.

A key solution for securing big data is data encryption. But it takes time to implement effectively, so how to keep the data processing speed up (since velocity is one of the five core Vs of Big Data along with variety, volume, value, and veracity)? Use these techniques of data encryption at the last stage of data processing to ensure big data security.

  • Data scrambling. Input data characters are randomly reorganized and replaced in data storage.
  • Data substitution. Fake data replaces real information, you can use random names from a phone book instead of real customer names. 

In both cases, original data is still available at your warehouse or data lake. You use substituted or scrambled information to make decisions as you can’t use sensitive data for those purposes according to data protection regulations including GDPR.

In addition, so that your security efforts don’t go down the drain, make sure to set access controls so that specific data masking algorithm settings were available only for data owners in the relevant departments and no one else.

5. Fake data generation 

Cybercrime attacks can result in fake numbers that your dashboards will show as it happened with Amazon when the site’s algorithms (Amazon’s Choice, top sellers, products ratings) were manipulated with fake products’ reviews that overrated certain products and sellers artificially. If you can’t see the real picture you’ll end up getting the wrong insights and making flawed decisions that can also result in big data security issues. 

Data that has gone past its sell-by date also becomes a fake that can badly affect your decision-making process and, thus, business operations. Which fake results can it show? Learn from the story of United Airlines. They lost $1 billion a year because of an inaccurate pricing model that was based on the passengers’ seating preferences that used to be relevant 10 years before. 

Your ability to secure data and protect client and company data is diminished if you can’t identify fake or outdated data in your central repository. Take advantage of BI consulting to analyze the current state of your data systems, use Machine Learning (ML) models to find anomalies in your data, and apply a fraud detection approach. Studies show an accuracy rate of 97,9% for detecting fraudulent transactions with ML. ML-powered fraud detection also helps to reduce fraud investigation time by up to 70%.

6. Unauthorized changes in metadata

Bearing in mind the gargantuan volume of Big Data, unauthorized metadata modifications make it challenging to manage changes in ‘data about other data’ and identify the relevant information afterward as you don’t know for sure which changes are trustworthy. 

To exclude unauthorized access and its displeasing consequences, such as wrong data sets and untraceable data sources: 

  • implement user access control and obligatory authorization processes for employees
  • use nulling out when data is replaced with NULL for an unauthorized user 

Since even basic sensitive information such as a document author’s name, revision history, type of software, in the wrong hands may lead to a potential data breach, you’d better use one more measure to secure your metadata — sanitization. This is the process of removing sensitive data from the document. After sanitization, the file may be distributed to a broader audience. 

Unauthorized changes in metadata can also jeopardize data security and make things awkward if you prepare an offer for the customer by copying a previous file. If the document doesn’t go through the sanitization, your hypothetical client will have access to the history of changes and find the corrections of the original budgets or the scope of work for your previous customer.

Therefore, don’t underestimate the importance of this activity. Use automated data sanitization tools to ensure that only the intended information can be accessed. 

7. Employees’ carelessness

Have you heard about the Equifax breach that was caused by an employee’s error? An individual in the technology department had ignored security alerts, which led to exposing the sensitive data of nearly 146 million Americans. 

A Verizon’s report states 74% of data-related incidents involved human error. The level of accidental staff negligence rises alongside the growing number of devices accessing the company’s and customers’ sensitive data — not to mention the risk of employees exposing it to popular gen AI chatbots. With staff accessing data from personal and over unsecured networks, sharing a file with unauthorized parties — whether accidentally or maliciously — can be as easy as snapping your fingers.

The technical aspects of the solution that will help you detect security breaches in time and ensure big data security include the implementation of multi-layer authentication and an inside threat detection approach to get notifications about security threats by your staff. As for the ‘people’ part, create an atmosphere where employees feel safe to report on a lost or stolen device and do it immediately.

Security audits and actualization of your Big Data strategy are initial, yet critical steps in resolving Big Data and security concerns

Big Data technology is a world of opportunities. It helps you better grasp your customers’ needs, create detailed hypotheses for market testing, and find ways to improve the product. And yet, Big Data technology is only worth using if the solutions you have are properly secured. Start with a security audit to identify the areas of concern, for example, those referred to data storage or data cleaning, and don’t ignore them when developing your Big Data strategy. Not sure you can deal with all the Big Data security challenges by yourself? Our BI experts have you covered, get in touch to find out how.

FAQ

What are major security concerns of Big Data?

The complexity of data in terms of its structure, source, storage location, format, device type, etc. is one of the key security concerns related to Big Data. Coupled with the diversity of processes that occur with Big Data — storing, cleaning, masking, etc. — controlling various data transformations is challenging.

What are various security and privacy challenges of Big Data?

Ensuring security and confidentiality of business data and customers’ sensitive information are the main security issues in Big Data. You have to improve your system’s cyberattack resilience level, configure automated data cleaning, data masking, and document sanitization tools, establish mandatory authorization for employees, and adjust continuous monitoring of the system’s state.

How to Make Use of Financial Business Intelligence? (Non-) Obvious Benefits Revealed

What finance departments certainly have an abundance of is data. It comes from everywhere: spreadsheets, invoices, journal entries, and whatnot. A real treasure, right? Unfortunately, a lot of data by itself does not guarantee that you will be able to unlock all its hidden potential without sacrificing operational efficiency. Forrester reports that up to 73% of enterprise data goes unused for analytics. So what can be done to change the status quo and leverage data from heterogeneous data sources for getting actionable insights and your business growth? Financial Business intelligence addresses finance leaders’ needs for dynamic modeling, holistic data analysis, and accurate planning.

What is so wrong with spreadsheets?

Many CFOs are still not ready to trade Excel for BI tools in finance, guided by the logic of not touching a system that already works. But does it? Spreadsheets have been used for keeping records and conducting data analysis for so long that it’s not even questioned whether or not they are worth it.

However, there are plenty of rationales why you should no longer rely on moss-grown solutions for financial reporting and consider tapping into new alternatives, such as business intelligence software.

One of the main reasons for this is susceptibility to human errors. According to various studies, 9 out of 10 spreadsheets contain mistakes, This is not surprising at all, given manual data entry. Even something as small as a misplaced decimal point can lead to huge accounting distortions. 

Another problem with spreadsheets is that they provide a static view of historical data, so putting them to work across complex and dynamic processes is quite a useless idea. A holistic business vision cannot fit into dry financial statements and end-month reports – translating them into actionable insights is a painful undertaking.

The constant changes in the financial landscape leave businesses with no choice but to quickly assess these alterations and act on them. In these conditions, ignoring a wealth of data stored in your enterprise systems is not just unwise but can be devastating. The question is can you take advantage of the raw data locked in spreadsheets? Skimming through hundreds of pages of traditional reports is hardly a good way to gain control over your numbers.

In addition, manual number crunching takes too much time, which, along with taking up your employees’ precious time, leads to the inability to make informed decisions quickly.

Employees might spend 3-5 days a month filling out some crazy Excel spreadsheets. And then, there’s versioning, which, after changing a single digit or moving working files to other shared folders, or after sharing a final presentation file with some links to the working files, involves running through a dozen other files to make sure everything fits. But what if the specifics of your business require you to make well-informed decisions more often than on a monthly or even weekly basis? At the same time, no one is immune to force majeure, which is not scheduled and calls for immediate actions.

Finally, spreadsheets do not correlate with the financial planning process making it hard for the finance office to get a clear perspective of the current situation and to take forward-looking actions.

Conducting plan vs actual analysis, calculating variance, extrapolating data – all this is very challenging to do in Excel. It’s enough to change the slightest detail for the whole thing to collapse instantly. In addition, it’s incredibly inconvenient. If you use Pivot tables, they tend to overlap, so it’s hard to imagine what they will look like in fact. No wonder adding data for new analysis or reporting periods in Excel files and fine tuning all Pivot tables and charts become utterly discouraging.

The explanations above as to why spreadsheets hinder the work of the finance department are already sufficient to lean toward BI in finance. This technology is capable of outstanding things. Keep reading to find out more about how it drives finance and accounting tasks and what exactly makes Business Intelligence so attractive for financial services.

Behind the pretty pictures: a detailed look at the benefits of financial Business Intelligence

There’s an opinion that BI is first and foremost a way to present data. Yet, outstanding data visualization is far from everything financial Business Intelligence tools can offer. To put it clearly, the visuals are just a nice-to-have feature in comparison to another kind of new opportunities and value this technology brings to your organization. 

If it was just a matter of visualization, it wouldn’t be the sticking point at all. For example, Excel’s modeling capabilities allow presenting charts and graphs too. However, compared to Business Intelligence applications in finance, its limits, such as data size restrictions, poor collaborative functions, and others, are quite significant.

What finance departments cry out for is something faster, something ‘click-of-a-button’ to get updates and predictive analytics in next to no time, something like BI tools for finance. When you implement technology using a thoughtful strategy, what can you expect to gain?

1. Deep stakeholder engagement

The incomparable advantage of BI financial services is that they provide a genuine stakeholder involvement in the “process”, namely long-term financial planning, budgeting, forecasting, and comparison with reality. For instance, if a branch manager has a clear understanding between an input (certain indices, plans for sales volumes, etc.) and an output, it allows for more effective conversations within the department. With self-service BI tools, like Power BI, Tableau, or Qlik, that Gartner mentions among the leaders in the field of data analytics, questions that arise in meetings are addressed and answered immediately. There is no need to go back to the analysts to prepare another report and postpone the discussion until the next time. 

Moreover, access to BI solutions via mobile devices and tablets also boosts the business leaders engagement – making financial data analysis more accessible; anytime, anyplace.

2. Time saved. A lot of it

Long gone the time when companies had no other alternatives than to use several Excel files, matching and filtering them manually to get a comprehensive picture of data. Now, the alternative is here and it’s Business Intelligence in finance, which provides incomparably faster report preparation and, thus, operational efficiency. Instead of almost a week to compile the data, it takes no longer than a leisurely cup of coffee and frees up several full days for intellectual work.

Couple that with the fact that there are some businesses where you can’t afford to wait until the end of the month to make a decision. For example, if you’re dealing with fast-moving consumer goods, to survive, you have to keep your finger on the pulse and an eye on your competitors. Otherwise, your analytics are pointless.

BI allows you to see and quickly grasp operational data such as, let’s say, the results of marketing campaigns. The contribution turned out to be twice as much as the investment? Perfect! All you have to do is to analyze exactly what caused this and move forward in the same direction. Whereas an in-the-red campaign serves as an obvious sign to change the strategy or, at least, make some adjustments. There are also such things as tracking bad-selling items, or low-margin ones. It’s difficult to do this in Excel, especially if you have many product lines and ten, fifteen, twenty thousand positions in the assortment.

Financial Business Intelligence

3. Consolidated location for your data

Imagine, how much more value a finance department can bring by analyzing the data and offering solutions, rather than spending eons on scrambling for the information on operations, supply chain, HR, procurement, sales and, well, you name it. Thanks to a full-scale BI system, financial data from all over the company and beyond – speaking of Big Data – is gathered in one place.

There are companies that have to pull raw data from a whole set of disparate systems, which in itself is a pain, not to mention that some of these systems might be outdated. Complete re-engineering of legacy software will take years and cost millions. So working with data is handled in any way possible: somebody uses FTP to transfer files, others upload CSV files into certain folders… But what if the folder is changed or the IT team rebooted the server? No wonder the output is messed up. Meanwhile, a well-designed, full-fledged BI system helps to organize this data correctly with a data warehouse or data lake and an ETL process in one place.

With Business Intelligence for a finance department, employees get the capability to quickly incorporate new data into the data warehouse and interact with all the necessary information in one location without having to search for additional data. Imagine, you can have all your data sources such as the web, SQL Server, Excel, and flat files funneled into a pre-configured solution, where this data is stored, processed, and visualized.

There’s no longer a need to juggle dozens of open tabs and separate reports to tell a story. Whatever data you want to put together, finance business intelligence software allows you to do it without a hitch. For more details, it’s just enough to drill down into the source report.

4. Self-sufficiency

The problem might not even be bringing data from different sources together. You may have a data warehouse and an in-house development team dedicated to helping users with managerial reporting. But that still won’t keep you out of going through all the circles of corporate IT hell while drawing up the terms of reference as many times as it takes for your needs to be understood, and you may still end up with something that doesn’t fully work. BI in finance, on the other hand, helps you unlock the full potential of your data – the kind you never knew you had – without involving the IT department.

5. Effective financial management

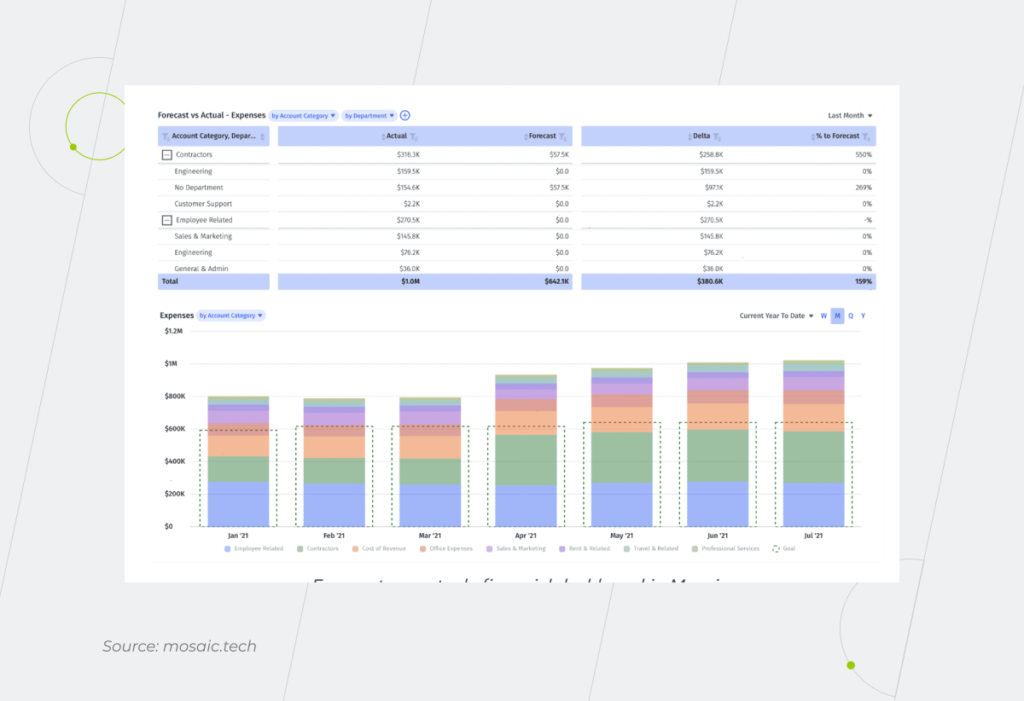
By providing robust financial business analytics wrapped in dashboards, the BI tool makes financial management more efficient on all fronts.

  • Cash flow management

Cash flow is crucial in non-ideal conditions in which current business has to function – when one crisis is followed by another. Some clients ask for extended terms, and others just slow down payments… With finance business intelligence, you will have visibility into your cash flow and make accurate forecasts to improve its health.

Oftentimes, companies go bankrupt not because they are unprofitable, but because they have a cash deficit. Cash flow management is the top priority for any CFO. In this way, all businesses that work to order and where the production cycle is long enough are unlikely to be able to do without BI financial services.

For example, with the Cash Overview report in Power BI, you’ll get a grasp of inflows and outflows in system currency, total bank balance and balance by legal entity, today’s actual vs forecasted balance, and more. Meanwhile, cash flow forecasting itself allows you to go into more detail and get daily forecast summaries and actionable data insights.   

  • Revenue management

The mission-critical questions like what, when, and who to sell as well as what price to set can be answered more easily and accurately when the data is collected, interpreted, and visualized by a financial BI system. 

Finance business intelligence offers a 360-degree analysis of pricing, inventory, promotional campaigns, and product launches. BI-driven revenue management helps businesses from a wide array of industries keep the lights on and reach target profitability. Take, for instance, hotel chains that use finance BI software to determine optimal room rates, forecast reservation, staffing needs, inventory levels, and other resources to avoid problems with procurement and staffing during off-seasons and peak seasons.

  • Expense management

For any organization that wants to stay in the business, it’s important to pay the bills on time, which can’t be done without proper expense management. But what makes it so? BI, among other things, is designed to keep track of the company’s expenses. It enables businesses to replace piles of receipts and spreadsheets with insightful dashboards to gain a holistic view of staff spending, ensure compliance with expense policies, and track T&E trends.

The decision to use special software for managing company’s costs and strategic planning is getting even more effective when bolstered with scheduled dashboards and reports email delivery. These tactics help managers keep an eye on their employees, set up alerts and notifications to manage expenses in a timely manner, and connect BI tools to your organization’s expense, billing and online travel reservation systems.

6. Accurate forecasting

Thanks to Business Intelligence applications in finance, you can bring the plan and the fact together on one level of business logic, in a single tool. And if this tool is also able to show what a fact consists of and why it is like that; it’s priceless. 

Let’s say you set up a business unit, so you had to buy extra SAP licenses, or a new production site was added, which entailed additional infrastructure. After a while, it all becomes forgotten – you can, of course, dig up the budget presentation for the required period, but it’s much more convenient, reliable, and faster just to click on the cell with the number, where there’ll be a note with the name of the person who added it and the date when it was done.

If the plan differs from the fact, you can do a drill-down to see what the discrepancies are due to. The data becomes available: you can do both synthesis and analysis without having to look for some emails, going through the tables, or calling a controller.

Forecasting

7. Faultless reporting

The thoughtless manual task of copying and pasting numbers is error-prone and can undermine trust in your financial data. Fortunately, all this heavy lifting can be done for you by financial Business Intelligence. Utilizing BI software for direct data access and report automation saves you time, money, and, most importantly, reputation as a specialist, which “takes decades to build and five minutes to lose”. 

Besides, BI brings more credibility to data by differentiating between good and bad data. Proper analysis is only possible when data is of decent quality. That’s why it’s not enough to simply gather information. The ETL process, which lies in the core of BI systems, is designed to ensure good quality of data in the warehouse through standardization and removing duplicates.

In addition, data health can be maintained by conducting regular audits or working with reliable data experts who know exactly which steps to take to optimize data quality.
8. Visibility of entire organization

What a CFO needs most is a one-stop-shop for all financial information. Armed with calibrated dashboards tracking financial data across the entire company, C-suites can drill down into the reporting to find answers to any financial-related questions. How do the costs of producing similar units at different enterprises compare? Are our production volumes different compared to the same period last year? What are the drivers of the variances? How does our performance correspond to forecast and budget? What are the slow-moving items that should be cut out of the supply chain? Speaking of which, BI does a great job covering that part of the business. 

Now, answering these questions is child’s play. And, on top of that, it has become much easier to explain the correlation between the numbers to non-financial workers.

9. Consumable data

Financial business analytics has never been as crystal-clear as BI technology has made it. Hidden patterns and trends, non-obvious connections, unnoticed opportunities, and underestimated threats – all come to the surface instantly when reflected on a dashboard. In addition to presenting complex concepts in a digestible format, robust data visualization democratizes data and communicates insights throughout the organization by determining why it is performing in a certain way and what you can do to improve numbers.

This way, BI tools for finance are an indispensable constituent of any modern company for analyzing financial KPIs against business performance and presenting a dynamic view of market trends, product interest and customer sentiment to highlight future strategic opportunities.

How does Business Intelligence for a finance department look? An overview of a dashboard example

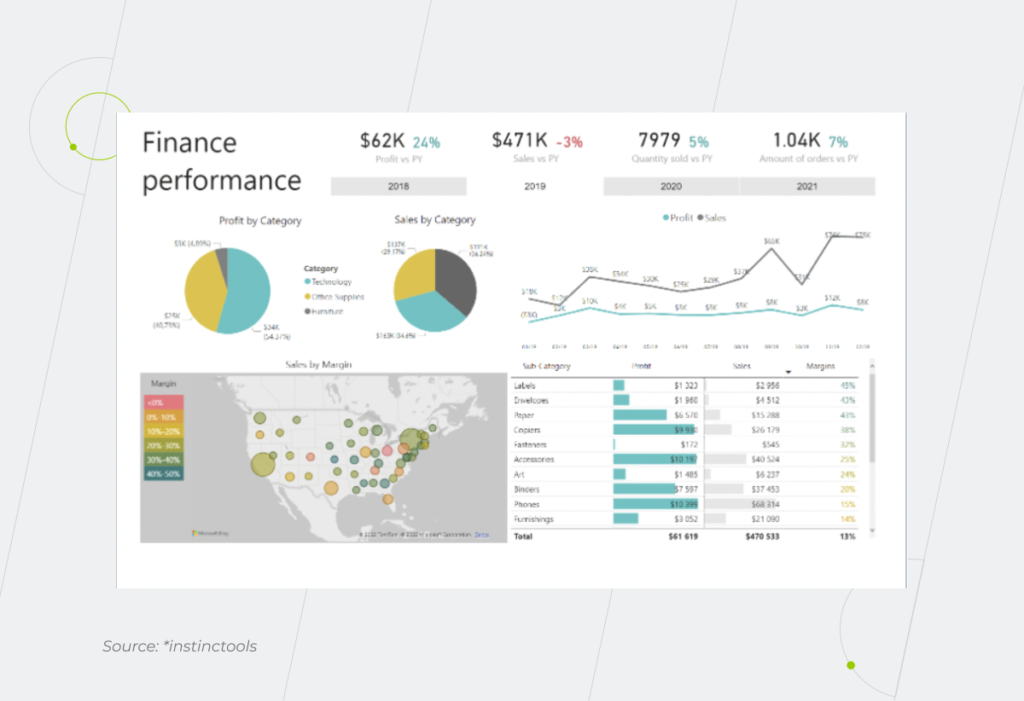
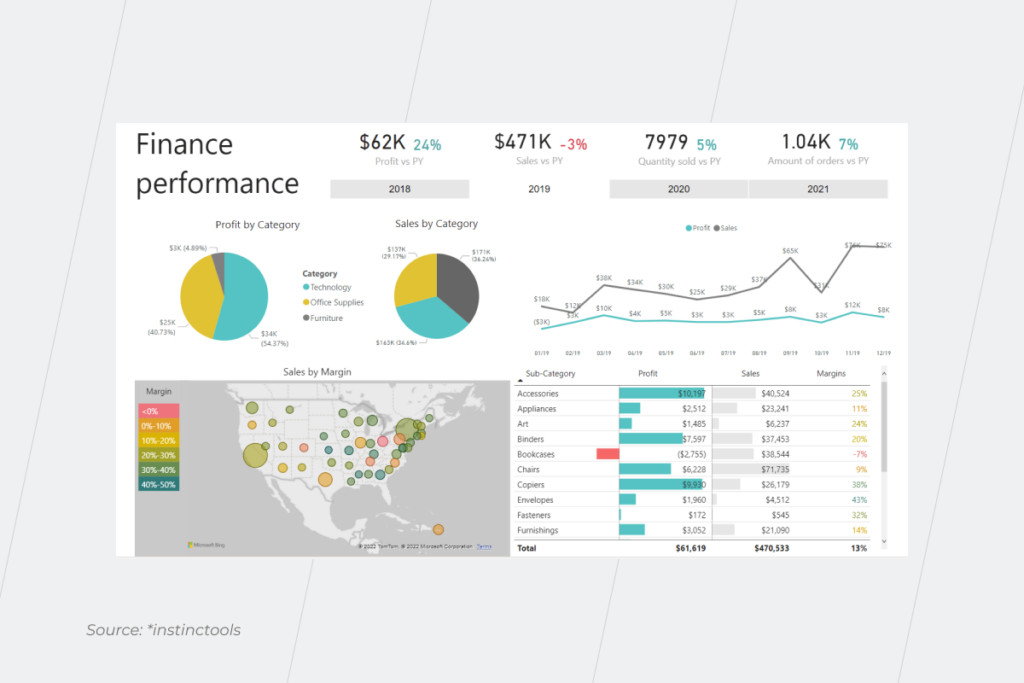
After having undergone the transformations, the data can be grouped according to the custom pre-built finance report packages, such as CFO dashboard, Event briefing, Benchmarking, etc. Below we’ve prepared an example of the Finance performance dashboard, that summarizes the 10 most relevant KPIs on a single screen.

The top row shows profit, sales, quantity sold, and the number of orders in the current year against the previous year. The second row illustrates profits and sales by category, while the third one displays sales by margin, as well as the profits and margins of various subcategories of goods.

Financial Business Intelligence

To have a closer look and to gain a better understanding, users can drill down on data by clicking the relevant areas, such as sales. This action brings up a specific report that shows the granular details for the KPIs and drivers. The report opens right away and provides a root-cause analysis of the information shown in the dashboard.

It’s not only the head of finance that can benefit from these dashboards. Other specialists with the finance department (e.g. financial controllers) can utilize them to gain insights in their focus areas. 

The BI solution can be also supplemented with Artificial Intelligence (AI) and Machine Learning (ML) technologies to further analyze data and succeed at prescriptive analysis.

Get a head start with BI financial services

All the benefits that financial Business Intelligence brings to organizations, in fact, can be combined into one – a competitive advantage. Being able to automate number crunching, store, and process data in a singular place, and present it in a format understandable to all stakeholders, you save a huge amount of time on deep and holistic analysis and ensure decision-making is driven by data rather than by gut feelings. And this will certainly allow you to feel more comfortable in the market and act confidently, while those who are reluctant to embrace the power of business intelligence software will be flying blind.

Ready to take your business to the whole new level of awareness with financial BI?

Plan your next move

Business Intelligence Challenges Our Experts Faced… and Overcame
The importance of BI solutions is becoming indisputable. Statistics show that 26% of all companies have already adopted BI, and around 33% will do it this year. However, despite the fast growth of the trend, the path from getting started to leveraging its full potential still has some bumps along the way. A great number of business intelligence challenges stem from a system’s limitations, intricate business requirements, human factors, and whatnot. 
How to make BI software work for your organization? Our in-depth understanding of incorporating BI solutions into different industries and corporate levels enables us to articulate business intelligence issues and give practical advice on their resolution.

Stepping into the age of action comes with certain BI challenges

Business intelligence isn’t confined to the big guys anymore. Companies of all sizes can now turn disparate data into a plan of action. However, action-oriented data analytics is premised on multiple precursors, each being a potential challenge for early BI adopters.

dashboard example on finance performance

1. Integrating data from different source systems

BI only makes sense when it can collate and analyze data from multiple sources to present the end user with some solid ground for insights. Otherwise, what’s the point? However, the numerous data sources BI software has to connect to — from a plethora of databases and business apps to big data systems — increase the risk of telling the wrong story.

From the start, it might not seem to be a problem as long as in-built ETL processes allow ready-made BI platforms to directly connect to various data sources and transform data for their own use. As fast and attractive as it sounds, the built-in ETL is not omnivorous. Although some specialized connectors are constantly being finalized for new source systems, a medium to a large organization will at some point face scaling, performance, and maintenance issues if they exclusively use Power BI Data Flows as the ETL tool and DWH storage. 

First, working with raw, unstructured data increases the complexity and number of datasets which makes reporting more time-consuming. If the report integrates data from different sources, the same logic cannot be easily applied to another dataset. Secondly, with multiple versions of the truth across different datasets, the odds of discrepancies across the reporting system are high. Third, if your data amounts to millions of rows, the built-in ETL won’t be able to handle it, leading to slow report responsiveness.

The most rational solution in this situation seems to be the setup of a single repository, where data would be pre-aggregated and stored in a structured way — a data warehouse. By eliminating the confusion within your data, it contributes to the creation of a single version of the truth. Among other significant benefits central repositories bring is the possibility of historical data analysis and faster report preparation. Data warehouse technology allows dealing with an ever-growing amount of data sources without making you spend more on your BI tool maintenance.

Learn how to consolidate all your data under one roof for more reliable insights

Book a free consultation

2. Data quality issues

Data quality is one of the major challenges of business intelligence and stumbling blocks to achieving BI goals, namely, making the right, valuable decisions. Human errors, duplicated and invalid data, and inconsistent data formats do not allow you to acquire any worthwhile insights and can provoke wrongheaded actions on top of it.

A proper data management strategy helps tackle data quality issues. To put it into a nutshell, it deals with the data collected or generated by the company to ensure better decision-making.

Data architecture is a crucial data management component that plays a vital part in delivering high-quality information. Let’s say, a company has multiple sales channels, it’s a nice idea to merge all the information generated by them at the data warehouse level, from which it can be further distributed to different reports, after passing certain clearance algorithms defined by the business rules.

Data modeling is another thing you can’t neglect while trying to make your data eligible for analysis. For example, a visitor to your website, a participant in a survey you’ve conducted, and your client can be one person. However, you might have them presented in different roles in different systems, even if it’s the same entity. That’s why, to avoid data redundancy it should be decided which system (CRM, ERP, etc.) to assign this entity to.

Data management strategy is largely an administrative activity. At the same time, the technical part of building a proper, well-thought-out solution architecture must not be discounted. Work on the strategy should begin with a diagram of all the company’s data flows. Determine the source systems you have, where data is generated and consumed, what entities you have and where they are stored, and then decide on how to implement it technically.

Don’t let poor data quality stand in the way of your decision-making

Consult an expert now

3. Lack of data talent

Skill shortage is among other common business intelligence problems that impede data analytics efforts. In 2020, the United States faced a scarcity of data science talent — companies failed to fill around 250,000 positions. The 2022 Tech Hiring Survey also defined data science as a skill for which demand far outstrips supply. 

It is exacerbated by the looming talent crisis across the entire hiring market, changing demographics, and the ‘Great Resignation’, compacted by what could be another recession. Without dedicated skills, companies fail to make effective use of BI analytics, set up data warehouses for baseline information, or establish the required level of data literacy in general. 

To grapple with the talent crunch, companies tend to leverage outsourced expertise. A dedicated BI team makes up for an entire suite of in-house data experts and helps businesses validate their data initiatives fast and with no hiring hassle.
4. Bad data visualization

The quality of your data and analytics processes tends to steal all the glory. However, the design of your BI dashboards is just as important to communicate complex data to the decision-makers and turning critical insights into action.

If data isn’t presented and argued in a compelling way, it is ignored, or trumped by opinion. The value of having an argument and crafting a story component should never be underestimated.

Lack of interactivity, the inability to pull near real-time data, rigid templates, and even the wrong choice of color may lead to potential challenges in implementing the dashboard. To emphasize proper data values, companies should employ highly customizable dashboards with broad personalization capabilities to meet the unique needs of the organization. 

The right choice of dashboard type can also whip your BI management in shape. Analytical dashboards provide a comprehensive overview of crucial data, while operational dashboards include real-time updates relevant to a specific department. The strategic type delivers a rundown on the essential KPIs to the executives.

dashboard example on finance performance

5. Choosing the right software

Selecting the right BI tool is half the battle when it comes to tackling business intelligence implementation challenges. According to TrustRadius, Tableau, Qlik Sense, and Microsoft Power BI are the leading business intelligence platforms with the largest market shares. But which one clicks with your unique needs? Let’s touch on the main difference between the three.

CriteriaPower BITableauQlik Sense
Popularity (users)Over 5 million usersOver 220,000 data scientists38,000+ customers
Data sources130+ data sourcesConnects to nearly any data repository100+ data connectors 
Data visualizationCustom dashboards, embedded analytics, extensive data visualization toolsCustom visualizations, rich and interactive dashboards, embedded analyticsUnique “associative” data engine, custom visualizations
Cloud compatibilityAWS cloudAWS, Google Cloud Platform, Microsoft Azure, Alibaba CloudAmazon (S3, EC2, RDS, Redshift, EMR), Azure, and Google. 
Customer supportIncluded for Power BI Pro customersFreeFree
Advanced featuresNatural Language Processing, Machine Learning integration, predictive analysisEnhanced data visualization functions, predictive analysis and forecast, augmented analyticsSmart visualizations and analytics, AI and machine learning analytics

As you see from the table, choosing between those three tools is like choosing between Audi, BMW, and Mercedes, about the same quality packed into a slightly different exterior. 

However, in the case of a large-scale adoption, even subtle differences begin to play a role. License type, roles and permissions, discount allocation, and other factors have to be taken into account to optimize your BI experience.

Moreover, generic commercial solutions may not always suffice your visualization needs. For example, B2C startups are better off with open-source BI solutions due to the high analytical needs and the absence of licensing burdens. In some cases, companies opt for a custom BI tool for branded design.

If you’re struggling to choose your BI option, our engineers can recommend the right BI solution based on your infrastructure and unique project needs

Contact us

6. Low adoption levels of BI among employees

After all the money, time, and effort you’ve invested in your analytics software, it still might not work because users won’t accept it. Low adoption levels within organizations remain one of the leading BI problems. If you want a freshly deployed BI tool to be used not only by analysts or data scientists, make sure it is user-friendly, and not intimidating. 

Besides, employees frequently show justifiable — from their standpoint — resistance to new software. Such a BI aversion is entirely understandable as people whose main task has been to manually bring together the company’s analytics are afraid that reporting automation will put them out of the job. That’s why they need to be convinced otherwise. Employees who can embrace business intelligence challenges and opportunities will become more valuable assets to the company as they won’t longer have to waste tons of time on number crunching or worry about the risk of making a mistake. Instead, they will analyze the information from top to bottom and communicate the result of this analysis to their managers. 

The subtle art of dealing with managerial issues related to BI implementation and mindset transformational practices requires even more precision when it comes to Excel. People’s loyalty to this tool should not be ignored. Numbers tend to speak louder than words. Use them to show your employees how beneficial a BI tool can be in terms of saving their time. For instance, it takes financial controllers one or two days to handle ad-hoc requests, three-five days to prepare for monthly meetings, and around three weeks to summarize the year’s results. With the BI system, all reporting is done automatically, at a click of a button.

The main goal is to show a person how to use the dashboard to answer their questions and explore the available data quickly and efficiently. Trends are way easier to spot when data is adequately visualized rather than scattered across spreadsheets.

Yes, we know that Excel is not just about tables, and you can build charts in it, too, but you won’t be able to interact with them on the spot. In a dashboard, you can click on a single segment and see the information you need right away, while in Excel it will take you more time to do the same thing.
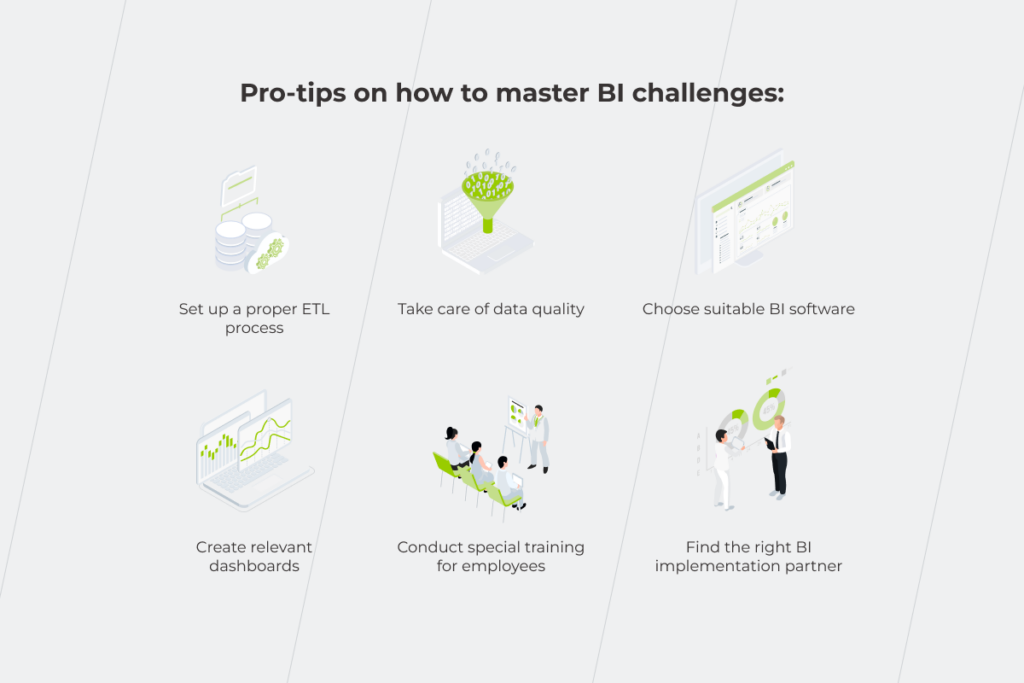
An efficient way to deal with business intelligence implementation challenges and an essential component of proper change management designed to soothe users’ pain is staff training. That’s why users shouldn’t be left in the lurch after the system’s deployment. Find BI implementation partners who will prepare the documentation on the new processes and arrange wide-scope training aimed not only at teaching how to work with the software but also at increasing general tech literacy. 

We explore the needs of each stakeholder to deliver tangible results

Let’s talk!

Navigating the path of business intelligence

Failure rates for data science projects loom large at 87%. It attests to the fact that a solid data analysis and visualization architecture cannot be strategized on a hunch unless you want to end up with sporadic and incomplete insights. Awareness, planning, and expertise will help you avoid most BI problems. Below, we’ll touch upon the three pillars of a successful business intelligence strategy.

Define what problem you want to solve

The application area of business intelligence is immense and spans virtually every business operation. Therefore, you should start small by identifying the scope of analysis and linking it with correlating metrics and reports. The reports, in turn, should revolve around a specific selection of KPIs, internal or external, to measure and analyze an organization’s data and improve on it. A BI consulting partner can advise you on the relevant metrics and validate your scope of analysis.

Transform the organization’s mindset with proper change management

As users segue from fragmented tools to an integrated BI system, you should have the correct transformational methods in place to eliminate inertia and promote system acceptance. Establish stable and transparent communication flows, bring leaders from different lines together, and run workshops and training to cultivate collaborative data flows and seamless knowledge sharing for accurate business insights.

Choose a reliable consulting partner

A single unified data warehouse and consistent data strategy lay the ground for fast and accurate data analysis. Without these precursors, your insights will be isolated in data silos, locked within departments as missed opportunities. To avoid data failures, secure an experienced BI consulting team to establish a robust data infrastructure, manage data governance, and connect your data warehouse with the right BI tool.

Hit pay dirt with business intelligence

Data-driven decision-making is no longer an option; it’s a mandate for business longevity and competitiveness. Business intelligence is what nurtures a data-fuelled approach and allows companies to turn their data into action.

BI-enabled vigilance is a collective result of the right data strategy, a unified IT architecture, and a consistent adoption cadence. If even one piece is missing from your BI puzzle, your company will be short-sighted when it comes to data, failing to make the right decision. Enlisting the support of data and BI professionals will help you put your puzzle together and overcome common business intelligence challenges.

Looking for a trusted Business Intelligence partner?

Reach out

RPA in Healthcare: How To Save Up to 35% Of Your Clinic Operating Costs

RPA in healthcare refers to process automation via computer-aided services for hospitals, medical laboratories, and clinics of various types, from physical therapy to plastic surgery or dental clinics. 

Collecting and integrating data from multiple external and internal sources is an essential part of the day-to-day routine of healthcare organizations. It eats up tons of time, slows down processes, and increases operational costs if done manually. 

If you are a healthcare provider, efficient automation of your activities is one of the ways to gain new customers and retain them with high-quality services. Moreover, RPA can become your primary step toward digital transformation.

Automation of countless rote activities accelerates processes and helps you reap fast rewards such as devoting more time to patients and providing them with an enhanced service. And the better it is, the higher is your healthcare provider’s rating. Not to mention that by removing a manual component of daily mundane tasks, you can patch up the holes in your operating budget. In this article, we evaluate options on how your organization can reap significant benefits from the automation of routine tasks by implementing RPA.

RPA will become a game changer for your clinic

RPA works for mechanical, logical tasks that operate structured data. The information from the different systems is matched appropriately, and the bots perform a wide array of activities on a pre-thought algorithm without employees’ involvement. 

How does RPA handle challenges in the healthcare industry? Its implementation allows you to:

  • Speed up data-related operations. Healthcare is one of the industries with an extensive document turnover. Performing operations that involve extracting, entering, updating, and transferring data manually is a waste of time and budget. RPA bots will take on routine tasks and perform them 15 times faster than a human. Couple that with the reduction of human error and increased data accessibility for doctors and patients. If you have a private practice, decreasing the possibility of human-caused mistakes may also be a reason to invest in RPA. However, make sure it’s really worth it, considering development costs and the workload in clinics of this size. 
  • Reduce the cost of processing and human labor. According to a Deloitte survey about RPA in MedTech, the application of RPA in healthcare can lower these kinds of costs by up to 80%. 
  • Improve security and compliance. Apart from ensuring compliance with protocols such as GDPR, HIPAA, you have to regulate data access levels for different employees since back-office workers, administrators, and doctors require different rights in sensitive data usage. This problem can be solved thanks to the role-based access implemented with the help of RPA bots. A Protiviti global survey proves that 74% of respondents improved compliance with security regulations thanks to automation.

RPA plays a significant part in enhancing healthcare quality and creating a better patient experience. As you free your employees from paperwork and monotonous, repetitive operations, they can devote more time and attention to patients who get qualified help faster.

RPA in healthcare

Let’s investigate some examples of RPA use cases in healthcare from the perspective of the patient’s pre-visit, visit, and post-visit activities.

Pre-visit activities

Pre-visit activities are all the operations that set the person up for the appointment. How do digitization and automation reinforce this process?

Patients’ scheduling

Now that we are living in a new reality shaped by the pandemic, it’s hard to imagine that two years ago, 88% of appointments used to be booked manually. If you still have assigned staff to collect data on patients’ appointments, probably such an approach requires extra time and effort from both your employees and visitors and results in insufficient and slow processing of requests, and human errors. 

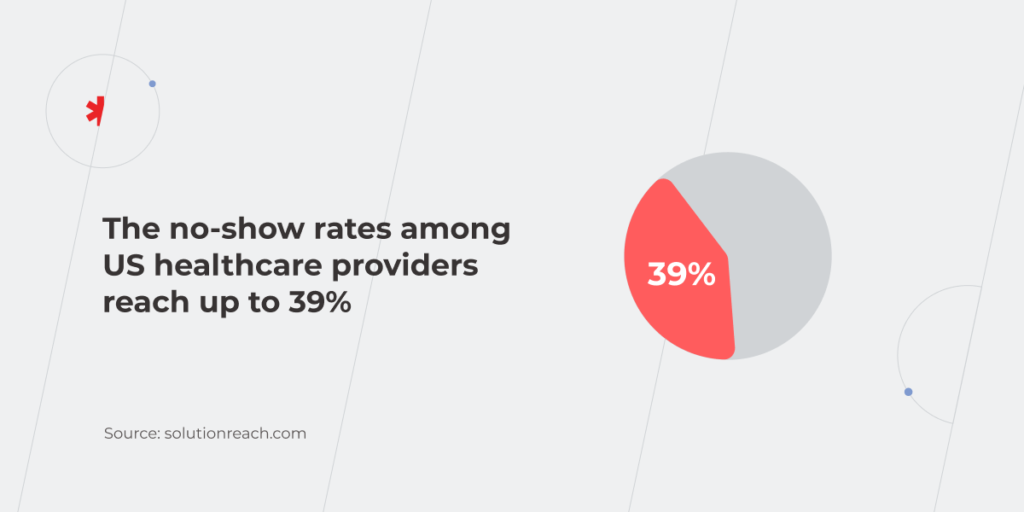
We’ve described the scheduling example in detail in our previous article on the benefits of RPA in different industries. Now let’s focus on the other side of this process. The gap between scheduling an appointment and the actual visit to the doctor could reach up to months or even more than a year. It’s easy to forget about the visit without prior notification. The no-show rates among US healthcare providers reach up to 39% depriving them of $150 billion annually, partially because patients simply forget about their appointments. Therefore, adopting RPA in the healthcare industry to automatically send appointment reminders is primarily about saving your money.

RPA in healthcare

Insurance verification and validation

Does the patient’s insurance cover the appointment and treatment? If this information is still checked manually, it slows down the process and takes a lot of time from employees.

Also, consider that changes in the patient’s insurance policy, such as plan coverage or home address require billing offices to re-start insurance verification. Meanwhile, RPA bots can track if the patient visited the doctor or canceled the appointment and then generate the information on cost and insurance deductibles. The technology runs quickly and consistently according to a well-defined algorithm. You get the up-front process visibility and can check at what stage what actions the bot did. For example, if it’s not clear why the bot billed for a certain cost, you can review a record of its actions.

Visit activities

The main part of the patient’s journey is the appointment itself. People interact live with the clinic or hospital staff at this stage, and their experience influences their perception of the services of your healthcare facility. That’s why making use of RPA to meet your patients’ expectations of convenient service and personal data security is vital.

Security & compliance checks

Collecting and storing information electronically allows laboratories, clinics, and hospitals to greatly fasten and simplify the health information exchange (HIE). The goal of sharing medical records among disparate healthcare systems is all about creating timely and high-quality patient-centered care. But how to ensure data security when it’s moved between different systems? Leverage RPA for security and compliance needs — create bots that automatically:

  • Detect personally identifiable information (PII) and encrypt it to protect patients’ data from cybercriminals. You can add additional functions and make the bot capable of sending an alert if PII doesn’t meet an established policy.
  • Delete personal data after a certain period, as required, for example, by GDPR.

Remote patient monitoring (RPM)

Since most healthcare staff already have a lot on their plate, overloading them with patient monitoring on top of everything else seems like a bad idea. RPA technology can solve the problem with simple, repeatable tasks such as collecting and monitoring the information on the patient’s test results and self-reported adherence. 

For example, if the patient’s blood pressure rose during the clinic visit, the RPA solution can help monitor their condition during the next hours or days. How does it work? The bot sends notifications to measure blood pressure to the patient’s profile in a special application. If it registers a high reading, it will additionally send the person a health questionnaire — what are other symptoms, has the patient used medication, etc. — and will set a reminder to additionally measure the resting pressure. If it’s normal, the application will notify the person that there’s no reason to worry. But if the reading is still high, the system will inform the nurse that this patient needs an extra appointment. In the example described, the patient’s health data is recorded in real-time, and the involvement of doctors and nurses is required only in some cases, while in a system without an RPA, all these activities would be performed by the medical staff and would be recorded asynchronously. Digital technologies free up highly qualified specialists for things that can’t be done without them and still ensure full-fledged care for patients. 

Discharge instructions

How can doctors make sure their patients are taking medications? They can’t. Unless there are specially programmed RPA bots, that send reminders to the patient and, if need be, notify the doctor if the patient doesn’t go to the pharmacy to get the prescribed meds. 

The role of automated discharge instructions is even more important for hospitals and patients after surgery or other serious treatment. Let’s find out what tasks can be left to RPA based on the example of a patient who’s undergoing chemotherapy.

  • Notifying the patient about scheduled appointments
  • Sending prescription pick-up reminders 
  • Reminding to take medical tests
  • Registering the patient’s health state after the session
  • Alerting the doctor if the treatment doesn’t go according to the plan

In case the patient experiences any atypical symptoms, he/she notes them in a special application. The RPA bot receives this information, transfers it to the clinic, and offers to set an appointment with the required doctor. 

Post-visit activities

The payment process is one of the low-hanging fruits that are easy to automate because of a large number of repetitive steps. At this stage, RPA not only streamlines the procedure but also eliminates the probability of a human error. 

Billing

In order to charge for medical services correctly, the clinic’s billing office needs to merge information, such as patient records, disease codes, medications, etc. Baylor Scott & White Health (BSWH), a system with 52 hospitals across the United States, calculated that manual billing takes 5-7 minutes, and its accuracy isn’t 100%. After RPA implementation, hospitals can cope with 70% of estimates without employee involvement and human error.  

Claims processing

McKinsey’s survey among healthcare facilities shows that 72% of respondents believe RPA greatly impacts claims processing. 

What operations can be automated? 

  • Opening and copying data from emails and entering the information into your core system. 
  • Reconciling and verifying claims data.

Such an approach speeds up the back-office services and enables you to provide visitors with a better experience. Implementing automated solutions also impacts employee costs. Avera Health saved $260,000 in staff costs by creating bots to review user account status and alert managers about pending and incomplete claims.

RPA technology is known for being of much use for patient care. RPA bots can send reminders about procedures and tests to the patients as well as automatically create reports for the physicians, keeping them up-to-date on the health state of those they treat. At the same time, COVID-19 uncovered new areas where RPA can be helpful:

  • Bots help monitor employee health in real-time. They track nursing staff’s and doctors’ health status and alert every case of a high body temperature. Such an approach allows hospitals to take appropriate care of their employees.
  • The technology streamlines staff onboarding by 10 times. Bots automate operations such as checking job seekers’ police vetting and their employment status background. 
  • RPA solutions speed up COVID-19 testing by more than 90%. Bots make the initial diagnosis and then collate this information with the patients’ COVID test results and their medical records in the hospital’s EMR. 

Even if it seems like the worst of the coronavirus is over, refusing to equip your hospital with electronic assistants is shortsighted. This pandemic will subside over time, but there is no guarantee that a similar threat won’t arise in the future. The technical readiness of healthcare providers to cope with the hardest challenges is the cornerstone of efficient patient care. Start with RPA implementation to have your hands and minds free for activities that require human involvement. 

Save money and free up time for humans to focus on higher-value tasks

RPA is an easy-to-implement opportunity for healthcare organizations to cut costs and speed up operations across the company. Just imagine the labor time that could be eliminated or minimized with automation. At the same time, you improve care quality and, as a result, increase patient satisfaction. Therefore, the processes in your clinic, hospital, or lab that can be broken down to a set of ‘if/then’ decisions, should be streamlined with the help of RPA.

Reach out to our specialists to discuss which of these examples of RPA in healthcare can be applied to your organization’s practice.

Acquire and Retain: How To Nail Personalization In Banking and Build Customer Loyalty

When personalization feels baked into every scroll and click on platforms like Netflix or Amazon, customers no longer see tailored treatment as a premium perk. What once felt like a VIP touch is now simply the baseline across all areas of life, banking included.

Interestingly enough, the demand for personalized banking cuts across generations. 74% of respondents, including Gen Z, Millennials, Gen X, and Baby Boomers, want banking services that feel made-just-for-them.

Ironically, banking institutions remain the last bastion of personalization with 94% of financial institutions acknowledging their inability to provide the kind of hyper-personalization customers desire.

Every day, banks generate a huge amount of customer data that can be turned into competitive advantages through delivering unique offers. Yet, it often remains untapped.

So what’s the problem? Why don’t banks use their abundant data assets to the fullest? Let’s uncover the main challenges of personalization in banking and how to overcome them to attract and retain more clients.

What is personalization in banking?

Banking personalization is the use of data collected from customer financial transactions, behaviors, preferences, customer feedback, and life events to identify needs, predict intents, segment dynamically, and deliver timely, relevant products, offers, and advice across channels.

For example, if the bank detects a new parent, it might recommend education savings plans or family insurance. Frequent online shoppers can see cashback rewards and real-time fraud alerts. A customer saving for a home might get personalized mortgage options tailored to their budget and timeline.

Benefits of financial services personalization

Nearly 92% of banking executives are ramping up investments in personalization efforts, betting it’s the key to reach customer satisfaction from the very first interaction through to long-term loyalty.

  • More effective customer acquisition

Offering the right product at the right time improves engagement and conversions, all while reducing customer acquisition costs (CAC).

For example, a Brazilian bank’s dynamic, personalized online banking menu drove a 56% surge in monthly loan applications and a 30% higher conversion rate. Similarly, the U.S. Bank’s tailored marketing campaigns, powered by a real-time customer data platform, resulted in a 127% increase in annual booked accounts. Moreover, as stated by Mastercard, leveraging available data in a right way to deliver personalized customer experiences from the very first page view helps banks optimize acquisition ROI and reduce CAC.

  • Higher customer retention

Today, 72% of banking customers prefer to stay with banks that anticipate their needs even before they’re articulated. When every interaction feels genuinely relevant and helpful, account holders remain loyal to such a level of care. Conversely, even the slightest hiccup in the way a bank develops its sales and marketing communication with a customer can drive churn.

We helped one of our clients, a prominent Czech bank, enrich their new conversational AI chatbot with a personalized virtual financial advisor. Pattern recognition under its hood allows the bot to anticipate customer needs and spot keywords, such as “pay”, “send”, “transfer”, etc. to give users faster access to relevant financial products.

By analyzing customer data, the chatbot provides tailored insights, proactively helping users reach their financial goals. A trial pre-subscription run of an AI-powered solution exceeded expectations, helping increase 30-day user retention by 7%. Read the full case study >>

Czech bank upgraded its chatbot with AI-powered personalization capabilities. Customers felt the difference
  • Revenue growth

By building personalized relationships with clients, banks get an additional revenue stream through up- and cross-selling their financial products, thus increasing customer lifetime value. In fact, banks excelling at personalization generate 40% more revenue from marketing activities compared to their peers, who rely on generic campaigns and broad segmentation. 

Reel in more customers, foster loyalty, and keep them engaged with smart banking personalization

Get started now

Challenges on the way to a personalized banking experience

A deep understanding of customer persona and customer expectations across all touchpoints of the customer journey is what leads to a seamless and personalized experience in financial services. As more and more customers want their bank to be as personalized as Amazon, financial institutions need to step up and deliver.

However, obtaining it isn’t easy as granular offerings are often hampered by common limitations present in the banking sector.

Legacy software

According to Deloitte, outdated technologies are considered the main bottleneck on the road to deeper personalization. Tech debt, the absence of real-time advanced analytics, and inflexible customer databases leave customers’ behavior unmotivated to finance organizations. As a result, companies lack strong cross-channel offerings, revenue growth, and, most importantly, a holistic vision of their customers.

Moreover, the lack of consistent data analytics stops banks from leveraging customer data as a competitive advantage. This means that banking institutions are unable to compete with tech-savvy banks by default, thus losing profit and potential regulars.

Organizational silos

Siloed data and isolated departments also hobble the successful adoption of a customer-first mindset and big data analytics. Silo mentality is detrimental to both internal and external policies since it limits data flows to a specific branch or employee. As a result, no uniform data governance approach is possible, making personalization and advanced analytics unviable at all stages of customer journey.

Typically, organizational silos refer to incompatible tech systems that cannot programmatically interact with each other. As a result, data is fixed in one department and segregated from other parts of the system architecture. Therefore, before implementing a new setup, companies can either update their whole infrastructure or connect legacy systems to the new infrastructure component.

Neglected customer needs

All too often, the banking industry focuses on products and financial solutions rather than customer needs. However, profound customer needs research is intrinsic to top-selling initiatives in digital banking. Without good customer experience, it is impossible to sell effectively and achieve business growth.

A well-shaped customer vision lays the ground for:

  • Competitive customer service
  • Smart digital banking
  • Relevant fees on banking accounts
  • Convenient branch locations
  • In-demand types of services
  • Positive brand image
  • Stronger customer relationships
  • Well-defined interest rates
  • Branch sales productivity

Luckily, the challenges above can be eliminated. Tech companies solve these problems by helping banks create and implement robust personalization strategies by putting all their existing data in place, analyzing it and offering personalized solutions at the right time and place.

Five secrets of acquiring and retaining customers through personalization in digital banking

The good news is that personalization in banking is attainable. By implementing advanced tech tools and digital-savvy approaches, financial institutions can tap into the hearts and minds of their customers and deliver initiatives polished to a tee. Here’s your secret sauce that will help you reel in clients and drive more value.

Establish a single source of truth

Some financial businesses have their customer data siloed across departments, which makes it isolated from the rest of the organization. As a result, the customer journey and personas are incomplete if created at all.

Clean, relevant, and accessible data is key to discerning the stimuli, preferences, and financial behavior of your customers. To create a single view of the client, financial services companies should unify and activate the miscellany of the operational data at hand. 

However, data unification and activation require the elimination of organizational silos and system modernization. Data lakes and warehouses contribute to delivering a 360° customer view and promote interoperability and immutability of data. Within them, data is drawn from multiple locations across departments, with all input being analyzed by specific criteria. 

Once the analysis results are ready for use, custom or platform-based Business Intelligence tools visualize the insights and prepare new reports so that businesses can monitor and compare crucial metrics and KPIs. For example, a loan department can source specific transaction data from a huge data repository to amplify loan decision-making at any time.

Moreover, comprehensive data governance policies will maximize the use of big data and align data collection and classification across organizational boundaries. Data governance also connects the data points in a cohesive whole and standardizes them across warehouses, lakes, cloud storage, and databases.

To better understand a customer, banking leaders also enrich their data collection through external APIs. This increases access to additional customer insights premised in enterprise and accounting systems as well as partner and public datasets such as PSD2 account information.

personalization

Tap into generative AI capabilities

Follow the lead of forward-thinking banks doubling down on generative AI across multiple use cases to freshen up customer experience, cut out tedious tasks, and stay competitive with digital-first challengers.

  • Personalized experiences on a frontline

Old-school, rule-based banking chatbots are frustratingly limited and rarely solve problems on the first try. The architecture of these solutions fundamentally prevents personalization. In contrast, virtual assistants with robust NLP under the hood are a whole different ball game when it comes to providing customers with effective, individualized care. Rather than just repeating scripted answers, they understand context, detect intent, and anticipate needs. Beyond hyper-personalized customer service, your banking app can also be boosted with features like:

  1. Instant account updates (“Show me last month’s dining expenses”)
  2. Proactive push notifications (“You’re nearing your budget limit. Want to adjust?”)
  3. Personalized financial advice (“Based on your spending, you could save $200/month by refinancing.”) 
  • Personalized marketing content at scale

When you let deep neural networks and machine learning algorithms process structured and unstructured data, say, customers’ transaction history, social media activity, or demographic info, you dig into the very fabric of personalized messaging across your marketing collateral.

Not only does the quality level up, but the quantity does too, thanks to LLMs’ powerful natural language generation capabilities. Accenture shared how a retail bank they worked with managed to produce 30x more high-converting marketing content with no delay in turnaround.

  • Risk assessment

Traditionally, evaluating a borrower’s creditworthiness involved manual reviews, gut instincts, and incomplete data. Mistakes were costly, either in the form of bad loans or missed opportunities.

Generative AI changes that. By analyzing vast datasets including spending patterns, market trends, and even subtle behavioral signals, machine learning models can predict risk with startling accuracy and generate further informed guidance in a couple of seconds. That way, banks approve loans faster, with fewer defaults, while customers benefit from fairer, more tailored terms.

Build lookalike audiences with ML

Since it’s really hard to yield tailored experiences for each client, financial institutions often implement look-alike models. This classification technique helps identify customer groups that share similar segment-specific data, be it spending habits or age ranges. 

By analyzing a wide array of metrics, ML-based look-alike models produce evolving customer profiles. Accurate segmentation, in turn, allows banks to predict the clients who are most likely to respond to particular financial services. In simple terms, finance companies get a smart opportunity index that allows them to create accurate marketing strategies and build a personalized banking experience that drive true value to clients.

Integrate life-event data

Customer profiling can never be too deep. Therefore, any bit of valuable information contributes to more awareness about customers’ behavior. On this line, event data, which describes actions performed by a client, can yield measurable or otherwise analyzable insights. As a result, finance firms can immediately react to new customer interactions and offer personalized services.

Companies from the financial services industry can leverage data from third-party events to hunt for new customers. These may include communication tools, social media data, and other third party financial apps. To enable automated processes and real-time data tracking, finance institutions must have this data integrated with in-house tools.

However, as third-party data sharing practices are tightening, integration approaches are subject to a wide range of regulatory acts that include GDPR, Dodd-Frank, MiFID II, and others.

Alternatively, banks can collect and integrate in-house event data to retain loyalty. On-site financial infrastructure with event-based architecture and event streaming are already awash in data coming from corporate sources. That being so, by sharing events across the company, finance businesses have an event data set ready for analysis. If we combine historical data with real-time insights, this further adds predictive capability to event streams.

Moreover, event data on its own can help create contextualized customer engagement opportunities in real-time. It means that when the client decides to choose new banking products when checking their account balances, for example, and leaves the application form unfilled, the system will notify the bank of the lost opportunity. This, in turn, allows banks to re-engage the client right away.

Another example of well-done event data management in digital banking includes real-time spending categorization. When a client makes a purchase at a grocery shop or gets gas, the bank’s money monitoring tools notify the client of the spending type and budget portfolio, keeping the client aware of their spending pattern. This nice touch on a customer’s financial well being nurtures brand connection even with no real interaction with the client.

Be where your customers are

70% of banking customers expect consistent interactions across all digital channels. Therefore, omnichannel excellence isn’t just one of the buzzword industry trends, but a necessity. Digital-first finance companies should deliver uniform experience and service to clients across multiple digital channels simultaneously. This, in turn, intertwines all client touchpoints and allows organizations to target the user with bespoke offerings based on previous customer interactions with the company’s platforms.

For example, customers can be served with granular ads on social media or ad-friendly websites after browsing information on a certain bank credit card or loan offers. Also, interrupted application processes can be remediated with personalized mobile notifications if a client has a banking app on their smartphone.

cross-chanel personalization

Major banks are already following the omnichannel principle. For instance, U.S. Bank has created a unified customer information database to ensure an omnichannel experience for users across 3,000+ branches in 25 states.

To ease the strain on the marketing department, banks can resort to marketing automation. The latter takes over multifunctional marketing efforts and facilitates sending personalized offers across the channels, whether it’s a mortgage loan or a retirement plan. Businesses that leverage marketing automation tend to land +451% of qualified leads.

From a tech standpoint, marketing automated tools lean on cross-channel data, feeding on email, website, app, and other interactions. The software then streams segmentation and targeting processes to group the right audiences and calibrate messaging to each customer automatically based on their profile. Being a competitive asset, marketing automation reaches customers on a personalized level, no matter the audience size.

Reimagine customer experience through personalized banking services

Banks of all kinds – traditional financial institutions and digital challengers alike – are realizing big gains by treating customers as individuals. By putting customer data to work (safely and ethically) to generate personalized financial advice, alerts and offers, banks can measurably raise retention rates, increase cross-selling/up-selling, and establish stronger account holder relationships.

To enable personalized banking initiatives, financial institutions need to establish an updated data infrastructure that allows for real-time analysis, exhaustive data collection, and intelligent capabilities. A concise data governance strategy will glue all components of your setup and initiate a data flywheel to get continuous valuable insights.

Design a robust personalization program and build new capabilities for managing the data-to-decisions value chain 

Get in touch

When Data Goes Bad: How To Improve Data Quality?

There’s a clear connection between the quality of your data and the efficacy of organizational decisions. The idea of ‘garbage in, garbage out’ is relevant here. When companies fail to understand how to improve data quality (DQ), it can backfire in a huge way. Fixing issues caused by bad data can take away up to 25% of their annual revenue. Furthermore, it can disrupt their progress toward digital transformation.

How to turn this loss into a profit and leverage data quality as a competitive advantage that will reshape your position among rivals and boost your data analytics? We’ve listed common issues you may face while dealing with data and outlined a data quality strategy.

Six possible issues you may face on your way to improve data quality

Data has particular quality characteristics – completeness, validity, uniqueness, consistency, timeliness, and accuracy. There are a number of issues related to them. Bad DQ results in:

  • Data silos. According to McKinsey, multiple data lakes and warehouses with no common data model are one of the top challenges at the enterprise level. Even if you have only one warehouse, analyzing data becomes troublesome when your data is scattered across multiple enterprise systems.
  • Human errors. When customers or employees make typos such as writing “Minesota” instead of “Minnesota” when entering information manually, you get data that doesn’t represent reality.
  • Duplicated data. When one employee enters customer data into your CRM, and another records the same customer data into another system, you end up with duplicates. If they are not completely identical, then there is a problem: which one is reliable? 
  • Invalid data. The analysis doesn’t make sense if you get just any data instead of the data you need. An example of this error is when the name field is filled with surnames. Imagine yourself having a whole table of Smiths when you need to determine which of your regulars deserves a personal discount. 
  • Missing values. If you want to build a data-driven culture, missing data is unacceptable for statistical procedures. If some obligatory fields aren’t filled out, you can’t analyze the data and take action. For instance, if you are collecting data on the age and gender of your buyers in a customer satisfaction survey, some of them might not reveal their gender if only “female” and “male” options are offered. This may be related to young people identifying themselves as non-binary, queer, etc. 
  • Inconsistent data formats. You may feel like you’re going through hell when having to handle dates entered in European and US styles. 

High-quality data makes data governance easier. And if you can confidently manage data, you can confidently manage the whole company. That’s why raising DQ is one of the top priorities for the next 6-12 months for 91% of organizations. If you are still undecided about how soon you should start fixing your DQ, this is your sign to not put it off until tomorrow.

data quality

How to mitigate data quality issues: embrace state-of-the-art technologies 

Before answering the question: how to improve data quality, you need to figure out how to improve data management first. Focus your attention and budget on the adoption of new technologies. There are at least two possibilities to facilitate your data quality enhancement journey:

  • Take advantage of automation to eliminate human errors. For instance, adopting robotic process automation (RPA) frees your employees from monotonous, repetitive operations, erases the possibility of human error, and lowers the cost of processing data by up to 80%. For example, with RPA, you can simplify data entry, data profiling, etc. The technology allows you easily convert all dates into one format, verify the absence or presence of the data, its actuality, as all these actions can be reduced to a clear algorithm performed by a bot. Besides, in highly regulated industries such as healthcare, automation improves compliance with numerous protocols (HIPAA, PSQIA, GDPR, etc.) and, thus, helps to create a better customer experience.
  • Leverage Business Intelligence (BI) to have a comprehensive view of the quality of your data. You have to regularly evaluate your data to ensure that the information is still reliable for business operations. 

Cooperation with experienced BI analysts is key. They help you figure out which questions you need to answer, what story you want to tell with your data, and create a custom dashboard based on that information.

A generic dashboard can show the extent to which the data meets data quality requirements. According to Gartner, tracking data quality metrics helps improve them by 60%. 

Data Quality

You can also provide your data scientists and engineers with more granular dashboards that visualize the stories of issues underlying major data quality problems.

Data Quality

Use BI consulting services to decide where to start your data quality improvement journey and identify appropriate technologies to help you along the way. 

How to develop a robust data quality improvement strategy

One-off initiatives and ad-hoc actions treat the symptoms, not the disease. You need long-term strategic adjustments to empower your staff with advanced analytics at all organization levels. That’s why, before jumping into a DQ initiative create a data quality strategy (DQS). We’ve listed six vital elements of it.

1. Do an inventory of your data and describe the issues

Developing a common vision of data quality for employees from different departments is essential. To achieve it, answer basic questions such as: How much data do you have? What types of data do you collect and store? How many errors are there in the data? What kind of errors are these? 

2. Develop your requirements and objectives 

At this stage, you should identify the stakeholders of the future data quality improvement process. The more experts that can evaluate the data from different perspectives, the more accurately you can define the DQ requirements and aspirations for your organization and the best practices to improve data quality. 

It may turn out that your company needs dedicated employees who will assess the quality of data according to key parameters – the data stewards. They are responsible for what data you keep in your organization, enforce internal rules on how data can be used and track the movement of the data inside the company. A data steward’s mission is to coordinate all the business processes and decisions that arise from your DQS.

Don’t forget to set an approximate timeline for implementing a data quality improvement plan, as it depends on the scale of your organization.

3. Set priorities for different data sets

Working on the quality of customer data and the company’s internal data simultaneously is great. But if your budget is limited, you need to choose the improvement of which data is the priority for your business success and growth. By enhancing the quality of the data related to the customers’ personal information, you can personalize their experience and increase customer experience and satisfaction. However, revamping the organization’s internal data can bring you just as much benefit. Having high-quality data about your staff, you can fully reveal the potential and talents of your employees and uncover how to optimize the processes within a company.

4. Select technologies and tools to improve data quality

Given the sheer number of offerings for data collection, data cleansing, etc. on the market, it turns out to be time-consuming and tricky to compare their features, licensing costs, payment options, etc. Consider that if you are burdened with outdated software, the task gets more complicated as you may need to modernize it.

Adoption of new technologies and tools may require more inside-out knowledge than was initially expected, so choose tech partners who are an old hand at handling data issues.

5. Identify the roles and responsibilities for stakeholders

At this stage, you settle on the tasks assigned to the data stewards, data engineers, business analysts, executives, etc. For the boat of your data quality improvement strategy to sail smoothly, you need many hands rowing in the same direction. A data steward can track data quality standards across the organization and in particular projects, business analysts prioritize tasks from the perspective of business benefits, and C-suite members make final decisions about what actions should be taken.  

6. Set KPIs to evaluate the progress

What degree of data quality do you want to achieve in six months, in a year? How much time can it take your employees to correct errors of different types? To what extent do you expect to reduce them? An experienced business analyst can help you determine the realistic KPIs for your organization.

When the time period you’ve designated as a benchmark has passed, analyze achieved results, review your data quality improvement strategy, and modify it if necessary. 

The draft of your data quality improvement plan may look like this.

Data Quality

Clean up the way for accurate data analysis and genuine insights

The quality of the data you process determines how valuable the insights will be. In some way, without advanced analytics, an organization is deprived of the future, at least one, that is bright and prosperous. 

You can partially and temporarily solve burning data quality issues by adopting modern technologies and best practices. But it’s like putting out a fire in one room when an entire building is engulfed in flames. Creating a data quality improvement plan is a surefire way to pinpoint what to do with your data to enhance its quality, how to do it, who is in charge of the process, and track the progress to analyze when you can achieve an expected outcome.

Want us to tackle your data quality issues and outline the roadmap to success?

Reach out

FAQ

Why is it important to improve data quality (DQ)?

“No money, no honey,” they say. This rule also works for the information – you can’t expect more than run-of-the-mile insights if your raw data is of low quality. Improving DQ should be a top priority for any organization as data is a competitive advantage that can influence your position among competitors.

How can we improve poor data quality?

You should evaluate the data from different perspectives to outline the ways to improve data quality. Start with the basic characteristics such as completeness, validity, uniqueness, consistency, timeliness, and accuracy. Involve employees from different departments to ensure that the initial data quality analysis and future expectations related to it are the same for all stakeholders.

What are the steps for improving data quality?

To solve the problem in a holistic way, you need to develop a data quality improvement strategy. It includes analyzing and describing your actual DQ issues, developing your requirements and objectives, setting priorities for different data sets, choosing technologies and tools to improve data quality, identifying the roles and responsibilities for stakeholders, and setting KPIs to evaluate the progress.

What is a data quality strategy?

Data quality improvement strategy is your plan on who, what, how you interact with your data to enhance its quality and when you can expect the results. It’s also an indirect way to promote a data culture in your organization since employees from different departments are engaged in the strategy’s development.

Accessibility For Apps: Guidelines, Examples, and Best Practices of How to Care About the User

According to the WHO, 15% of the world’s population experiences some form of disability. In most cases, aware societies strive to balance health disparity so that this population cohort doesn’t feel any barriers to an acknowledged quality of life. And it works just fine until a person with a disability faces a situation when something is out of their reach because of poor mobile app accessibility. 

Our developers and UX/UI designers will walk you through what can be done to increase the accessibility of your mobile app and provide time-tested tips on simplifying the task with the help of generative AI.

Why does mobile accessibility matter?

Making your applications inclusive isn’t a matter of social responsibility only. Along with diversity cultivation, accessible mobile applications unlock an additional revenue stream, give your company competitive tailwinds and help meet compliance regulations.

Empathy

As we age, we all face some limitations, be it impaired hearing, lowered sense of vision, or motor impairment. Moreover, situational and temporary disabilities can put all of us into similar settings that individuals with a long-term disability have. Therefore, mobile accessibility is a long-term investment that, among other things, helps us take care of the older generation, our older selves, and those struggling with the temporary condition.

Assistive technology is also an important strategy to better integrate people who face additional challenges into the modern world and online communities.

Competitive advantage

According to statistics, one in six people has a disability. By making your solution inclusive, you cover an additional 61 million users, which expands the user reach of your application. 

Besides, tech inclusion is commercially interesting. The buying power of people with disabilities is around $13 trillion. Considering the number of inaccessible apps, your app and mobile device accessibility can reel in this additional revenue stream.

Mobile phone accessibility also reduces the operational costs of your business. A Dutch SNS Bank reduced the number of call center calls and associated expenses by over 15%. The savings are associated with mobile web accessibility changes the bank made earlier.

Accessibility makes better tech for everyone

Tech inclusion is essential to some, but useful for all. Closed captions, virtual assistants, and speech recognition software are the go-to features for all users, including people with disabilities. Voice route directions, for example, are both an accessibility feature and a hand-free option for drivers. Therefore, making your solution all-in will benefit everyone.

Compliance with standards and regulations 

In many cases, mobile app accessibility standards are required by law. The Americans with Disabilities Act Standards for Accessible Design, or ADA, mandates the inclusion of all people, in all areas of public life, including web-based businesses and their applications.

The ADA law also works alongside the Web Content Accessibility Guidelines (WCAG) which documents a single shared standard for web content accessibility. The current WCAG version 2.2 was published in October 2023.

By 2025, all EU-based companies must also optimize their services and products for accessibility to comply with the European mobile app accessibility guidelines.

Better brand image

Finally, digital accessibility benefits your brand and creates more opportunities for brand advocates, as up to 73% of customers believe that a company should take a clear stand on social issues.

How to ensure mobile app accessibility?

As of today, Web Content Accessibility Guidelines, or WCAG, are considered to be the benchmark for website accessibility. The guidelines also feature WCAG for mobile, which outlines mobile accessibility best practices. Below, we’ll talk about what your application should be like to be truly accessible according to WCAG.

Keep in mind that each principle includes three levels of conformance, where A is the minimum level and AAA stands for full conformance. Most organizations strive to score AA as a golden mean. 

Perceivable

Making your solution perceivable means that users must be able to perceive it with one or a few senses. In simple words, if your app’s content is geared towards a visual experience, it should have an alternative that involves auditory perception or any other sensory modality.

What can be the problem here?

  • No text alternatives 

Some solutions may fail to offer text alternatives for non-text content featured on screen, be it controls or images, in a way that is perceivable by the screen’s reader. It inherently makes the app unreadable for TalkBack or VoiceOver, which are default screen readers on Android and iOS respectively. 

On the contrary, speech descriptions make all non-text data accessible for the blind or people with low or weak vision. Facebook, for example, has rolled out automatic ALT text to describe visual content for screen readers.

an example of automatic ALT text describing visual content on Facebook
  • No adaptability

A mobile solution overlooks accessibility when its structure isn’t readily adjustable to different content presentation structures and orientations. In particular, an inclusive product can switch to both landscape and portrait without sacrificing content or elements just like the example below.

an example of an adaptable user interface

Native mobile app accessibility guidelines also require your product to mark up information, structure, and hierarchy between elements. This way, headings, tables, and lists will remain intact when the presentation changes, keeping your layouts simple and consistent.

Adaptability is essential for people with motor impairments, screen reader users, as well as people with learning difficulties and cognitive fatigue.

  • No distinguishing features

Inadequate contrast, a poor choice of colors, or the absence of text resizing take a toll on users’ perception. For instance, people with color perception issues struggle to distinguish between certain colors. Therefore, colors shouldn’t be the only way to convey differences or prompt action. Instead, combine color and text or character cues to convey information.

a juxtaposition of two illustrations highlighting the importance of text and character cues for interface accessibility
a juxtaposition of two illustrations highlighting the importance of a right choice of colors

Loss of content or functionality is another common accessibility issue that typically occurs when a visually impaired user zooms the text. Your mobile accessibility settings must allow for increasing by up to 200% while retaining all content and elements.

Operable

This principle necessitates your application to include fully-operable interface and navigation elements so that the user can make use of every feature regardless of impairments or disabilities.

What can be the problem here?

  • Lack of time

Given the diversity among people, it’s difficult to predict how much time it takes to browse through the app or find a specific section. Most banking applications, for example, have a maximum session time as a security measure. However, time limits or time-sensitive content makes it inconvenient for a screen reader or an elderly user to process information.

Flexible time limits or the turn-off option, on the contrary, make your application more friendly to seniors, sight-impaired persons, or foreign speakers.

  • Flashing content 

Blinking content is a red flag for inclusive applications as it can provoke seizures or other undesirable effects. Thus, individuals who have photosensitive seizure disorders simply cannot look at flashing lights or contrasting visual patterns without having an adverse physical reaction triggered by them. That’s why it’s important to avoid content that flashes over 3 times in 1 second and limit the area of flashing to a small portion of a smartphone’s screen.

an example of a flashing content warning
  • Navigation

Navigation that is neither programmatically tagged nor structured can also prevent a user from consuming the content. It holds especially true for visually disabled users that can only navigate your application with assistive technology as well as people with cognitive and motor disabilities.

Landmark regions, descriptive headers, unique screen titles, and labeled controls enable both users and screen readers to locate the needed section quickly and with fewer keystrokes. The application can also be coded to skip graphics and navigation links when consuming the content with a screen reader.

Tastemade, for instance, is a great example of full-screen navigation at work, while the example on the right sacrificed discoverability for a sleek design.

an illustration pointing the importance of a full-screen navigation

Understandable 

According to this accessibility principle, all information and your entire user interface must be easy to grasp for any person regardless of their health status. Simply put, the more intuitive and straightforward your application is, the more chances it has to score the AAA conformance level.

What can be the problem here?

  • Predictability

Some applications prefer to hide design elements behind sophisticated icons or employ futuristic user flows. While such designs are admirable works of art, they lack clarity. 

Hamburger menus, for example, are a widely accepted standard for mobile app development that simplifies menus for compact screens. However, they are neither navigable nor predictable for people with visual disabilities, cognitive limitations, motor impairments, and reduced dexterity. The desktop version of Telegram, for example, has a hamburger menu button.

Hamburger menu vs bottom menu

The overriding objective of predictable design is to set accurate expectations about what will happen next through consistent design patterns, standard semantic elements, and ordered information structure. An accessible application should also have all elements easily discoverable on the screen to give an accurate understanding of where the user is now. Bottom navigation, vertical sidebar, or sticky menus play it right.

  • Input assistance

Some users with lower quality vision, and with reading and intellectual disabilities may find it challenging to enter the information error-free or differentiate between mandatory and optional fields. To provide assistance, an application interface can include cues in the fields to reinforce important information.

The cues may range from labeled attributes for screen readers to select states and rounded corners. 

examples of bad and good design in terms of input assistance
  • Error prevention

On the same note, typical error indication methods may not work for individuals with low or impaired vision or color-blind people. Likewise, users with reading or motor disabilities have a higher chance of entering the wrong input, which can lead to serious consequences, including financial liabilities. Therefore, if the application doesn’t provide user-controllable data, it is not accessible.

Reversible submissions, order confirmation, deleting a record, or unsending a message are some examples of safeguards that will keep users from making a mistake.

Robust

Accessibility features should be seamlessly delivered across platforms and devices, including different versions of screen readers, braille terminals, or text magnification software. In simple words, robust design is immune to coding errors that can distort the content or functions in a web-enabled device or assistive technology. 

What can be the problem here?

  • Poor coding

If the HTML code behind your application lacks complete start and end tags, the app’s content may display differently across devices, not display at all, or be unreadable to assistive technologies. Well-formed HTML code that conforms to all markup language specifications makes sure that the accessible content structure will remain as intended across all platforms and devices.

Can cross-platform development provide a proper level of accessibility?

Cross-platform development is a Swiss army knife that accelerates time to market and kills two platforms with a one-code base. However, the accessibility potential of cross-platform development lags behind native applications. Therefore, cross-platform technologies are a tradeoff between accessibility and cost reduction, which can still guarantee at least a basic level of mobile accessibility on Android and iOS. 

Thus, Flutter app development is committed to making apps more accessible and includes built-in support for accessibility combined with the same capabilities of the operating system. Flutter can help you implement such accessibility features as large fonts, screen reader compatibility, sufficient contrast, and more. 

But keep in mind that mobile accessibility is a collective result of your whole development team, including Flutter developers. While UX/UI designers are dedicated to building inclusive interfaces, QA specialists make sure your final app version passes accessibility testing. 

Trust gen AI tools to review your app for accessibility issues

In the pre-AI era, accessibility excellence required intensive research and know-how from the development team. Tuning together inclusive features and a crispy interface may still be tricky, but the rise of AI-powered tools has fast-tracked resolving accessibility-related issues. 

For instance, UX/UI designers don’t have to manually review apps’ interfaces to spot accessibility defects. Software such as Stark, Userway, and Google’s Accessibility Scanner can automate the task. 

These tools are indispensable at the product design stage, where they scan Figma, Adobe, or Sketch files for compliance with WGAG and ADA requirements, fix minor issues, and highlight violations that require the UX designer’s input. 

There’s no need to decide between accessibility and design

Equal access to technology allows all people to actively participate in society and leverage tech comforts. Along with compliance conformity, mobile accessibility also contributes to a larger user base and competitive edge of your company. 

If you struggle to strike a balance between accessibility and design, our company knows how to score on both. Based on your unique requirements and accessibility standards, we seamlessly integrate inclusivity into a top-notch app design. Drop us a line to create a top-grade mobile solution that caters to all. 

CMO Priority in the Next Normal: Specify a Revenue Technology Team in Your Budget

Economic news shows tech giants are cutting back their budgets and staff, including highly coveted developers from product engineering teams. The marketing budget is suspected to face some headwinds in 2025 too. 

However, the most rewarding outcome arises from growth initiatives, not cost reduction, layoffs, or other slash-and-burn strategies. So now’s not the time to curl up in the fetal position. Instead, let’s be bold and build a revenue technology team.

So, what’s the best way to get ahead of the competition, while, given the economic situation, keeping costs under control? 

It’s high time to end the chaos and make massive gains in revenue again. The best place to start — your data. Chaos is caused by bad data. Bad data that should never have existed in the first place. Chaos, made by integrations that are no longer in use, SaaS subscriptions that no one touches, etc.  

But, when we dig deeper, we get to the heart of what that chaos really is: not having a clue as to where your next largest deal comes from or when it may arrive. Within all of the contacts you’ve collected and across all of the technologies being paid for, no one has the same answer of who is likely to become the next exciting customer and when to expect an even better deal. That’s the turmoil you feel every day. Unless…

A revenue technology team is a group responsible for your sales and marketing technology stack, aka MarTech. This might include a CRM, some call center software, an analytics tool (or three), a contact-information subscription, an email automation tool, etc. The revenue technology team’s job is to make more money sooner and cheaper through the use of technology, documentation, and training.

Do you want to know more?

Book a call

For revenue growth, they’ll vastly improve the identification of the very best prospects at the top of the funnel and then move those prospects to closure sooner and for a higher average dollar amount. What would a modest increase, let’s say 15%, in the average order value result in for your company?

Let’s focus on the savings. Imagine what more automation and more intelligence would do in terms of cost efficiency. Here are some examples:

  • What if you cut down your digital ad budget by 20% while surpassing sales goals?  
  • What if you reduced the number of screens and the number of clicks during an average support staff’s day by 50%? 
  • What if you could eliminate horrible customers by 90%?
Unveil the full revenue potential of your marketing and sales activities with a revenue technology team.

There are a ton of possibilities that are adding up fast. Here’s one more: what are the cost savings if you identified young affordable sales talent and promoted them to leadership positions, who teach even younger, even more affordable employees how to sell better? 

These are all real things people attain, which are critical for achieving scale no matter what the year is. The key to massive wins is having a holistic group of professionals working full-time on turbocharging your marketing and sales initiatives. The team basically looks like a software development squad. There’s a person to gather requirements from stakeholders, a person that codes within the platforms and integrates them with others, a person that does data analysis, a person to test the work, and someone to manage the process. Some of the roles can be combined, but you’re looking at a team of 3-5.  

And this small team has huge potential. By getting more money in the door sooner and for less cost and effort, they will provide the throughput needed to hit evermore challenging goals, is revenue throughput. There are two ways to increase throughput. You can either scrape away at the pipe’s walls bit by bit with a hanger you untwisted or install a bigger pipe. Seems like a no-brainer, doesn’t it? The latter option is much more favorable in terms of time and effort investments.

During any year-end, the time most suitable for setting new ambitious resolutions for the coming year, all CMOs should not only dream about, but advocate for a revenue technology team of their own. One that will not get sucked into product engineering and be obsessed with revenue operations. 2025 is no exception for this encouragement, and it’s a great year to highlight how a revenue technology team will improve the bottom line. 

Need a piece of advice?

Get a free consultation
Anna Vasilevskaya
AI modified real photo
Anna Vasilevskaya
Account Executive

Get in touch

Drop us a line about your project at
[email protected] or via the contact
form below, and we will contact you soon.