Why You Can’t Skip the Data Preparation Process in Data Discovery

In the modern world, data is king. It tells us everything we need to know about, well, just about everything. Data finds its usage in all spheres, from governmental processes to business, multinational enterprises, and more. But how does one go about analyzing data? Despite all the technology available, it’s not as simple as inserting some digits into a computer and getting all the answers you need. There are a few stages in between. Below we’ll talk you through data discovery and data preparation as part of it.

What is data discovery?

Before we get into the ins and outs of the data preparation steps, let’s backtrack a little and look at what the overall process of data discovery is. The data discovery process is a vital step in the business problem-solving framework or any data-requiring solution, and data preparation is a step within data discovery. 

Data discovery is often connected with business intelligence, meaning it is used to help companies make smarter, data-based decisions. But what happens in the data discovery steps? At this stage of data processing, data discovery tools compile multiple data sources together, creating a singular unified base of data. 

From there, the company undertaking the data discovery process develops its initial data model. It then utilizes it to test various hypotheses or discover valuable insights. One data discovery example would be a company using the power of data discovery in big data to uncover vital company insights that would help the project progress and meet market needs. For instance, a new feature to be added to an app, or designing an entirely new piece of software. 

How is data discovery generally done?

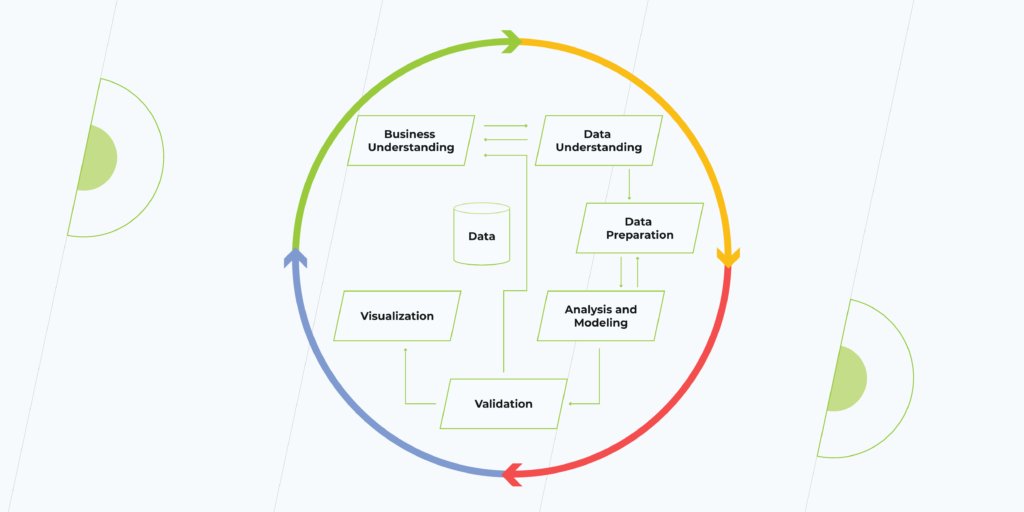
As we said previously, data discovery is a process undertaken in the broader problem-solving framework. Here’s how it fits:

  • Business issue understanding — at this stage, the issue at hand is defined. This allows the data scientists to refine which questions they need to answer from the data they will use. If done right, the data will support the project. If not, then it might be time to start from scratch.
  • Data understanding — here, all the required is defined and brought together from various databases to be collected and used for further processing.  
  • Data preparation — at this stage, data becomes refined and prepared for further analysis.
  • Analysis and modeling — using the prepared data, the first round of analysis is undertaken, and models built for data analysis.
  • Validation — the trained model is tested using a defined data set to check if the model is valid.
  • Visualization and presentation — here, the final results of the analysis are available and ready for data scientists to present them. Visualization tools help make data more understandable and readable to the human eye.
Can any data be used for data discovery, or do I need big data?

Data processing can be used at almost any stage of the company’s growth process, and you don’t need big data to get started—although it does help. In theory, to begin analyzing data, all you need are a few hundred rows of data, which can be collected via customer surveys, company dashboards, Google analytics, and more. What’s important here is the quality of the data, and that is where the data preparation comes into play.

What is data preparation?

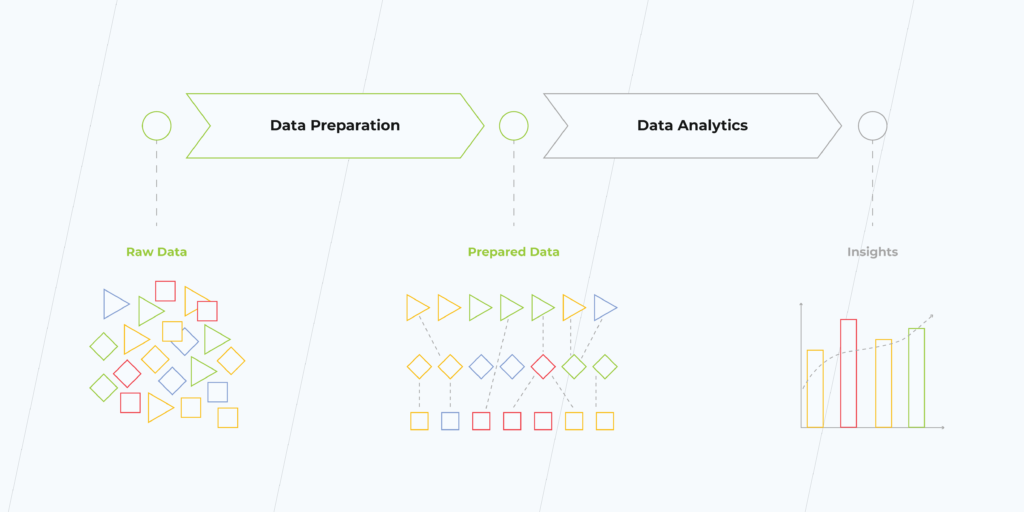
Data preparation is one of the most time-consuming phases of a data-based project. According to studies, it covers 70%-90% of all project time. With automation, however, and we’ll talk a little bit more on that later, this can be reduced to around 50%. Automating then leaves more time to polish data models and focus on getting the best analysis from the data. 

So, what is data preparation anyway? Data preparation is a process of enriching and cleansing data, making it more useful to give quality analytics. One way to look at it is by thinking of a diamond in the rough. When it comes out of the mine, it’s rough, dirty, but once polished. It becomes a beautiful stone that can be used to make a valuable piece of jewelry. But in this data preparation example, the diamond in the rough is data, and the polishing is the data preparation process. The result is valuable insights.

Why do you need data preparation?

Data processing and preparation may seem time-consuming, and indeed it is. However, that doesn’t mean it isn’t worthwhile. Quite the opposite. Instead, many companies find that employing the right data processing tools gives them the insights they require. Some of the benefits they boast are:

  • Improved decision-making capabilities
  • Easier data access on the whole
  • Increased analytical efficiency and flexibility
  • Time saved for making decisions
  • Comprehensive view of relevant data

Although it’s important to note that data science is an evolving profession, and as technology advances, so do the results. As we continue to refine the available data using the latest methods, more information will become available. 
What are the steps involved in data preparation?

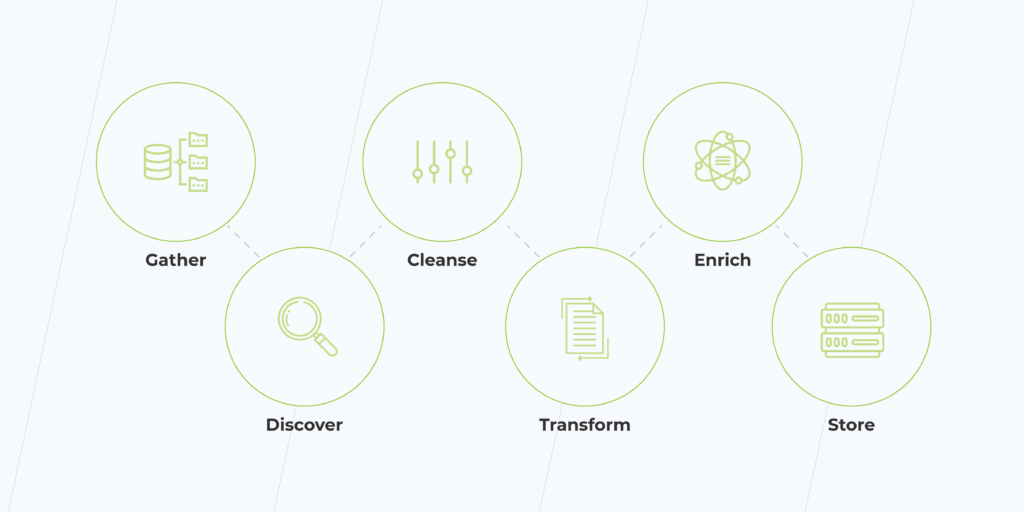
When it comes to data science, the tools involved are only as powerful as the quality of the data, and that’s what makes data preparation so essential. So what’s involved in data preparation? To understand that, let’s take a look at the data process steps:

1. Collecting the data. While this is closely associated with data understanding, it’s also the first step in data preparation—getting the data you need to do the work.

2. Assessing the data. Each dataset within the data should be discovered. This means knowing its purpose and context before you go any further.

3. Cleansing and validating the data. Now the hard work begins. In this time-consuming process, data is cleaned, and gaps are uncovered. Using manual and automated tools, such as machine learning (ML), data scientists can remove outliers, fill in data gaps, check if data conforms to a pattern, or review if data-protection issues have occurred.

4. Transforming and enriching data. At this stage, data may be formatted or further defined to ensure a better analytical outcome. Enriching may also occur, which means adding data or connecting the dots to unveil hidden insights for analysis.

5. Storing data for future usage. Once the data has been prepared, it must be stored the right way. Taking into account data protection requirements, such as GDPR, and the future usage of this data, it’s essential to store it correctly.  
What are the challenges of data preparation?

No technology or process is without its challenges. Here are some of the issues companies find when engaging in data preparation and processing.

Companies remain unsure how to use the data

Data is great, and having lots of it can empower your business with market conquering insights, but only if you know how to use it in the right way. Many businesses struggle to define the exact data they need, what it shows, and how to effectively implement it in business decisions. Getting the right people on board at the beginning can help your business make better use of the data it has to support your business goals and get that competitive edge. 

Biased data can slip through the cracks

Although AI technology has come on in leaps and bounds, it is built by humans, and therefore the algorithms it uses may be subject to bias. For example, exclusion bias means holding back info from the data set, leaving it incomplete. This means the data assessment will be flawed. Or consider selection bias. For example, data collected may differ from the target group, making data meaningless. Addressing these challenges means undertaking comprehensive data preparation to ensure data is suitable for use. 

Planning to take advantage of your data?

Learn how BI can contribute to your company

How to do data the right way?

  • Collaborate. Data science isn’t a one-team job. By collaborating between departments, for example, IT and business, companies find themselves getting results that are closer to actual business needs, not data for data’s sake.
  • Ensure good data governance. Data management is key, and this isn’t just a question of data security. Effectively managing your data means putting into action processes for data storage, data use and clearly defining the responsibilities of the teams that use the data. A little bit of organization goes a long way to getting the best results.
  • Get the right tools at your fingertips. The world of data has grown in recent years, far beyond Excel spreadsheets. Instead, it often requires advanced software or tools to help complete increasingly complex tasks. But that shouldn’t mean fear of technology. Getting the right tools on board early boosts the chances of good data and analytic outcomes. 

How to get the most from your data for your business?

With data science specialists some of the most elusive IT specialists on the market and vacancies set to grow by an estimated 15%, it may seem that getting the right person on your team is next to impossible. But there is a solution. Data discovery services can be covered by a skilled outsourcing provider. At the same time, you search for your data superstar, or perhaps you’d like to continue to outsource and take advantage of access to a team of knowledgeable data professionals.
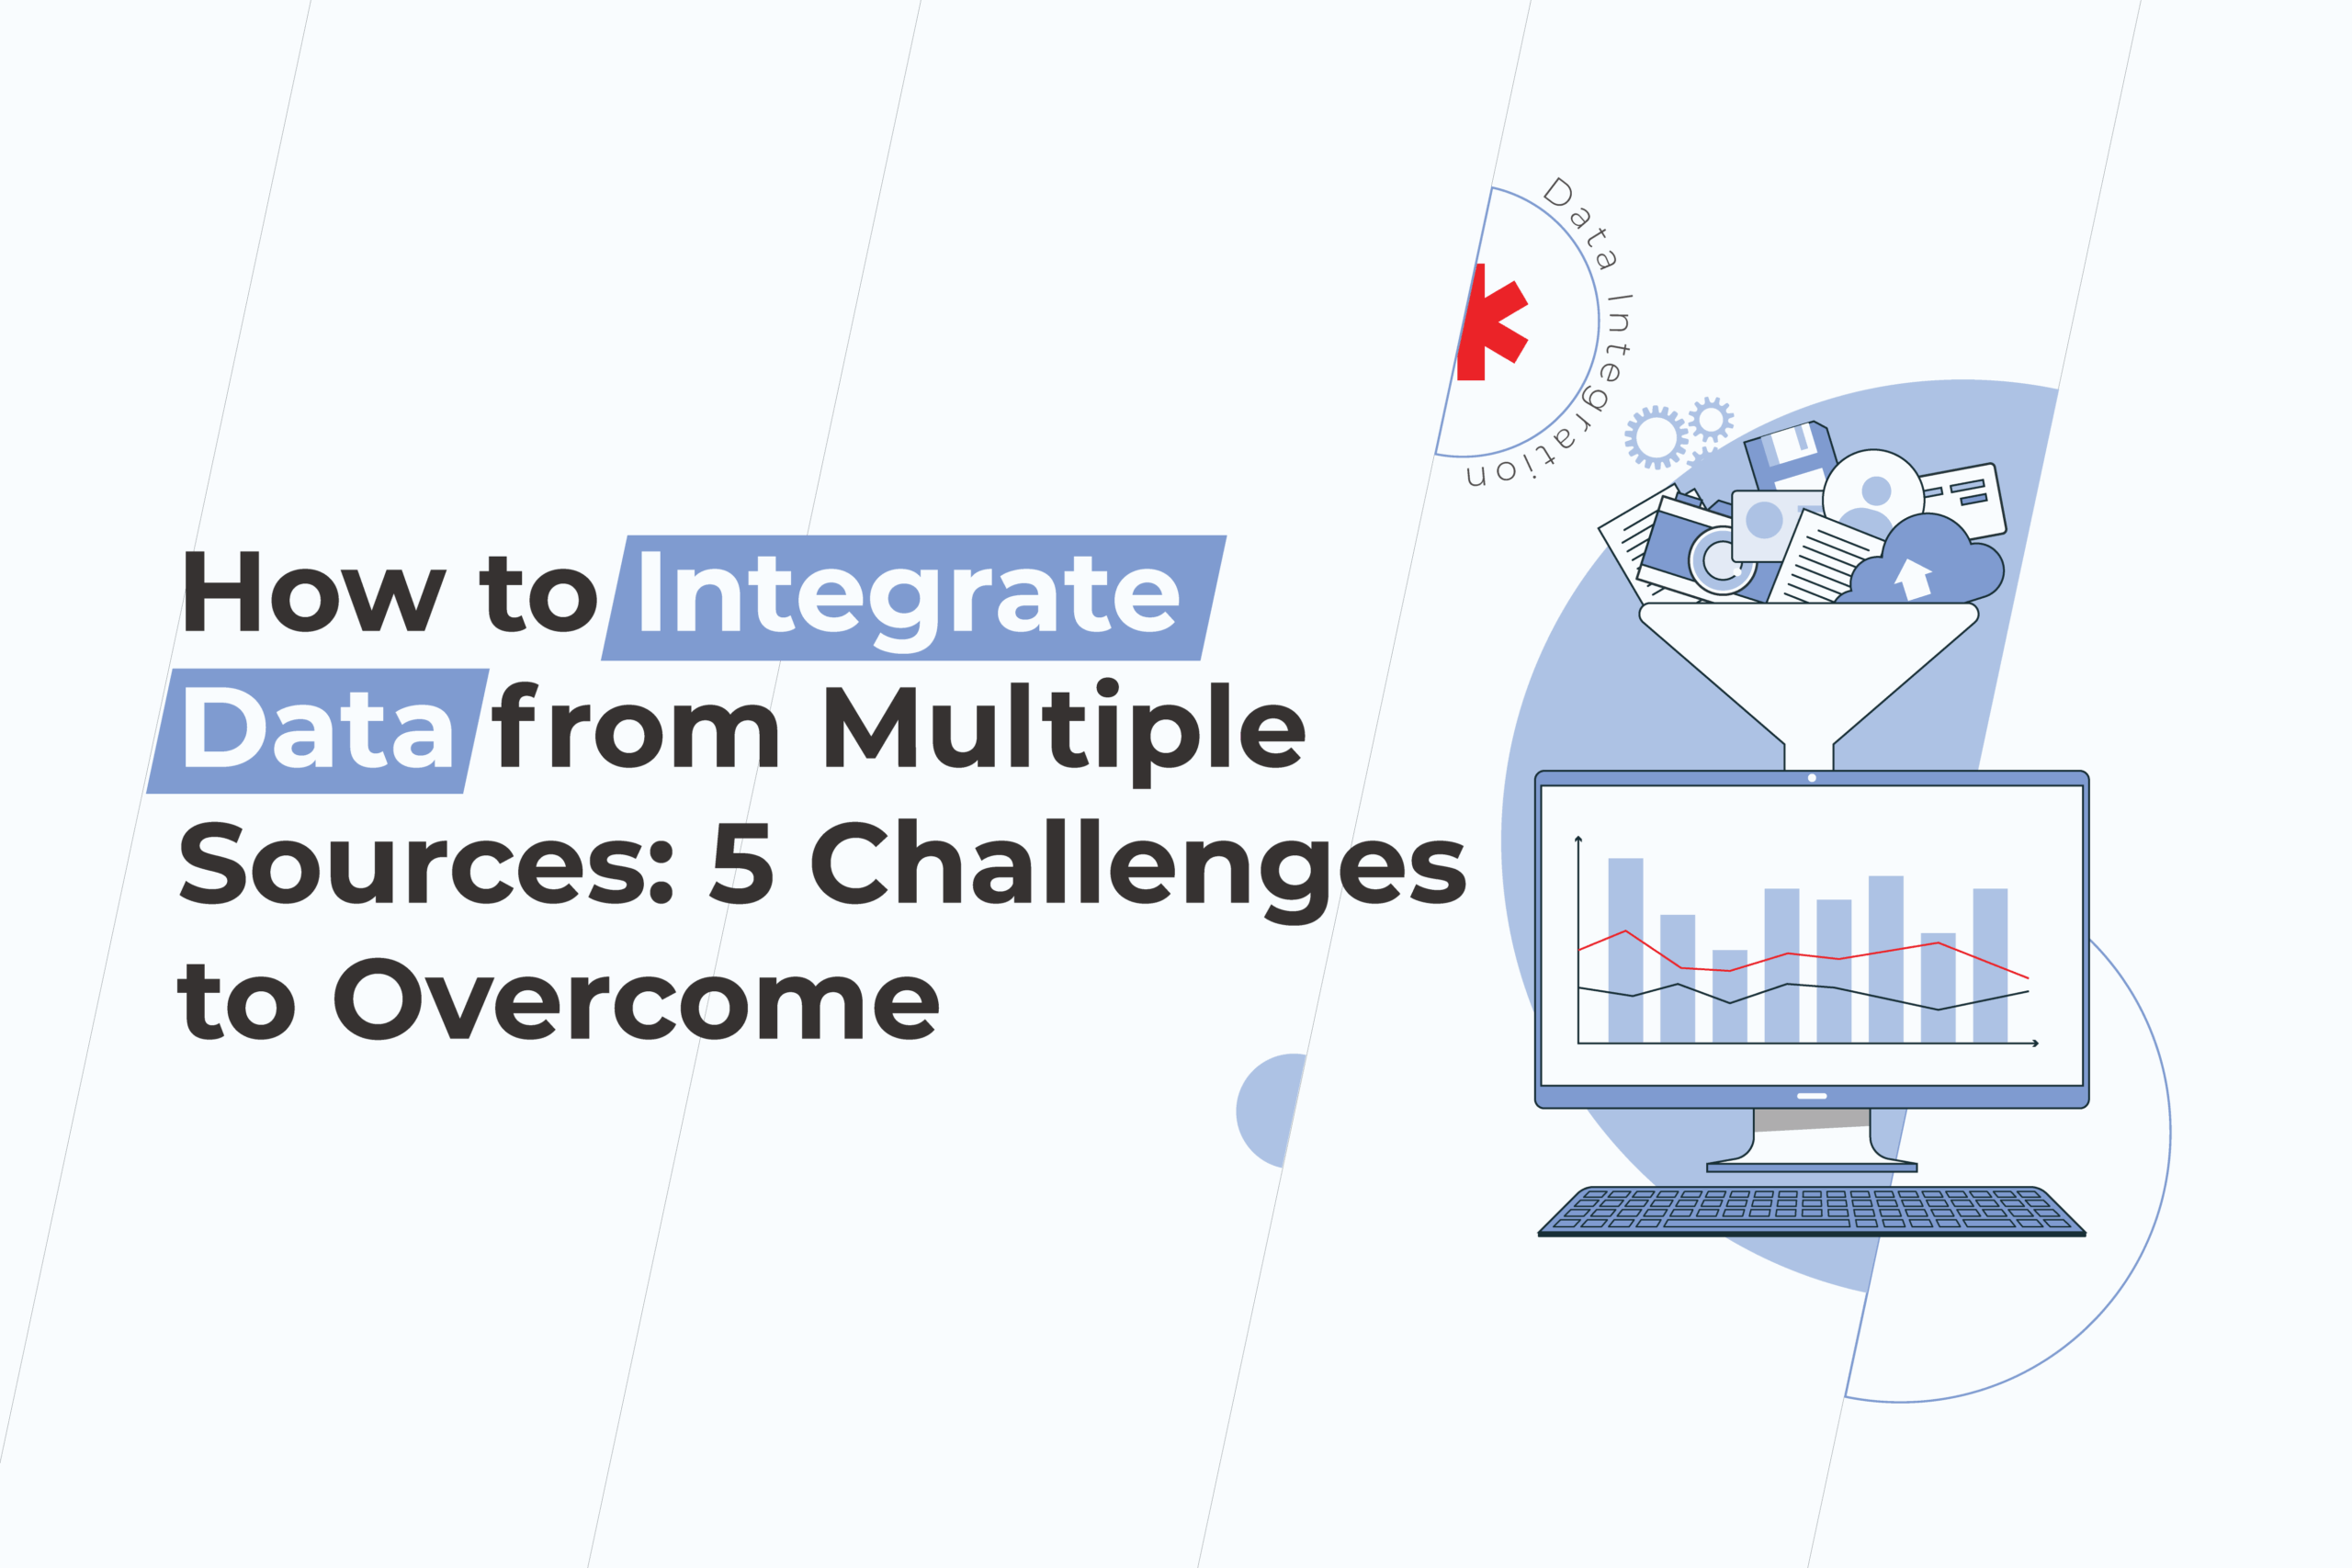
How to Integrate Data from Multiple Sources: 5 Challenges to Overcome

Most businesses deal with a gigantic amount of data on a daily basis. The question is how to make the most of it. It turned out the biggest issues associated with Big Data are not really analytical ones. In many cases, these problems refer to data integration.

Why is data integration important?

Perhaps, the only thing worse than a shortage of information is an overflow of information, which is inaccurate or useless. Although the lack of data makes one flying blind, at least, it provokes taking actions, while a number of low-quality pieces of information can lull businesses into a false sense of security. Intelligent decisions can only be based on trustworthy and relevant data – data, which is integrated from multiple sources into a single, unified, bird’s-eye view. This process, however, involves certain challenges, and to tackle them successfully, enterprises should be perfectly aware of what these challenges are. 

Data integration challenges

Data compatibility

integration issues

Databases, web applications, CRM systems, and many more – there are tons of sources that enterprise data is coming from. As long as each source has its own interaction rules, no wonder extracting, transforming, and making data compatible with a destination system becomes time and resource-consuming. Besides, it’s only getting worse with time since the number of data sources grows along with the company.

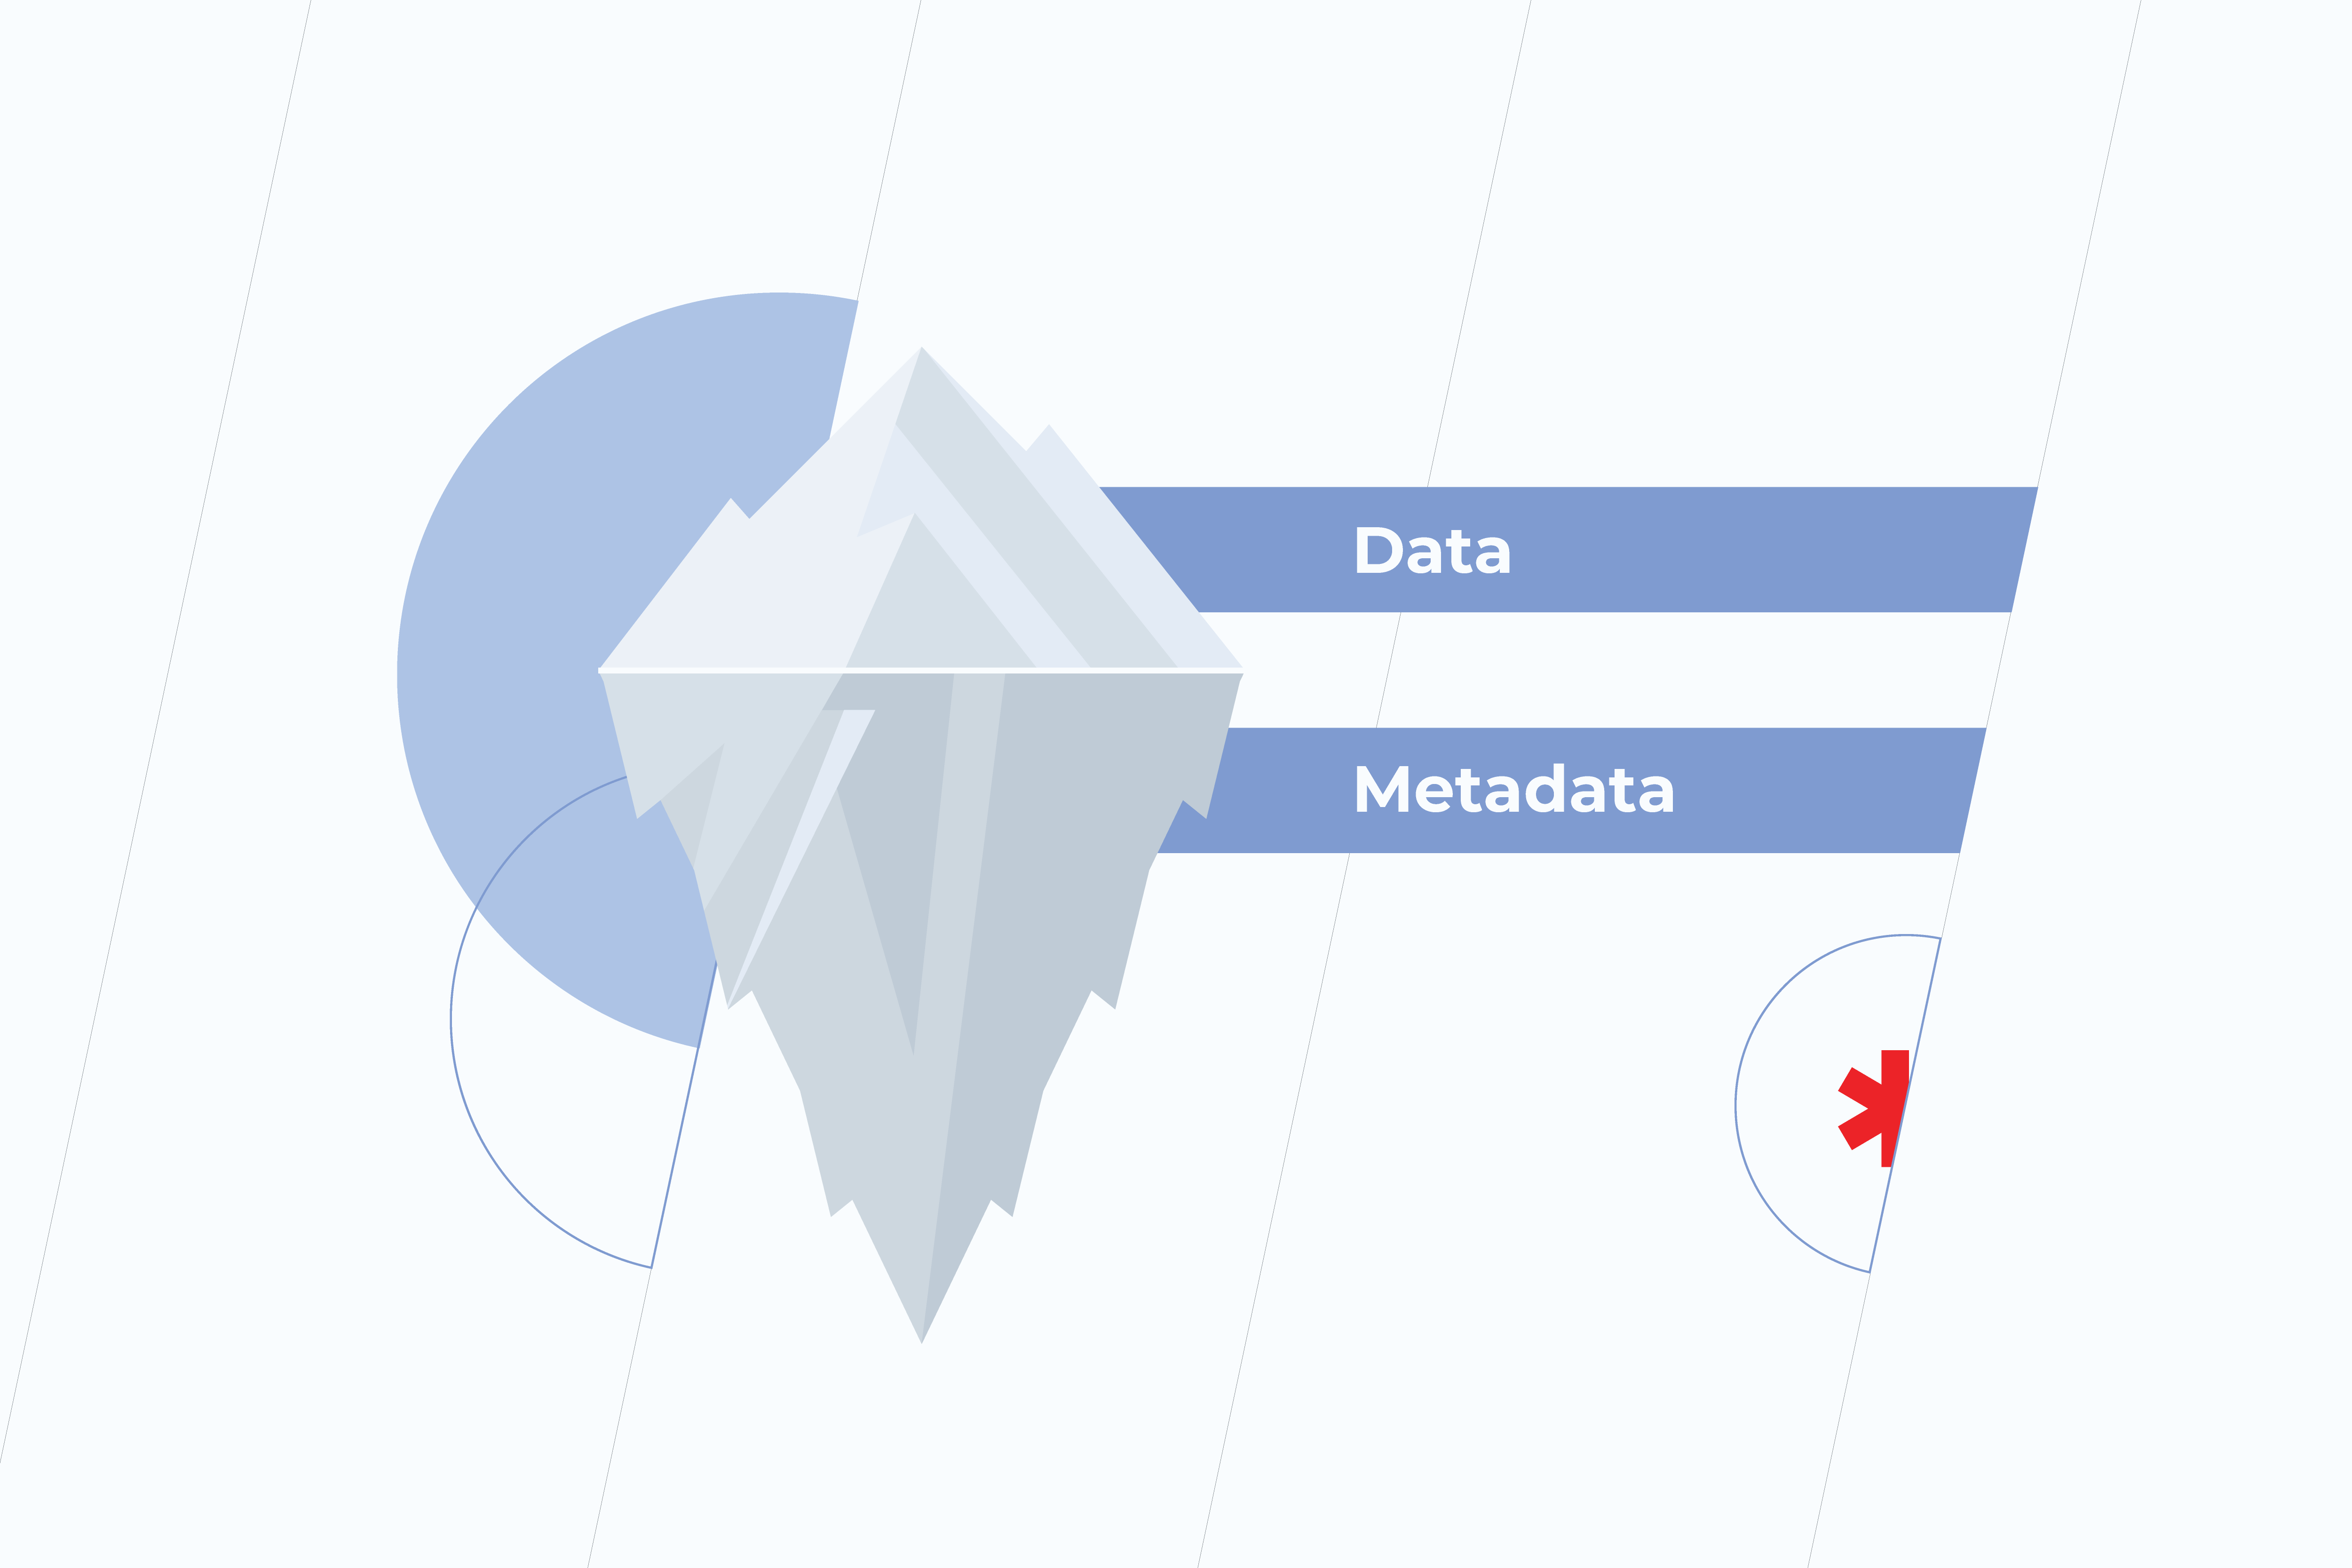
In a Big Data world, the best way to address this problem is using metadata, which, simply put, contains basic information about other data. It supports the validity, accuracy, and usability of related data. Metadata helps to harness the power of data, enabling your team to extract all the necessary information faster and more accurately, as a result, to speed up decision-making. Without metadata management, data initiatives can spiral out of control.

Data silos

integration issues

Data which is organized within individual departments might not be fully accessible for the rest of the organization. These separate sets of overlapping but inconsistent information turn out to be in silos. Doing nothing about it sounds like a bad plan since the quantity and diversity of data grows and so do silos.

This puts a huge barrier to a holistic view of enterprise data. When it comes to data analysis, data silos cause problems as the information is often stored in formats that are inconsistent with one another. Moreover, not having the shared data in one source often results in wasting time and effort on duplicated work.

The approach that addresses the aforementioned problems is called data harmonization. In a nutshell, it includes taking data from disparate sources, removing misleading or inaccurate items, and making all that cleaned and sorted data compatible.

Taking into account the size and complexity of data, smart data tools, Machine Learning, and Artificial Intelligence turn out to be the key part of the data harmonization process. They make it easier to prepare data from various sources, hence speeding up the adoption of big data techniques.

Data quality

Those, who at some point have analyzed data, understand the pain of discovering that it’s badly structured, incomplete or overflowed with inaccuracies. There might be several reasons for that to happen. First of all, human errors. Even such a seemingly insignificant mistake as spelling can bring about difficulties in data analysis. Secondly, storing data in disparate systems leads to the fields with the same meaning but different names occurred across systems. Finally, analysts might not be aware of the changes made to data by data administrators or engineers. Anyway, whatever the reasons may be, dirty data needs to be fixed. Otherwise, there’s a good chance to end up with inefficient analyses and distrust in organizational data.
A high level of data quality can be achieved by improving company culture and assigning certain roles responsible for accurate data, adopting best practices like the data quality cycle, and embracing technologies that support people in their processes via software features. Data quality cycle is made up of analyzing, cleansing, and monitoring data quality. Primarily, you have to define the data quality metrics that correlate with your business needs – you should understand what data to analyze and what makes data complete. Then, the data needs to be cleaned according to established business rules. And, certainly, to protect the quality of data, constant monitoring and checking of it is a must. 

Do the adjustments that have to be made seem complex? You can start with a few data optimization initiatives and gradually evolve. If they turn out to be successful you may continue launching other ones. With reliable data at hand, it can’t be long before you notice the improvements in your business processes.

Legacy systems

challenges in data integration

Legacy software is a double-edged sword for a company’s future development. On the one hand, it has proved to be reliable. On the other hand – it’s rarely compatible with newly bought systems. Anyway, it’s a long shot for legacy systems to fade away. They usually support a company’s mission-critical operations so replacing them becomes a daunting task.

A tremendous amount of business data and processes is tied up in legacy systems, but accessing that information and integrating it with other database systems can be very difficult. And, yet, no matter where your data resides, it’s a vital asset that must be leveraged to its fullest potential.

Fortunately for C-suites, who are not ready for major business transformations, a long-term software modernization project is not the only option. Another one is ETL (Extract, Transform, and Load) data integration. It’s a three-step process in which data is extracted from one or more data sources, converted into the required state, and loaded into a data warehouse. Being equipped with connectors that allow an enterprise to combine legacy data with data collected from new platforms and applications, ETL makes your legacy data available. This provides a historical context through which organizations can recognize long-term trends. Historical context helps companies to derive useful insights for better strategic decisions.  

Unoptimized data

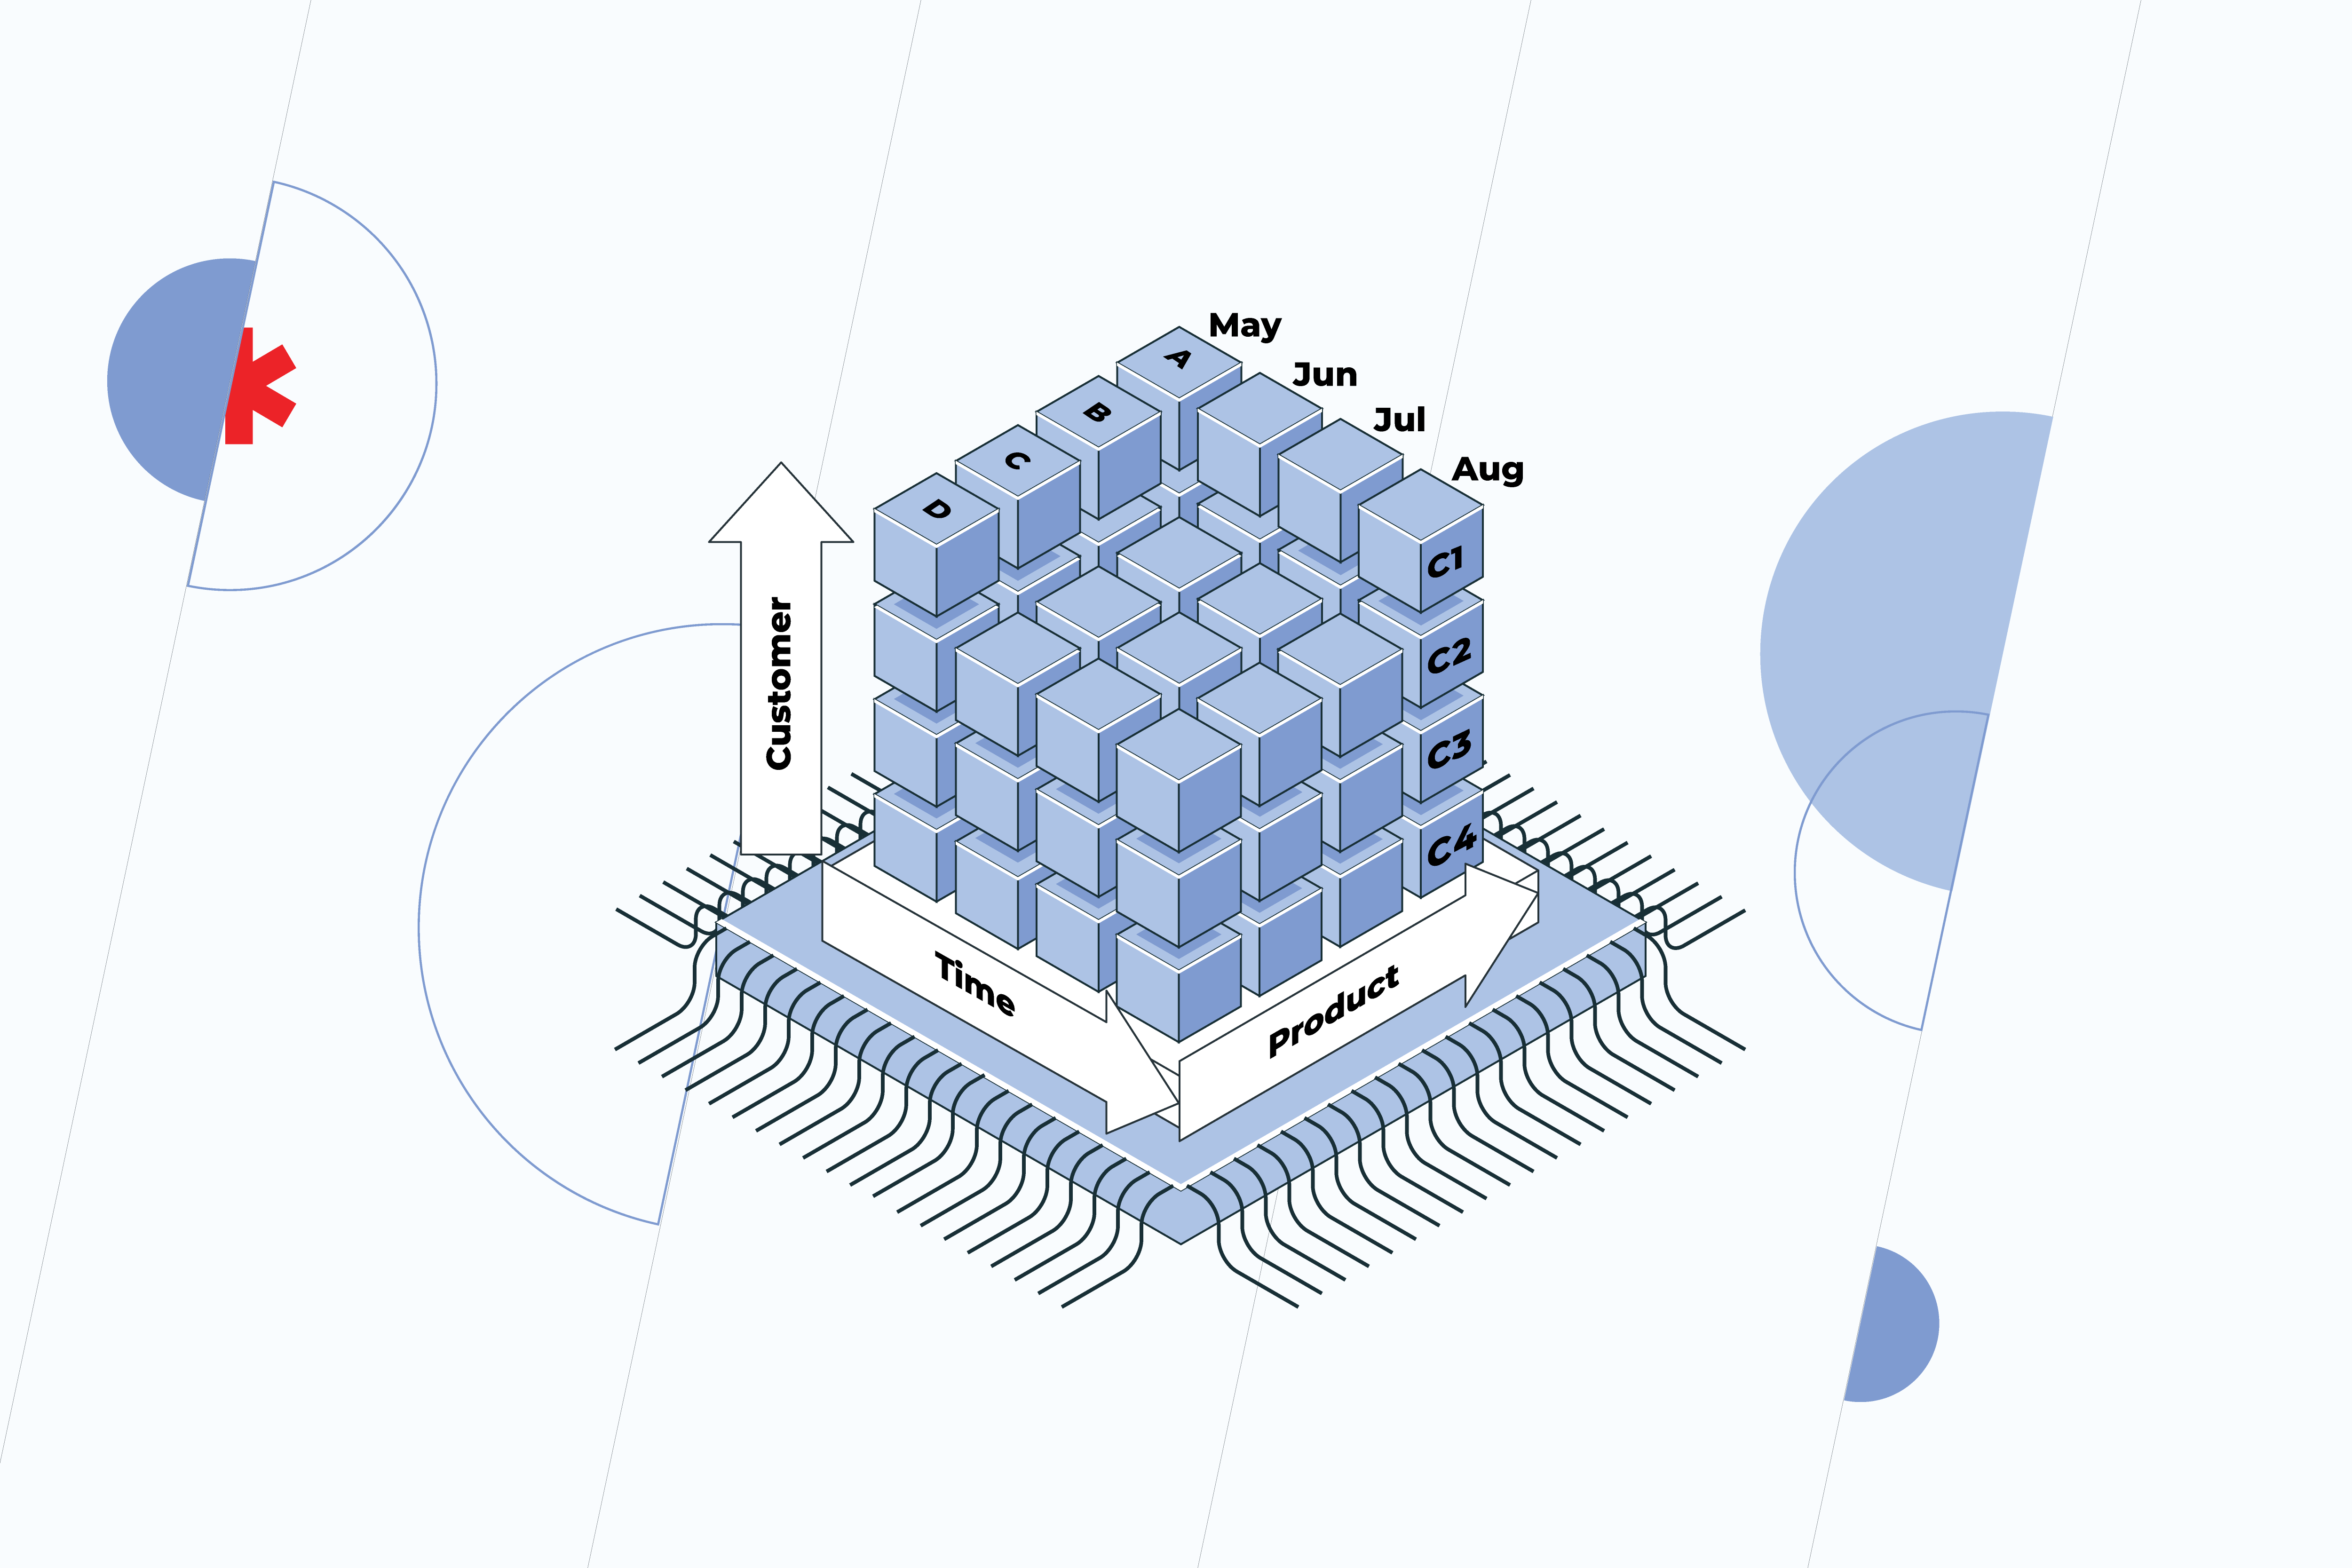
In a data-driven world, the more data is generated, the more important it becomes for organizations to be able to collect and analyze it. However, the question is how to get all the data together, translate it into a readable and clear format, and perform a holistic analysis without wasting tons of time? Querying data out of conventional relational database systems is quite difficult. Not only are queries slow, but they simply aren’t flexible enough to navigate the data. Thus, data analysis is a weak spot for many organizations. In contrast, analytic databases are specifically designed for users to easily find and extract the information they need. That’s why more and more companies are implementing Online Analytical Processing (OLAP) – software that allows users to examine data from multiple databases simultaneously. Its major value lies in a multidimensional approach to data organization and analysis. The OLAP system is represented by cubes – special data structures optimized for very fast data analysis. The cube is categorized by dimensions, such as location, time, customers, etc. Each dimension contains different levels that are organized hierarchically. For the location, these are countries and cities, for time – years, months, and days. Such an approach enables users to see information from different perspectives and quickly create adhoc reports. OLAP cubes are often pre-calculated and pre-aggregated across dimensions to drastically improve query time compared to relational databases. The data within the cube can be:

  • rolled up (summarized along the dimension, e.g. moving up from a city to a country)
  • drilled down (fragmented into smaller parts, e.g. moving down from a country to a city)
  • sliced (by selecting a single dimension, e.g. a “slice” for time)
  • diced (by selecting several dimensions, e.g. a “slice” for time and location)
  • pivoted (by rotating data axes to gain a new view of data) 

All in all, instead of collecting and validating the data using endless Excel sheets, OLAP technology allows users to enter the data directly into the multidimensional database, which significantly simplifies the analytical and reporting processes.

integration issues

Addressing the challenges of integration is the first but crucial step toward transforming your data from some random figures into information that actually works for you. Ready to take a step forward? Find out more about how we can help.

5 Major Benefits of Self-Service BI

IT departments crave freedom from the monotonous work of non-stop report generation. Not to mention that many employees appreciate the idea of self-sufficiency when addressing their information needs. Besides, data continues to grow dramatically and businesses have to make important decisions in an instant. Decision-makers can no longer wait around the IT department to get the latest reports. That’s when the time comes for Self-Service BI (SSBI). It requires no coding expertise, which makes it simple to run queries and create reports, enabling everyone to benefit.

Traditional BI VS Self-Service BI

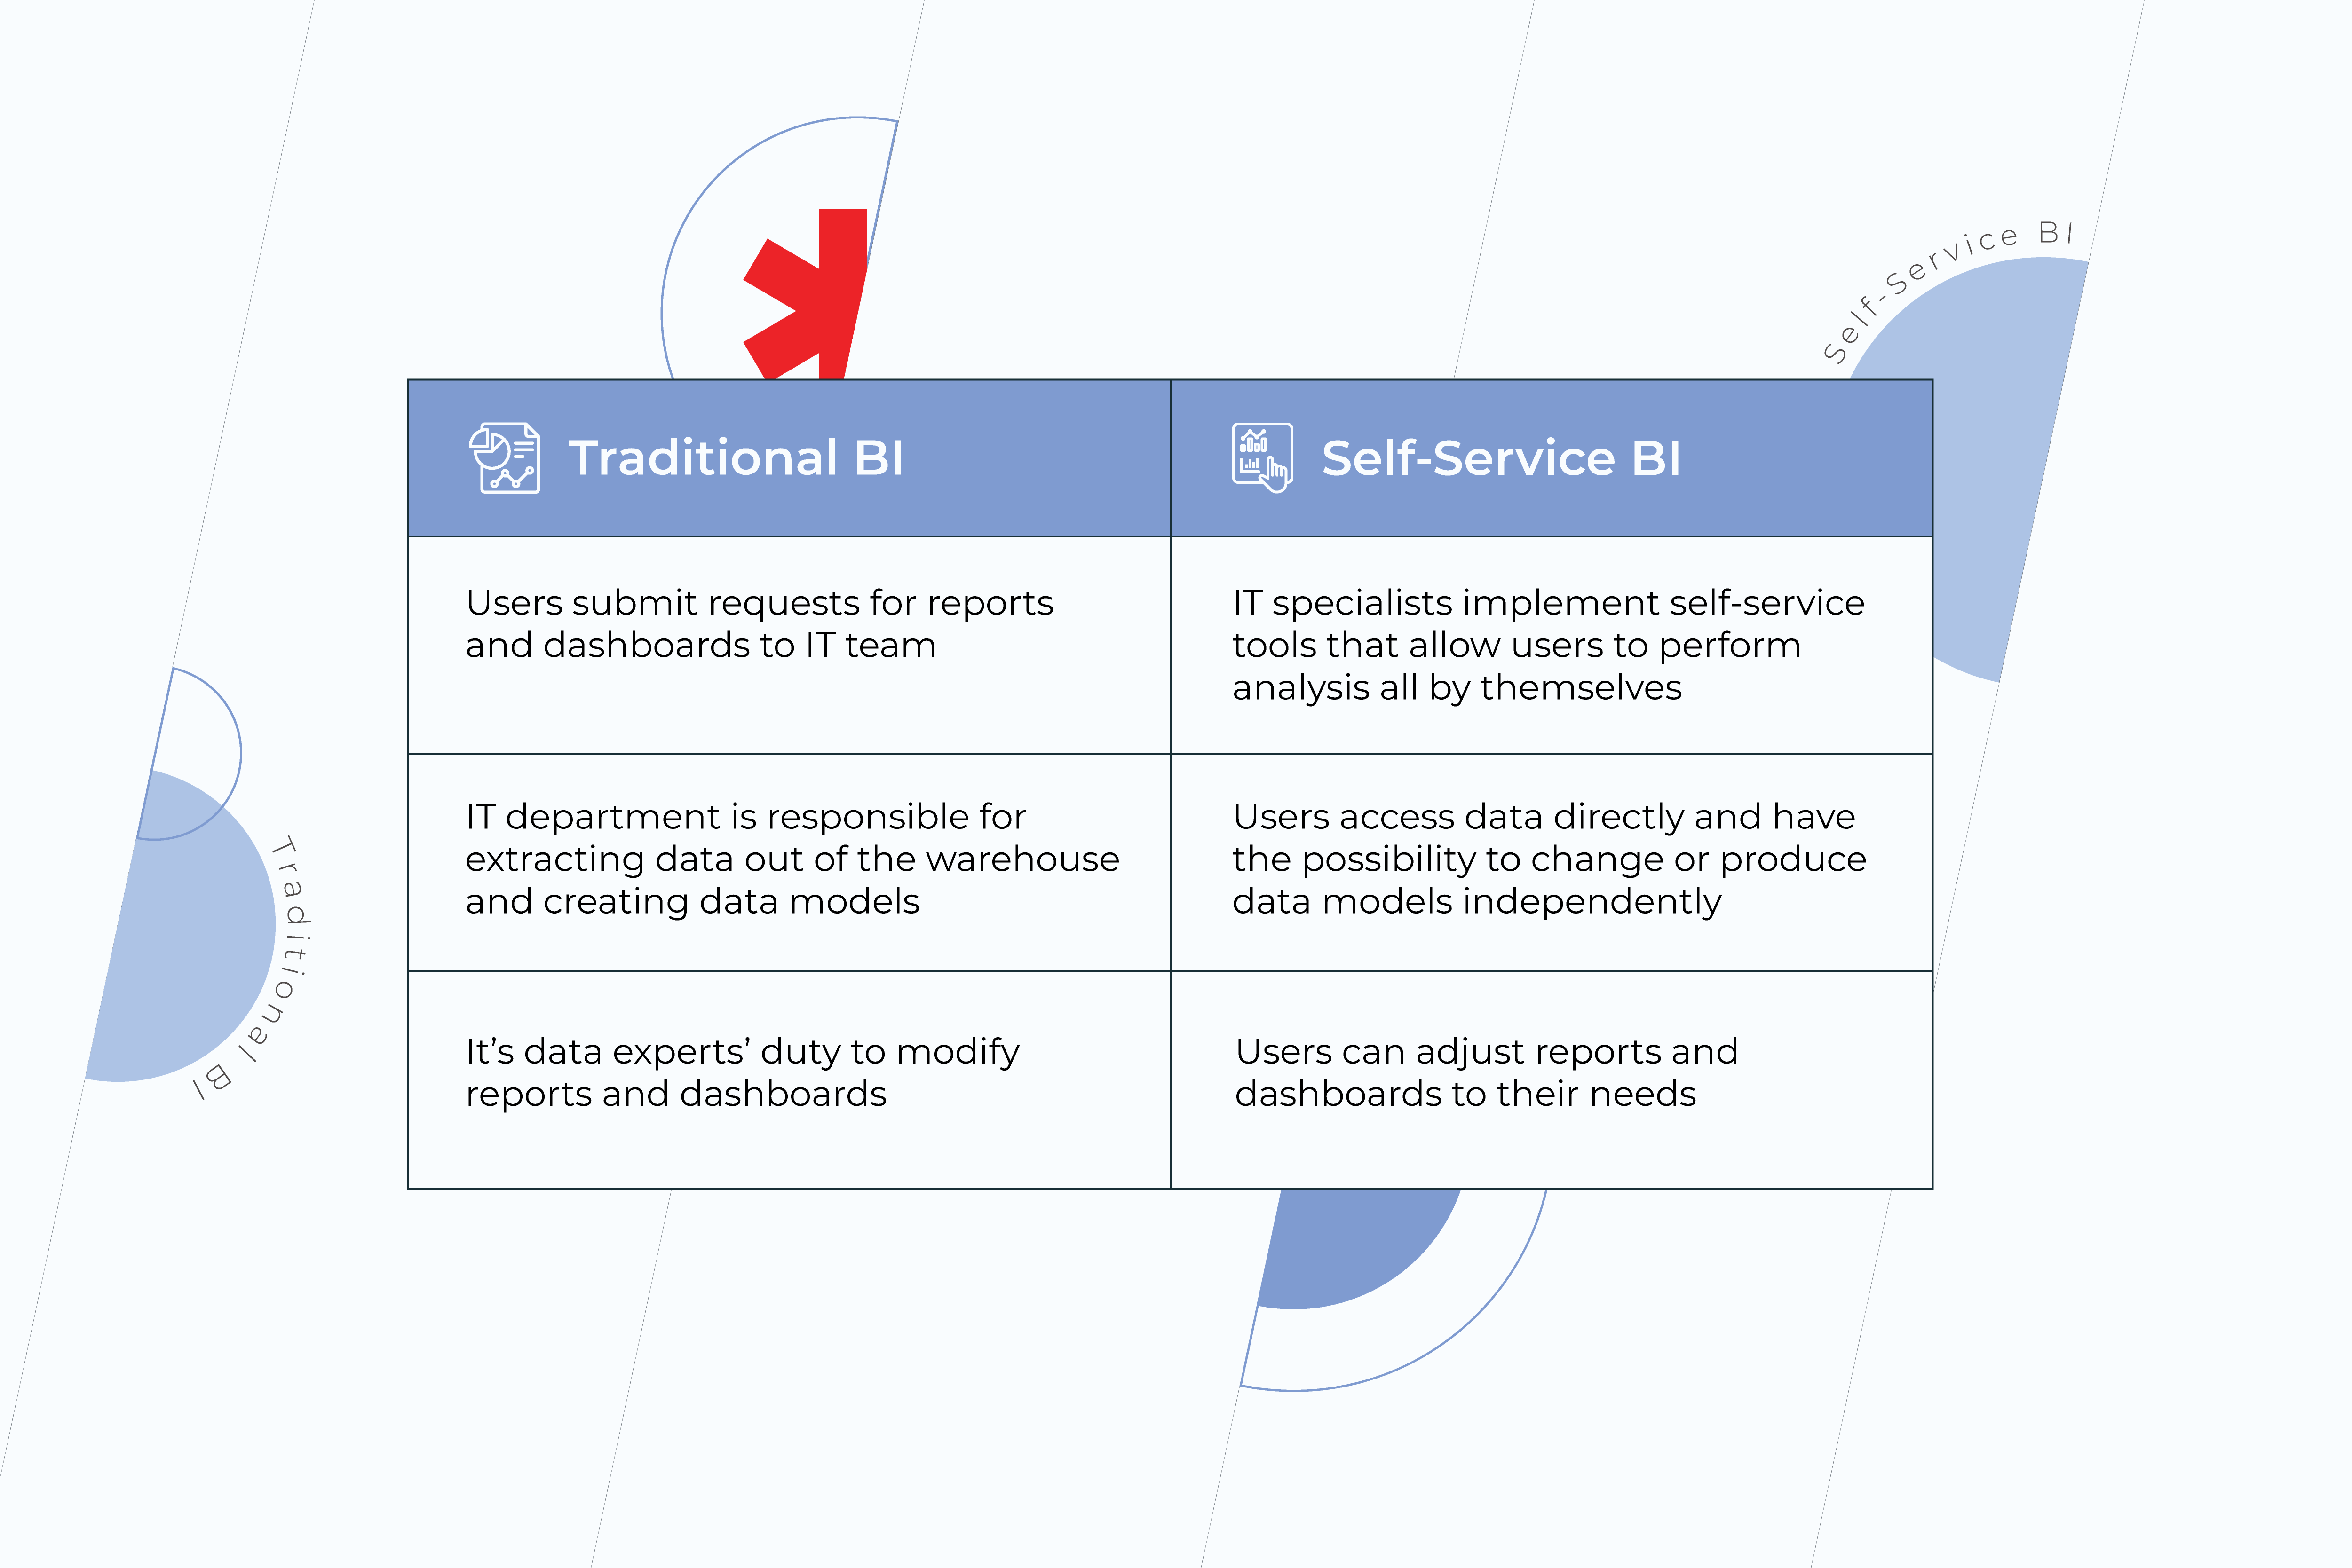
Traditional Business Intelligence services count on IT teams to reveal insights from data. For a person who doesn’t know SQL and has no experience in data engineering, it becomes impossible to benefit from business analytics and business intelligence solutions to the full extent. Since there are only a few people in a company who have control over data, business users often have to wait for ages for their reports to be done or settle for less with spreadsheets and static presentations. In contrast, self-service BI tools make the process of running queries and creating reports much easier. These are platforms that let people with no-matter-what technical background explore and make use of data on their own. Here are the major differences between traditional and self-service approaches:

traditional bi

Benefits of Self-Service BI

1. Independence from IT departments 

The main advantage of self-service BI is freedom from the problems of traditional IT reporting. From the moment SSBI is implemented in a company, users can create their own reports without involving IT staff in the process. However, the notion of independence may seem pretty generic and overly abstract. Let’s take a look at what it entails:

  • increased agility and flexibility 

When it comes to self-service, business users gain the level of agility they’ve never had before. With self-service BI intuitive tools, predefined templates, and dashboard objects, ordinary users get the possibility – unprecedented until recently – to create ad-hoc reports by themselves and share them among other employees. Yet, SSBI functionality is not limited to the creation of reports only. Users can also adapt the reports to their own needs, changing the information and visualizing key indicators in the most relevant way. Besides, self-service functions help users with data integration. When data from external sources, such as Excel spreadsheets, flat files, etc., needs to be integrated into reports, it can be done easily and swiftly.

  • improved and faster decision-making 

Efficient decision-making is impossible without understanding the story behind the numbers. Dashboards full of analytics that is hardly relevant to your question can’t be of much help. Meanwhile, SSBI software encourages end-users to better understand the underlying data and interact with it more effectively.

Your business can only benefit from timely decisions, whereas problems that aren’t handled in time can cost notably for the company. Unfortunately, a good number of employees get the required reports from IT departments behind schedule. With self-service BI, users no longer have to wait for data teams to deal with their requests. Instead, they can get all the necessary information whenever they need it and make accurate decisions, based on that information.

  • reduction of IT workload 

Data experts’ special skills and experience shouldn’t be spent on routine tasks over important projects. Thanks to SSBI, things like ad-hoc reports can be easily generated by business users themselves, while an IT team can finally allocate time for company’s pivotal issues. To sustain steady development, it’s necessary to not only answer immediate questions but be able to find the answers to big-picture questions. Thus, improve the company’s overall strategy because that’s what moves business forward. 

2. Expanded access to data

traditional bi

With the emergence of self-service BI, data stopped being the exceptional prerogative of technical elites. Providing non-technical users with an opportunity to analyze data and make decisions based on it is a huge step in the direction of a data-driven culture. It’s natural that the more employees have access to accurate and precise information – often referred to as a single source of truth – the lower are the odds of making bad decisions on all the company’s levels. And bad decisions can cost you the game.

3. Ease of use

As long as the aim of self-service BI is meeting business users’ requirements – and technical skills, let’s be honest, are not their strong suit – the solution must be truly intuitive and feasible. A good solution empowers your employees to easily query data relevant to their job role and navigate its features without extensive business intelligence and analytics training.  

4. Collaboration 

Having a single source of truth and easy access to data for all the employees inspires collaboration, which results in a powerful synergy. It happens because when representatives of different units come together they see the big picture and address the issues holistically. Indeed, context brings more accuracy to problem-solving and allows teams to make decisions faster than they used to when staying focused solely on their individual segments. In addition, efficient collaboration strengthens your teams. People become more invested as they see the impact of their individual contributions to a common success.

5. Lower costs 

As long as the cost of BI software licenses and related hardware is easy to count, it tends to be the primary focus for business people who are thinking about its implementation. At the same time, the expenditure on IT staff to maintain traditional business intelligence systems might be overlooked. Organizations that use a self-service approach in delivering analytics spend way less on IT support per BI user than those who do without self-service. Such cost reduction is possible thanks to the balance of duties. Shifting the responsibilities for simple analytics tasks from technical specialists to business users is beneficial for both. It allows the IT team to concentrate on more important areas and improve the overall efficiency by doing the things they’ve always been meant to. Whereas business users feel more committed to the projects they work on.

Moreover, self-service BI platforms can be easily scaled without major IT help, which contributes to cost savings as well.

Strengthen Your Company’s Data Culture

Self-service tools alone meet only half of the analytics challenge. At the end of the day, it’s about the people who use them. However, smart business intelligence and data analytics practices encourage people within the organization to better utilize their skills and experience, align their decisions with the company’s goals, and prevent them from making bad choices.

Don’t delay your journey towards a data driven culture! Reach out to our BI experts.

How to cut project costs: Business Intelligence VS cost overruns in construction

Cost overruns have always been one of the major issues for the construction industry. The main reasons are weak management, inaccurate estimates, design flaws, and changing orders. Ignoring these problems is definitely a dead end while addressing them is your chance to take the lead in a highly competitive market. 

Plainly put, going over budget is a direct cause of ineffective processes. Less reworking means savings, more productivity means savings, truly efficient decision making means… guess what? Right. Savings as well. Technological advancements make it possible to have real-time data that accelerate the decision-making pace, lowers the likelihood of redoing a design, and boost the productivity of a team.

So, if the first thing that crosses your mind when you think about your project budget is an “OMG” abbreviation, it’s time to use another one – BI. Business Intelligence is changing the construction industry helping companies to effectively handle managing equipment and manpower, which are pivotal for profit margins increase.

Let’s take a closer look at how it works.

Meticulous design 

Predictability becomes a critical notion when it comes to construction. It’s far easier for the team and less painful for the budget to deal with the changes at the pre-construction phase. BI dashboards provide users with the capacity to quickly evaluate the metrics of design development. If you can better track the design progress, then there will be little-to-no surprises in design deliverables.

The pre-construction teams can leverage real-time design data, tracking design progression in real-time. It empowers all parties to have the most current design information, allowing everyone to do their best work.

Moreover, with dashboard data readily available, the pre-construction team can suggest alternative solutions reducing material costs during the construction phase.

Besides, complete and detailed designs will also prevent you from major change orders, which entail substantial spendings as well.

Keeping an eye on KPIs

Key performance indicators (KPIs) help to measure the current state of the project and what your team needs to meet the goals. Does your project run on time? What’s your actual project cost to date? Are you keeping to your budget? What’s your current reworking cost? Are your labor costs steady? You can find answers to these and many other questions on BI dashboards. They are proved to be indispensable to control completion time, costs, and support executives in their decisions.

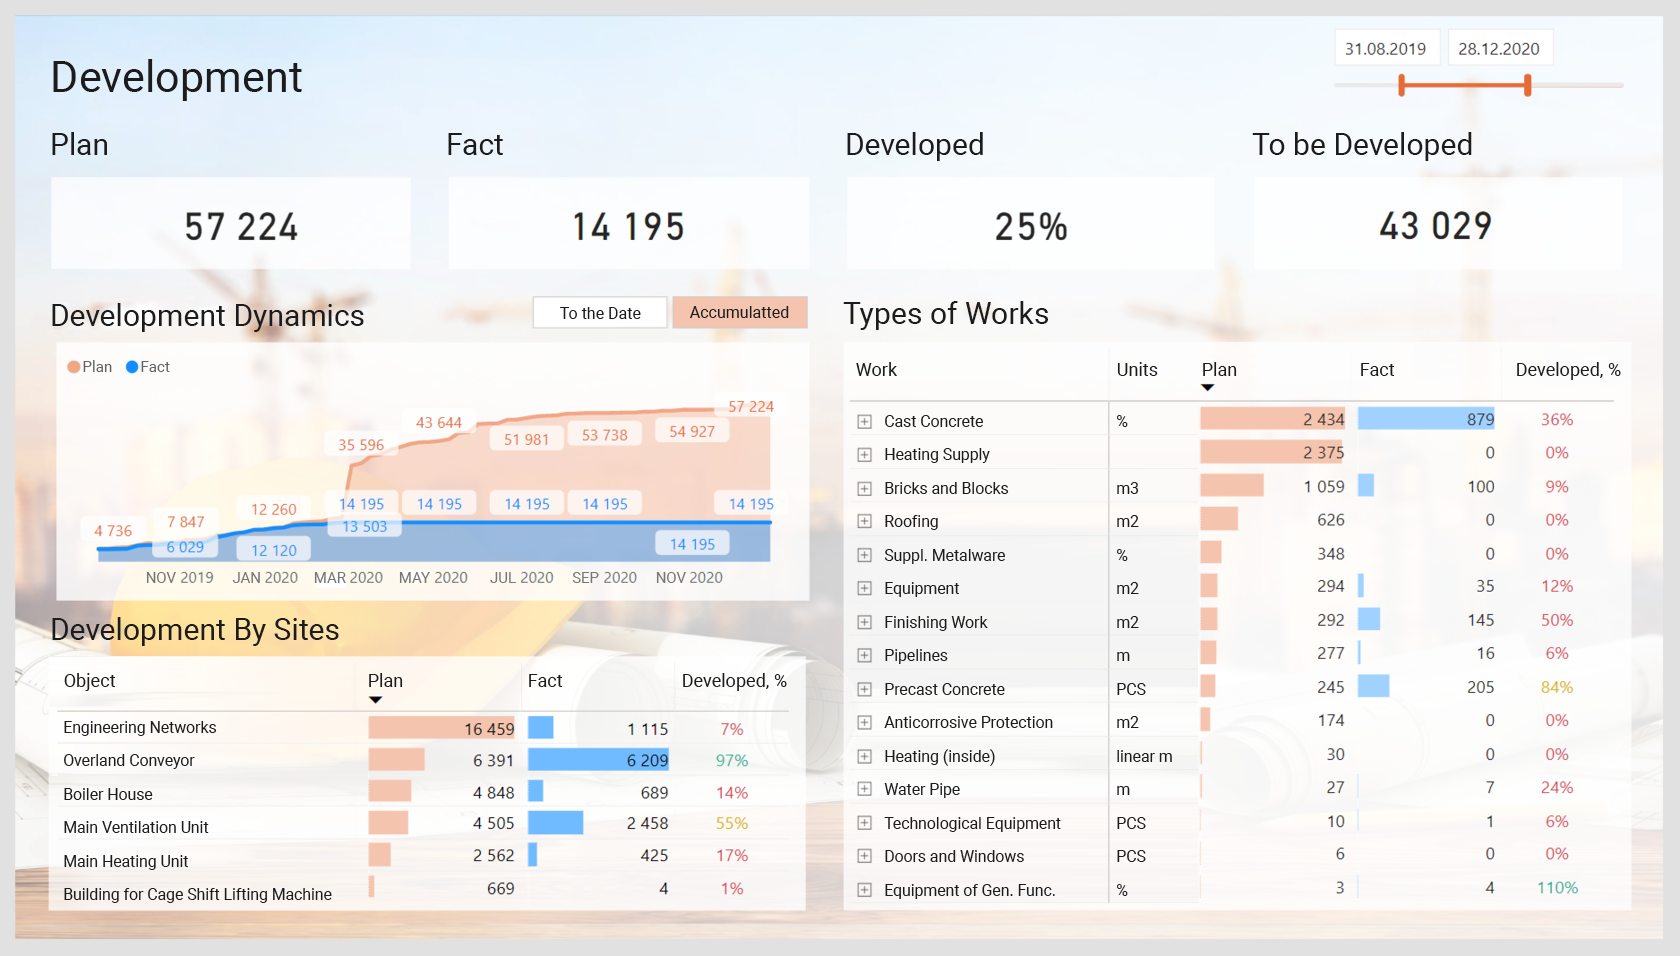
Development report on a Business intelligence dashboard
Development report on business intelligence dashboard.

Automation of some aspects of the job and interconnection of the office, trailer, and the field

BI software can reduce time spent on the most tedious tasks, like daily reporting, unleashing human resources for actual work. Moreover, when all your data is in a single place and is available for all your team members – no matter where they are, it becomes easier to keep up with the immediate changes and turn lagging indicators into leading ones. As a result, teams will complete projects faster – reducing your labor costs not to mention the need for rework.

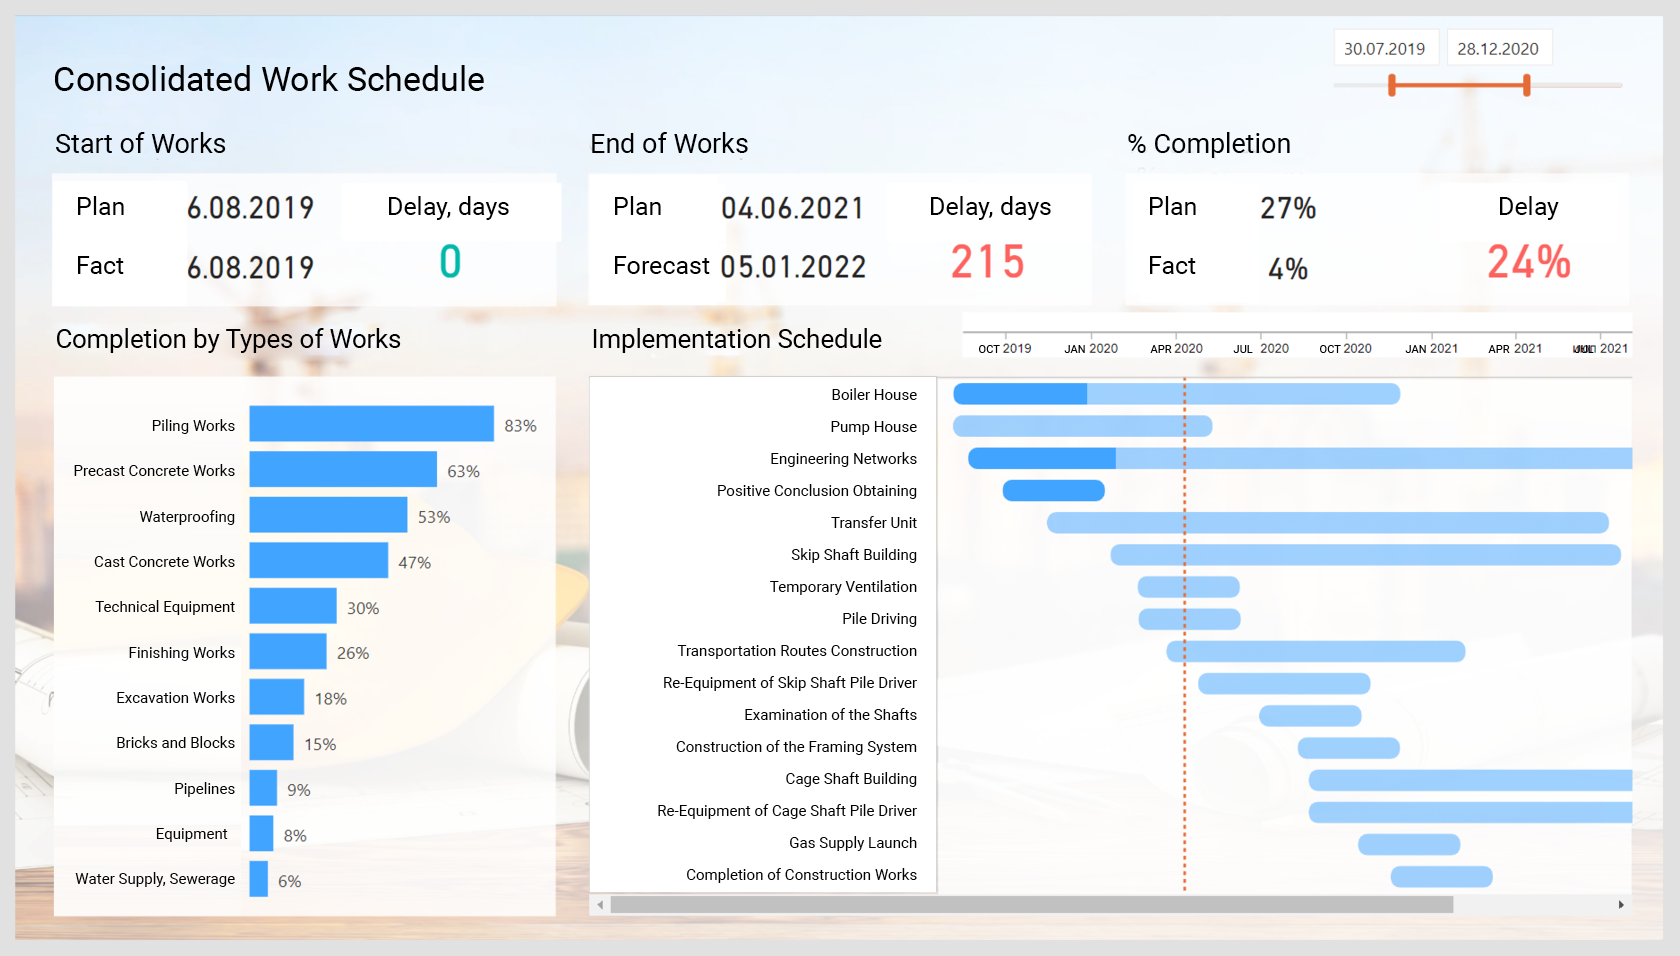
Work Schedule report on business intelligence dashboard
Work Schedule report on business intelligence dashboard.

Reducing downtime

Relying on manual monitoring methods of the machines increases the probability of downtime occurring. As a consequence, your project activities cease owing to the backlog in tasks that can’t be executed until the machines are back in working order. Meanwhile, monitoring heavy-duty construction equipment digitally prepares you to schedule repair in real-time. Besides, detecting faults in the line, BI tools can predict and diagnose issues early on and optimize the performance of equipment.

Site Safety

Although the connection between site safety and BI might seem less than obvious, it still exists. Real-time updates on the state of the equipment can prevent your project from damage and, more importantly, protect your staff from injures. Needless to say, timely security measures will keep your project assets where they belong.

Tracking materials

Failing to have proper insight and control on how you’re using materials could create a huge waste of resources. Up-to-date technologies help to track, manage, and control your inventories in real-time, keeping material waste to a minimum and reducing costs.

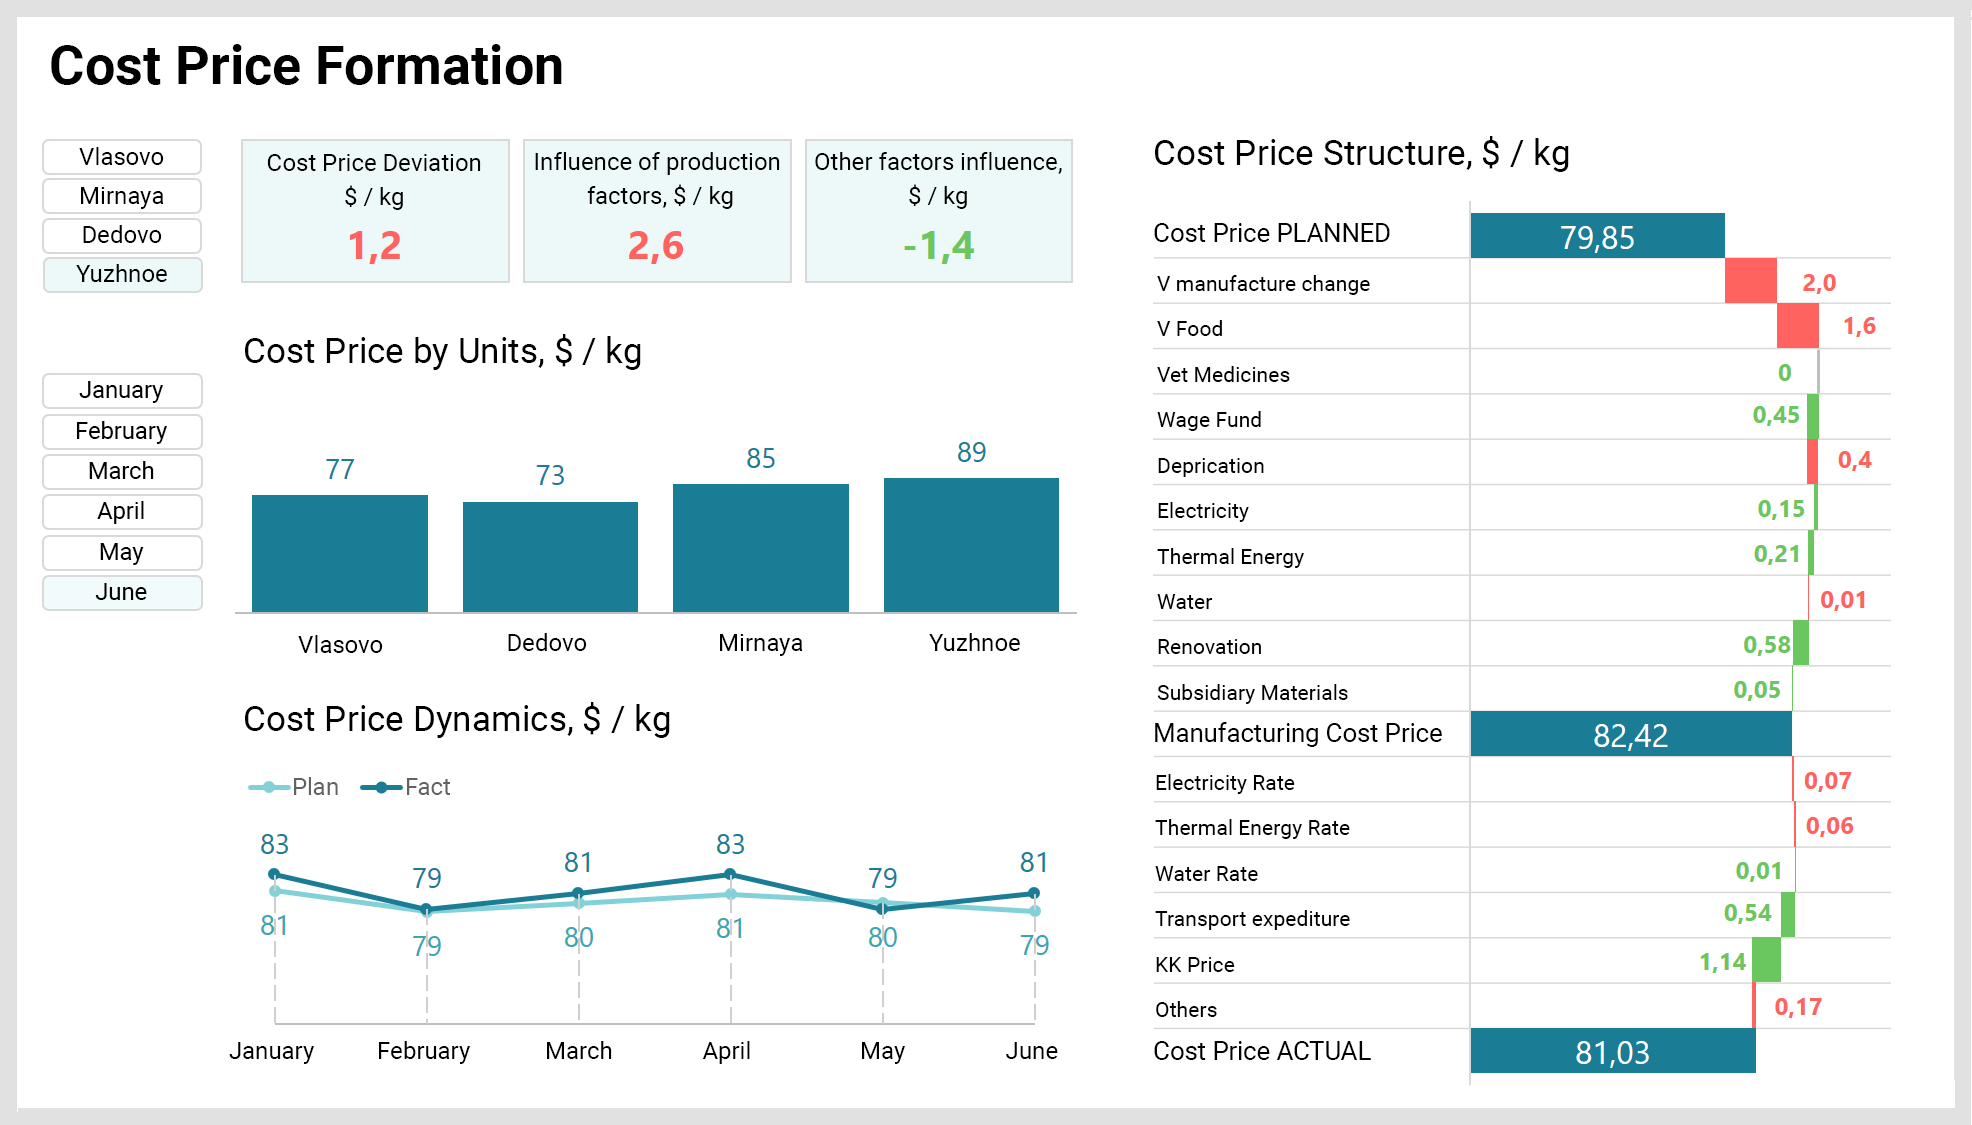
Cost price formation on business intelligence dashboard
Cost price formation on business intelligence dashboard.

Risk estimation

Retaining a risk management strategy through all construction project phases is crucial if you want to avoid serious cost overruns and stay ahead of potential problems and change orders. Having the data at hand, you can manage risk effectively and experience financial savings from all the improved productivity and enhanced decision making. 

To be continued… by you

Although there are plenty of ideas for cost-cutting in construction, that’s not all. Having deep insight into your data, you’ll definitely come up with so many more. Also, historical data from other projects will help you identify and gain efficiencies in current work and displace over-the-top spendings by increased productivity step-by-step, project-by-project.

A total makeover: how business intelligence changes the construction industry

Have you ever had a problem you couldn’t handle until after endless hours of work? The equation you’d been banging your head against the wall trying to solve and then finally realized that one of the variables was missing… So here’s the big reveal. BI is that variable for the construction industry. It glues all the data together and turns it into a seamless plan for achieving business goals, steadily paving the way from flaws to strengths.

From putting a lot at stake to minimizing risks

Construction projects go hand in hand with a high level of uncertainty both on the client’s and the contractor’s sides. And this has been typical for the industry for a long time. This uncertainty comes from clients’ unrealistic expectations and contractors’ inability to quantify the risks before trying to meet them. Contractors frequently bid on work they can’t deliver. These bids have a low likelihood of winning. Meanwhile, the effort spent on winning the bid can cost a fortune. In this case, even if the contractor is lucky enough to seal the deal, there’s little chance to meet the client’s expectations. This will eventually result in a lack of trust in the contractor.

However, the BI implementation in construction business can change it for the better. Contractors get an opportunity to make a precise and error-free scope of work assessment, balancing engineering effort with the odds of not winning the bid. They have a chance to determine the risks and apportion them fairly, involving early-stage financiers and insurers.

At the same time, clients get the amount of certainty they need and can make smarter and more informed decisions. At the end of the day, it ensures the validity of the project’s business case. Knowing the risks and being able to quantify them, clients also feel more confident about their further investments.

From delays and over-the-top spendings to delivering on time & budget

Breaking up a project into smaller, workable plans can lower the odds of missed deadlines and overspendings. BI helps construction businesses to track the pipelines of the projects and their associated budget to plan and allocate resources effectively and identify focus areas for future growth and revenue.

Besides, seeing a project in various stages of completion allows to nip problems in the bud. 

Software remains impartial and humble about the known and unknown. It means that data analysis within a BI system estimates the costs, time, and resources way more accurately than a person will ever be able to.

From backbreaking tasks to challenging ones

Vast amounts of data used to be kept in autonomous systems and not formatted for integrated use. BI makes it possible to integrate and analyze all data together. You no longer need to waste time and effort on pulling the data from multiple sources and drawing it together. If to take away this huge amount of workload from your employees they can focus on more challenging tasks.

Moreover, centralized data can be, simultaneously, sliced and diced in the most coherent manner and distributed to the relevant decision-makers. This will allow them to react in no time to the information provided. All this information can now be accessible to the team at a click both on construction sites and in meetings.

From fragmented variety to a single truth

A centralized source of data helps to avoid differences in the core information and sync the team on the business processes. It eliminates finger-pointing by making the work of the company’s units and the dataflow more transparent and clearly visible. BI custom dashboards for construction company demonstrate the impact of each party involved in the process. Architects, site managers, craftsmen, etc. get an opportunity to easily document their services in the system.  

Any combined items of information, from vendor agreements to architectural wishes, can build a single version of the truth. 

From losses of profit to staying within profitable margins

The ability to identify strengths and weaknesses allows businesses to readily define where to reproduce successful aspects or employ corrective actions before it’s too late. This is crucial to those companies that have projects with mostly small profit margins. There are many aspects where intelligent software can make a difference with better data and budget tracking, analysis of materials, inventories and equipment, collaborative working environments, and cost management.

From past data to future success

Another advantage of BI is that it allows construction companies to analyze their past projects, and make a decision about whether a new project is suitable and potentially profitable. You can track the types of contracts, employees’ performance, and see trends by area, timeframe, and job type.

Contractors can leverage the insights derived from past data to negotiate with clients and provide them with a highly probable outcome for the project. At this point, it’s much easier for both contractors and clients to come to an agreement of the most realistic deliverables of the project. So if you’re looking for a win-win situation, that’s exactly what it looks like.

Skepticism aside, Business Intelligence creates a new face of the industry, based on trust rather than subjective opinions of a few. And all the aforementioned transformations are nothing less, but components of a gigantic breakthrough the construction industry is about to make: from breaking promises to keeping them.

∞ Virtues of business intelligence that make your business smarter

Today’s business world is increasingly (and dizzyingly) complex. Traditional methods of navigation through this complexity are obsolete. C-suites admit that they don’t have enough of the right information at the right time, because their inner reports are no longer reliable.

Indeed, having data is key. But a blessing turns into a curse, if this data is not accurate or timely. Business Intelligence (BI) makes all the difference. And here is how.

1. HELPING TO MAKE DATA-DRIVEN AND FORWARD-LOOKING DECISIONS

Smart appliances and devices tell us more about consumer behavior than we could have ever imagined. The Internet of Things (IoT) has conditioned the rise and the availability of global data, which not just can, but must, be used for business purposes. Due to the power and scalability of cloud computing, we can harness and process millions of signals and clues in minutes to state what really matters. The thing is, to not only have this information, but to be able to convert it into structured and analyzable insights.
Using the data, based on customers’ own experience rather than on abstractions or mere assumptions, leads to smarter business decisions. This can’t but contribute to better financial performance. CRM (Customer Relationship Management) solutions play a crucial part in intelligent decision-making. By delivering a wide variety of business metrics they make it possible to highlight hotspots, detect processes that can be reproduced in other parts of the business and identify where there’s a need for adjustments.

2. BOOSTING SALES

It’s a fact: who owns the information… earns more. When it comes to sales, the tools that measure customers’ activity and reveal behavioral trends are priceless. They provide information that helps to make perfectly calibrated, strategically correct business decisions. BI solutions shed light on the sales process, analysis and forecasting.

3. GETTING TO KNOW YOUR CUSTOMER. FOR REAL

It’s difficult, not to say impossible, to reach customers without understanding how they interact with you. Failing to understand it means you lose a competitive advantage to your rivals. Customers don’t want to be sold to, they want their needs to be met. Constantly updating info, which is available thanks to BI technologies, helps to achieve this.

4. DELIVERING CUSTOMER-TAILORED EXPERIENCE

All the information about your customers is gathered not just to ‘be there,’ but to raise your customers’ satisfaction and improve their experience. Customer Experience is nowadays considered to be a new marketing battlefront since a lot of companies compete primarily on this basis. Being unable to give the consumer a unique product is not the end of the world, as long as you can provide them with a unique experience.
Having instant access to the information within the sales cycle encourages more advanced service responses and allows it to handle those situations where customer experience can be put at risk. Also, you can pinpoint the typical profile of your most profitable customers and see whether the resources you spend contribute to your business growth.

5. SPEEDING UP THE PROCESS OF ANALYSIS AND SKYROCKETING PRODUCTIVITY

With the help of BI technologies, real-time reports and dashboards are at hand, making the process of analysis much faster than it used to be. Routine tasks become automated, customer service is more responsive, salespeople use their time better. All of this directly leads to increased productivity.

6. RAISING RETURN-ON-INVESTMENT

As soon as you incorporate BI tools in your company, the maximization of your ROI will not be long in coming. Deepening the actual knowledge about your customers (not just making unfounded predictions or hypotheses), improving and accelerating the process of marketing analysis, increasing the efficiency of the employees contribute not only to revenue growth but also to investment optimization. Take marketing. Each campaign is tracked and measured thoroughly, which makes future marketing initiatives more effective and profitable. In other words, due to careful analysis of the information and the visibility of it, marketers will know for sure how to allocate the budget.

7. CUTTING DOWN ON EXCESS INVENTORY

Usually, companies carry a lot of excess inventory, which is costly. They carry more than needed, being afraid to lose their customers’ loyalty in case they’re out of stock. But with the help of BI solutions, you can get more accurate on demand for inventory and, thus, erase millions of bottom-line costs to help the profitability.

8. PREVENTING TEAM BURNOUT

Trying to squeeze your employees like lemons to gain more is a dead end. Nobody is really productive under constant stress. Luckily, today you can decrease the stress level of your employees by bringing intelligence to your business. They will no longer waste time on tasks that can be automated and will be able to remain focused on impactful things that require their skills, knowledge, and experience. The first step in this direction can be a set-up of a collaborative work management (CWM) platform. It brings your teams together to optimize the work processes. It’s possible to connect the data collected within the CWM to a BI solution where it can be transformed into applicable insights on project efficiency and ROI.

Business Intelligence technology does what people don’t have the capacity to do – it brings a lot of data together to deliver a personalized message to your customer. In the age of convenience when everything is available in a click, if you can’t forecast your customers’ desires, they’ll go with someone who can. In letting BI contribute to your business, you’re making the right decision. All it takes is just one. And then it opens up doors for so many.

The impact of IoT & Big Data on the Healthcare Industry

The healthcare industry has been very welcoming to the increasing popularity and availability of technological innovations. That is why innovations in healthcare have been taking giant steps forward over recent years. Today, with a smartphone in your pocket, you can control your health and well-being online.

Nowadays there are mobile apps that can remind us to take our medications on time, some apps can measure our cardiac activity or recommend diet and workout plans. There are apps out there that can even bring the world’s best doctors to us through video consultations – within minutes instead of weeks or even more.

Let’s take a look on how Big Data and IoT have been driving the healthcare industry.

Big Data

We often hear about Big Data when talking about enormous volumes of information. The healthcare industry generates a huge amount of data that is generally stored in physical media. However, with advances in technology, there is need to keep this data digital. That is where Big Data comes in.

Along with traditional medical records which are in the form of text, Doppler and MRI scans contain X-ray images and ultrasound records. Also some medical practitioners prefer to keep a record of their conversations with patients.

All this information is mostly unstructured and not set up in in the form of neat graphs and tables of the relevant database. And this is exactly where databases are most needed. However, it is one thing to store Big Data and quite another to retrieve it effectively.

Big Data solves any information storage issue. It helps to keep data systematic and always ensure quick and convenient access to data. It makes the work of a hospital more efficient.

An electronic health record (EHR) is quite a new but already very popular phenomenon today. It is also supported by Big Data. EHRs systematically gather the clinical info of every particular person and provide easy and rapid access to the medical data.

Big Data also accumulates data on the latest treatment methods and best cure practices. It becomes easier for healthcare practitioners to make objective decisions on treatment in every particular case. So, when it comes to the process of collecting huge volume of information, Big Data will easily cope with any task.

If healthcare providers store information in a properly manner,  the patient’s health can be holistically reviewed. Consequently, diagnosis is made easier for the medical practitioner and the patient’s life is simplified.

Internet of Things

IoT cannot but be mentioned when talking about data analysis. This technology is a network of Internet-connected objects that collect and exchange data coming from embedded services.

IoT is a rather new paradigm, which has already been extensively applied in the healthcare industry and in a number of other industries. With IoT, medical centers are able to function more efficiently, thereby ensuring better treatment for patients.

IoT makes simultaneous monitoring and reporting applicable: devices collect and transmit health data, such as blood pressure level, oxygen and blood sugar level, pulse, etc. All this data is stored in the cloud and can be used by a doctor or any other healthcare practitioner.

24/7 availability of data enables the medical expert to react quickly to any changes in patients’ situation. Alert feature provides an on-time warning signalling that treatment measures need to be taken.

Moreover, IoT devices can easily report and analyze collected data in real-time. This allows to minimize the time spent on data processing, evaluation and analysis.

All this can easily guarantee remote medical assistance. A simple example: during an emergency, a patient can contact his doctor via a mobile app. With smart app solutions, healthcare practitioners can instantly check a patient’s physical condition and identify the first symptoms of illness on-the-go.

Summary

Both Big Data and IoT deal with information but process it in different ways. Combining this with mobile devices, especially smartphones and tablets, our health may now be easily monitored on a continuous and proactive basis. Once a problem is detected, a healthcare professional is alerted to take appropriate action. Besides, there appears a huge potential to deliver simple, effective, inexpensive solutions to improve healthcare professionals’ working methods and the general health level of the population.

Automated downfall check for the code. Quick SQL-injections search

SQL-injections (http://en.wikipedia.org/wiki/SQL_injection) represent a wonderful way to get external access to your database. This kind of injections can be left in the code by developers both because of lack of experience and on purpose. Is it possible to find them quickly and be sure your product is safe? Our developer Alexander shares his experience of automated search for such injections.

Once I had a task to develop a plugin prototype for IntelliJ IDEA within a short time. The plugin purpose was to analyze the code to search for SQL-injections according to a certain rule described in the given XML file.

To start plugin development for IDEA you just need to download the community version and create there a project for plugin development.

As a next step I had to realize the object representation of the rule described in XML. The main point of the rule is a listing of classes and their methods, their calling is SQL-injection. Nothing to explain here, everything is simple and has nothing to deal with specifics of plugin development.

After I had realized the object representation of the rule, I started exploring OpenAPI IDEA SDK with a view to code analysis possibilities. First of all I visited their documentation site: https://confluence.jetbrains.com/display/IDEADEV/PluginDevelopment. If I tell you the given information there was enough, I’ll probably tell you a lie…

It was clear that for code analysis I have to work with psi-elements and I made some investigations in this direction. I reviewed the interface of psi-element and its other descendants and it showed that for faster orientation it’s better to output all the structure from a Java file into the console and see what happens next. I call it exploratory attack. We need a UI action that can be called in the chosen project file in IDE. While activating the action we get AnActionEvent and then we take the element following way:

PsiElement element = event.getData(LangDataKeys.PSI_ELEMENT);

in case we called the action on the chosen element in the project tree, or:

PsiElement element = event.getData(LangDataKeys.PSI_FILE);

in case we called the action from the editor of the open file.

Back to psi-elements. Psi-element has a parent psi-element and subsidiary psi-elements.  So we can get deeper recursively and output all the elements with indentations into the console. In this way I found an important.

PsiMethodCallExpression element that includes necessary information, meaning which exactly method and where do we call it from. A bit more patience and I found a way to extract this information:

PsiReferenceExpression methodExpression = expression.getMethodExpression();
PsiReference reference = methodExpression.getReference();
PsiElement result = reference.resolve();
PsiClass methodClass = (PsiClass) result.getContext();
String methodClassName = methodClass.getQualifiedName();
PsiIdentifier methodIndentifier = methodExpression.getLastChild();
String methodName = methodIndentifier.getText();

In this way we get the whole class name this method belongs to and the name of called method. That’s enough to identify whether it is a potential SQL-injection. Besides we have the psi-element of method calling, so we know what place in the code it is.

The next task – marker saving.

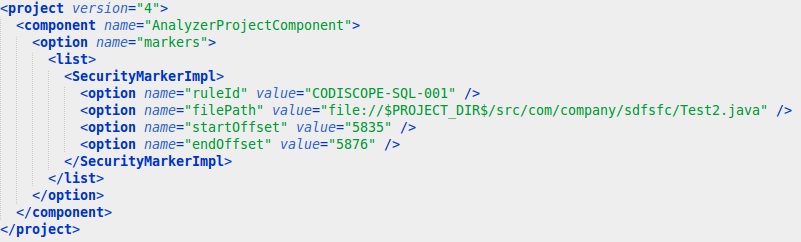
I created a project level component and put the marker container in it to save markers. To make the component container persistable, the component has to realize the interface ProjectComponentState<Container type>

And the fields in the container have to be marked with relevant annotations, e.g.

@com.intellij.util.xmlb.annotations.AbstractCollection
code

Displaying of markers and annotations was a sweaty piece of work. Everything was great, the way for realization of markers and annotations is easy, because you only have to realize your relevant providers and register them in the plugin. Some difficulties appeared, when I had to refresh them in the open editor. I couldn’t find the information about that on open access so quickly, so I had to use exploratory attack again. Debugging marker display mechanism I found out that it is possible to refresh SlowLineMarkersPass and it will refresh markers for the specified document. Anyway the issue with annotations highlighting the code remained. The same way I found the GeneralHighlightingPass. Class that dealt with annotations etc refreshing, but there was one hitch: to create and launch it you have to feed it with a plenty of different odd arguments and it already took the wind out of sails. Debugging didn’t help, so I had to ask for help my good old friend Google. After several cups of coffee I found an article where it was suggested to use this way

DaemonCodeAnalyzer codeAnalyzer = DaemonCodeAnalyzer.getInstance(project);
codeAnalyzer.restart();

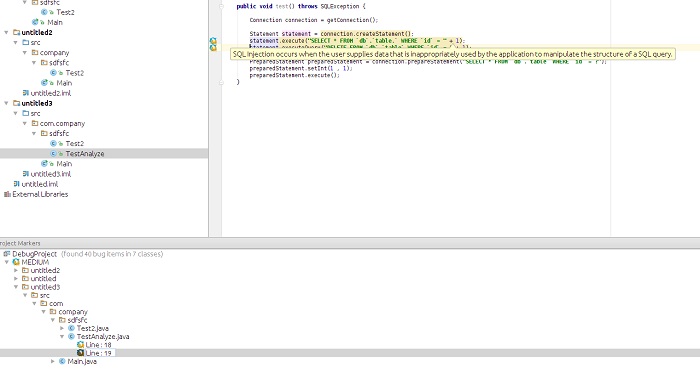
Bingo! This approach solved my problem both with markers and with annotations. Warning! If you install developed plugin into the IDE where it is developed and then you launch debugging of the same plugin, IDE sees the code exactly from the installed plugin. As a result IDE doesn’t pick up code changes and debug falls off. Take this into account and do not install your plugin into the operational IDE, before you finish development process. Eventually I got this plugin

code_programm
  1. First of all this task doesn’t take much time. It took no more that 5 days for the whole plugin.
  2. We got more flexible while completing our tasks for code analysis. It isn’t always fully accessible in ready frameworks for static code analysis.
  3. The opportunity to use PSI elements instead of AST simplified our work.

As there is not so much information on the Internet on this topic, I hope this article might be helpful for other developers.

Anna Vasilevskaya
AI modified real photo
Anna Vasilevskaya
Account Executive

Get in touch

Drop us a line about your project at
[email protected] or via the contact
form below, and we will contact you soon.