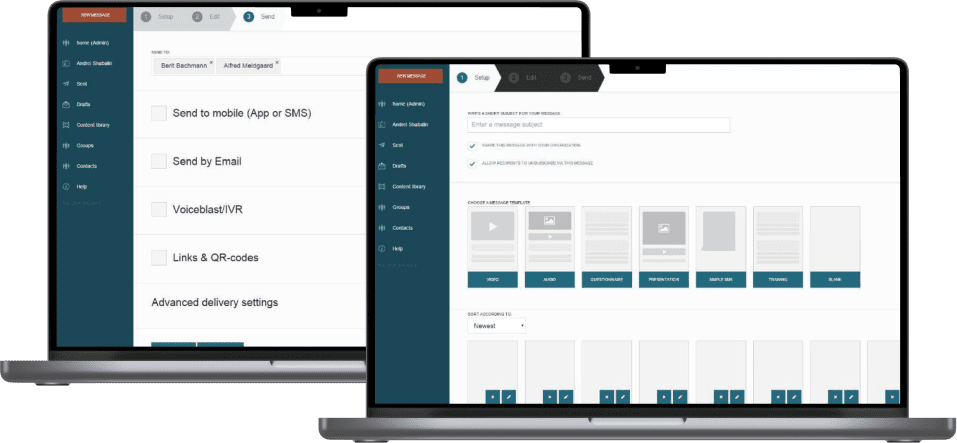
Product Engineering For AgTech

Product Engineering For an AgTech Manufacturer

Logo SpexAI

How developing a frictionless web app empowered an agricultural startup to bring the idea of a real-time AI-powered monitoring system to life and serve farms with 10,000–15,000 plants.

Industry:
AgTech

UX and Design

Web Development

Software Product Development

Product Design

Business challenge

There are industries, such as agriculture, that alongside tough market conditions, have to grapple with the pressure of an extreme qualified labor shortage*.

*Source: National Agricultural Statistics Services Farm Labor Survey (NASS FLS)

Our client is an example of an innovative AgTech startup that is rewiring modern farming — SpexAI offers automated AI-powered plant monitoring services for large US and Canadian greenhouses specializing in medical cannabis* production.

*It’s used for medical purposes only and contains no more that 0.3% of THC according to USDA-ARS, 2021 (US) and Cannabis Act, 2018 (Canada)

The client’s goal was to streamline the plant care process in several aspects:

  • Replace manual labor with automation to save a sizable chunk of farm employees’ time.
  • Substitute a lack of workforce for intelligent sensors.
  • Spot problem plants in the early stages of mildew, botrytis, or pest infestation through accurate and detailed real-time health tracking.
  • Detect plants with unsafe levels of THC due to hyperspectral imaging analysis, as in the US and Canada, plants exceeding the 0.3% total THC level must be destroyed, causing tremendous financial loss to farmers.
  • Back up harvest predictions and decision-making with accurate up-to-date analytics instead of guesswork to avoid year-end surprises.

Before reaching out to us, the client had already had:

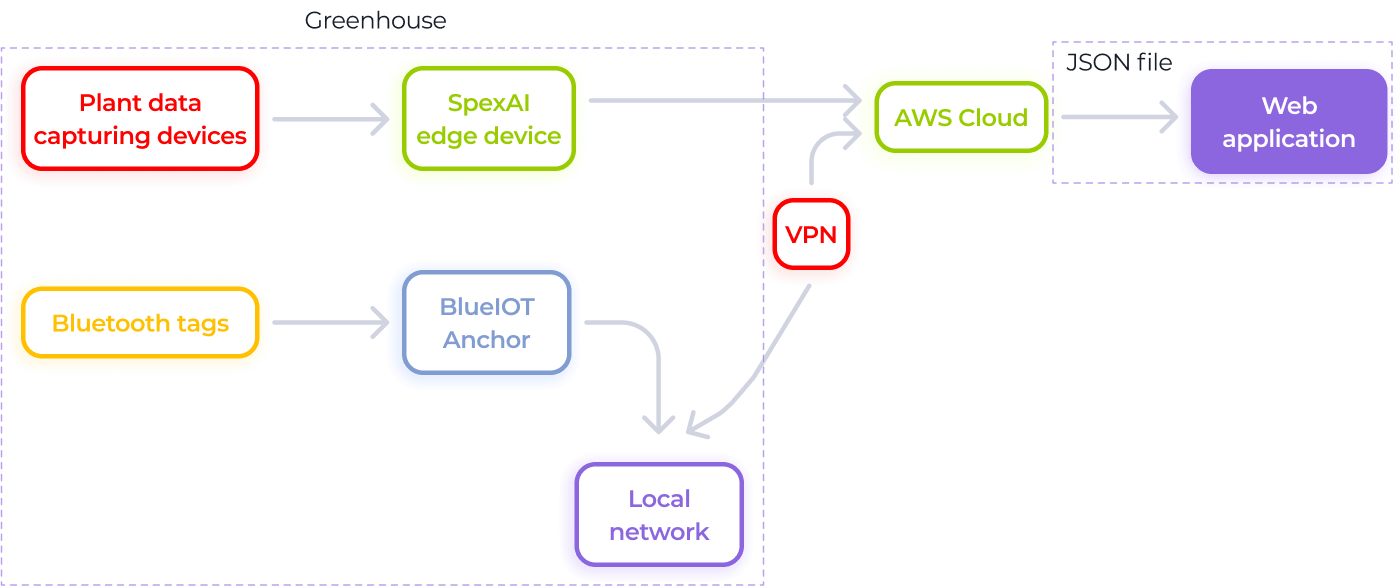
  • BlueIOT® tags that identify each plant
  • A robot – Hugin, harmlessly collecting data from the plants
  • AI – Odin – for analyzing the data

However, there was no software that would receive the data from the AI-powered robot and visualize it in a detailed yet easy-to-grasp form for the end users – farmers. The client needed a web app, and creating such a solution became the purpose of our project. 

How does the client's solution work?

Instinctools’ dedicated team had to craft:

Frontend

capable of displaying maps of farms with 2,000+ plants.

Backend

able to process up to 1,000 requests from the frontend in a second.

Visualization

of the map itself to see the data collected by Hugin (smart sensor) and analyzed by Odin (AI) in a simple and intuitive format.

User-friendly visual design

for the web app.

Solution

The client’s end goal was not just to get a Minimum Viable Product (MVP) but also to de-risk the product launch as much as possible. They decided to move incrementally, from the proof of concept (PoC) to prototype to a robust MVP. 

Besides implementing the changes driven by the farmers’ feedback on the prototype, we went the extra mile by crafting a solid MVP and making the app more feature-rich and appealing to investors and users.

  1. PoC and prototype

We assembled a core team consisting of a business analyst, product designer, and software architect to more effectively deal with the project requirements and limitations from the get-go.

Puzzling over the map of plants

Identifying the best way to visualize a farm’s map and finding the most suitable library to implement this concept on a technical level was the major head-scratcher of the whole project.

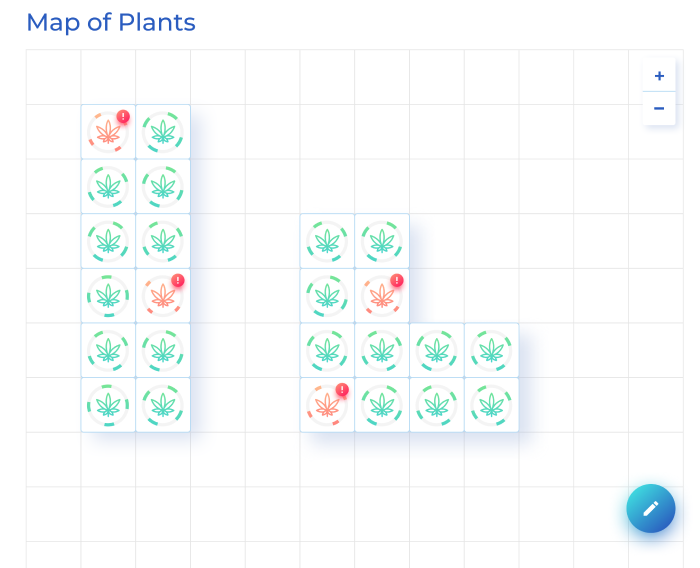
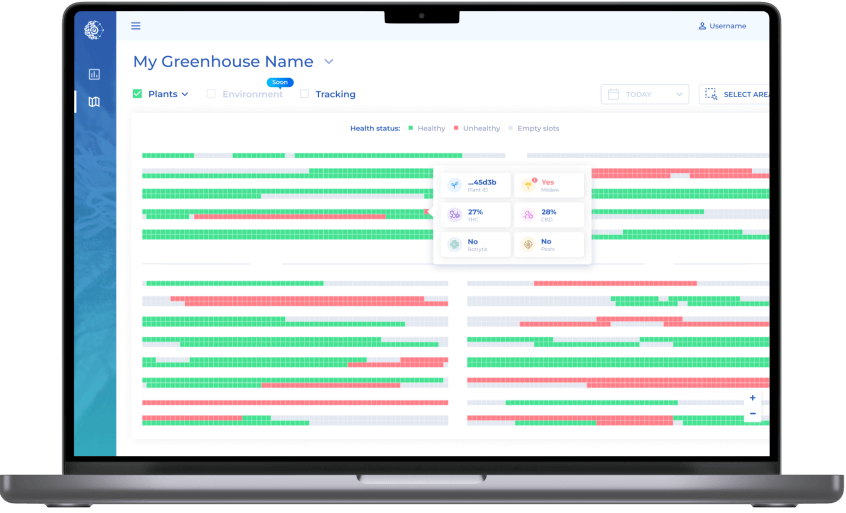
Since access to every plant was a prerequisite, our dedicated team devised a grid map with large cells, where a cell equals a plant.

For the technical implementation of the project, we chose D3.js — a JavaScript library for bespoke data visualization, as it allows:

  • Drawing a map with 10,000–15,000* cells quickly
  • Painting cells in specific colors
  • Illustrating different parameters (Health status, Cannabinoids, Environment) in layers
  • Showing pop-ups with detailed information about plants

* It was the amount we needed for the MVP.

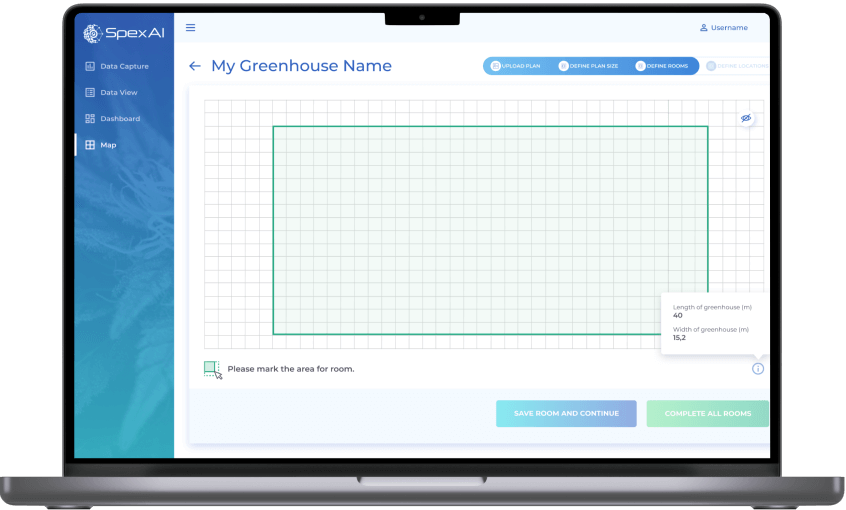
Looking for the best way to transfer the original farm map structure to the app

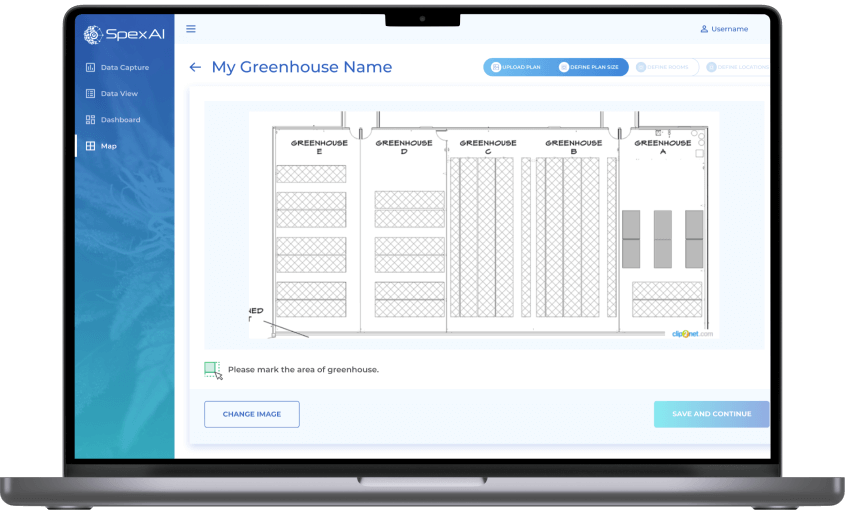
At this stage, we faced another question — what is the best way for our frontend and backend developers to receive the configuration of the farm? This issue could be solved by using a tool for software solution structure visualization. The client entrusted us with finding the most beneficial option available.

In Visio, Miro, Lucidchart, and other popular tools, monthly subscription costs $5–8 for a user. We managed to find a more affordable solution – draw.io – that costs $5 per month for ten users.

Identifying the most appropriate framework for the back end

According to the client’s requirements, the web app’s back end had to handle up to 1,000 requests from the front end per second. Therefore, we suggested using the asynchronous framework FastAPI, designed specifically for building high-performing web applications. FastAPI was also the best bet, as it is:

  • Fast to code*
  • Fully compatible with the declarative language JSON Schema, which allows for confident validation and annotation of JSON files, understandable for our web app’s front end
  • Compatible with OAuth 2.0 protocol, which simplifies signing in for the end users while ensuring the security of the process

* According to the FastAPI documentation, the framework provides developers with the possibility to speed up the features development process by about 200% to 300%.

What user functionality was provided in the prototype?

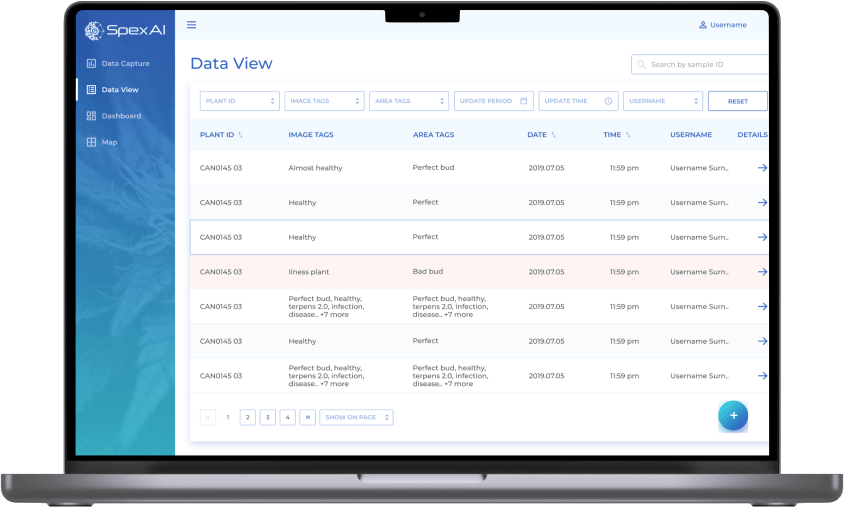
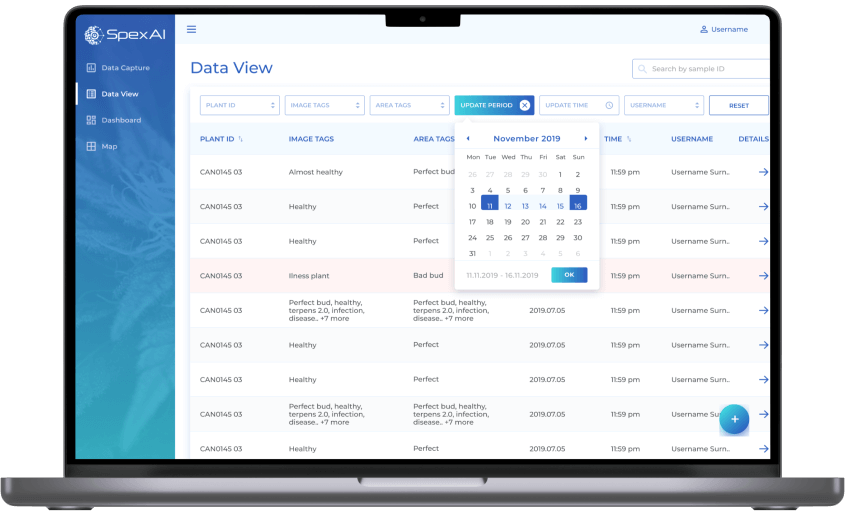
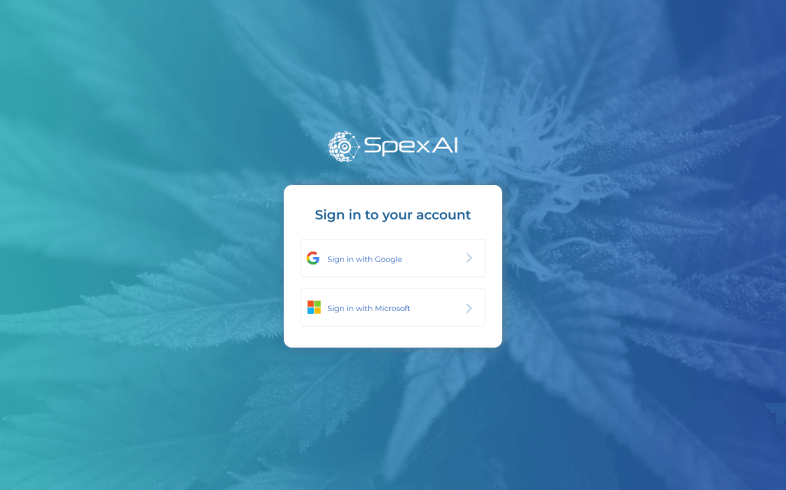
Ability to log in and sign in with Google and Microsoft credentials.

Digital twin of a greenhouse.

Access to key data on each plant.

Information visualization on the plants’ health status and their cannabinoids level at the scale of a whole greenhouse, updated once a day.

  1. MVP

The app’s prototype was successfully tested on a Canadian farmer’s greenhouse. Farm employees’ feedback unveiled how to improve the application, which we did at the MVP development stage. Instinctools’ team upgraded the UX, fine-tuned and expanded the solution’s functionality. What has been enhanced?

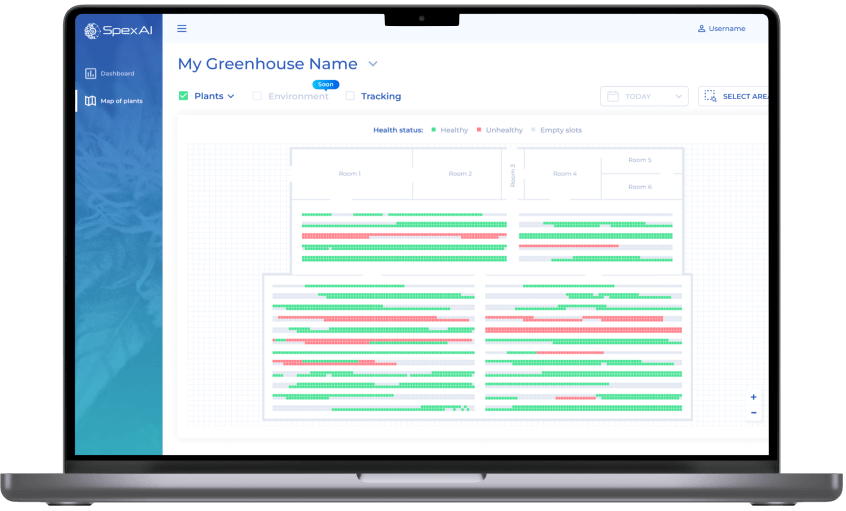
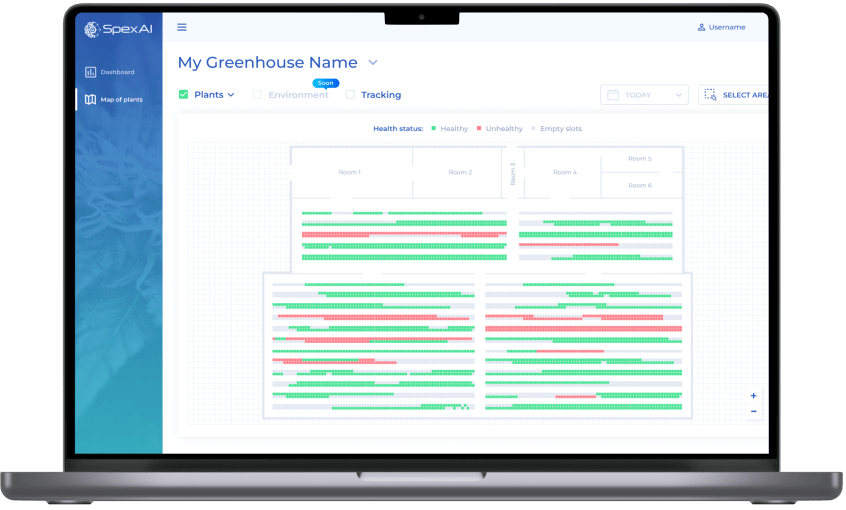
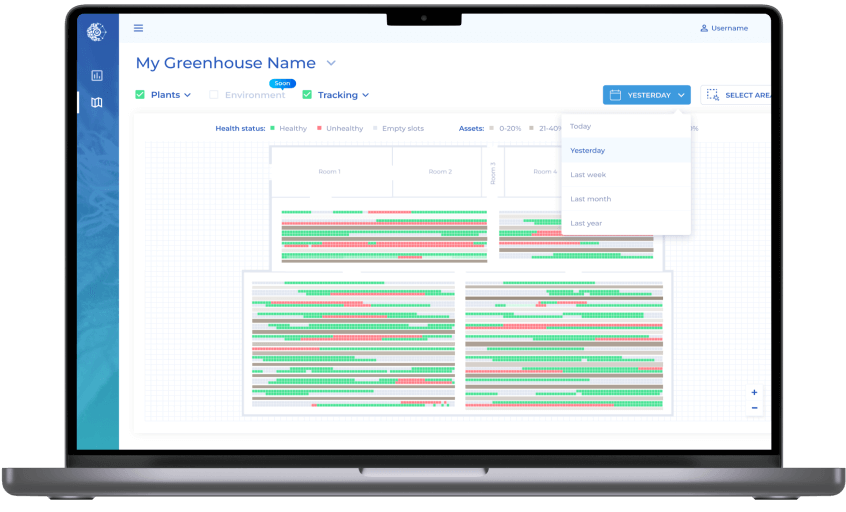
The scale and view of the map and the ability to zoom it

As having a top-level view was mandatory for managing the whole greenhouse, we suggested reducing the map’s scale and adding the ability to zoom it up to 500%, considering the client’s ambition to cover the farms with 10,000–15,000 plants and several greenhouses.

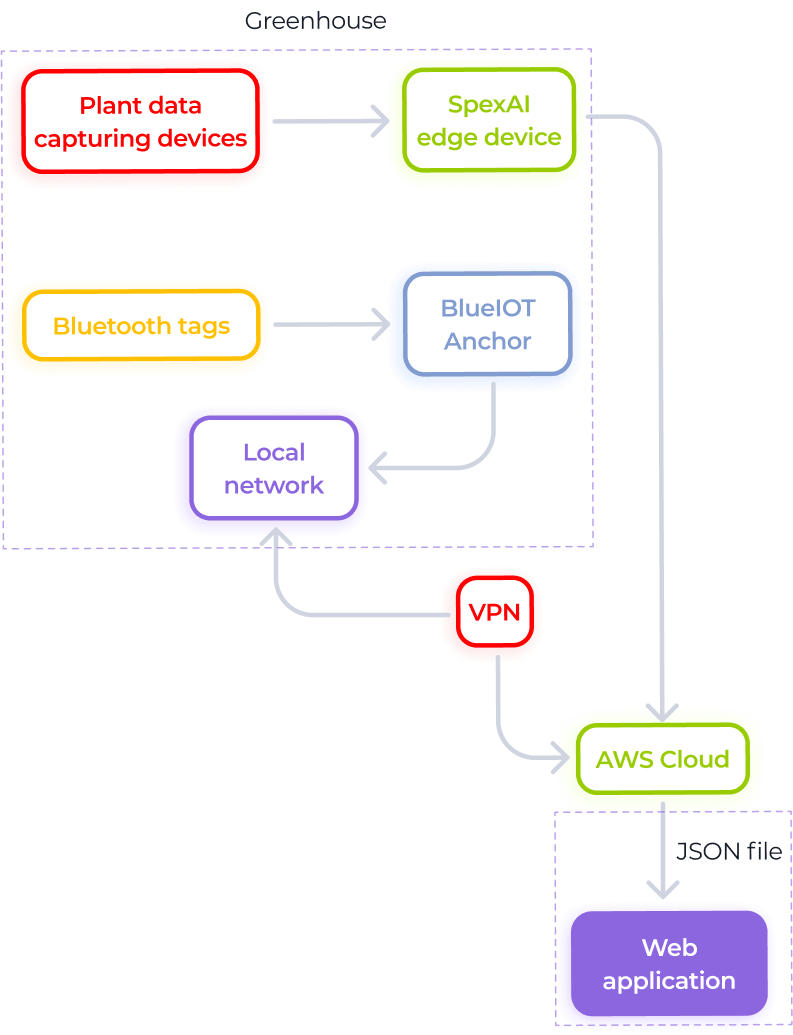
As you can see on the mock-up, we’ve added gray cells to show free spots. If a plant is transplanted, the system automatically reflects it in a new cell as Hugin (a smart sensor) reads its BlueIOT tag at the new location, and the former cell of this plant becomes gray indicating a vacant place.

Enhanced UX

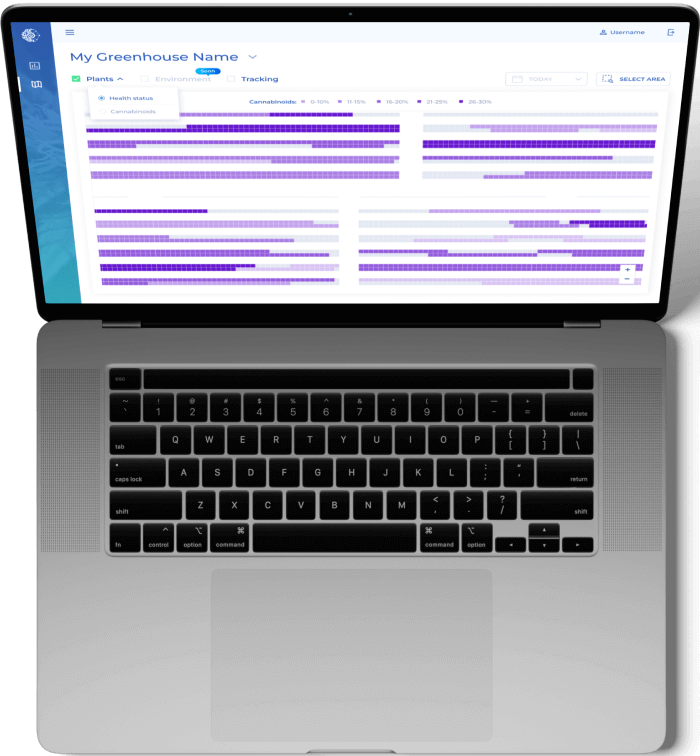
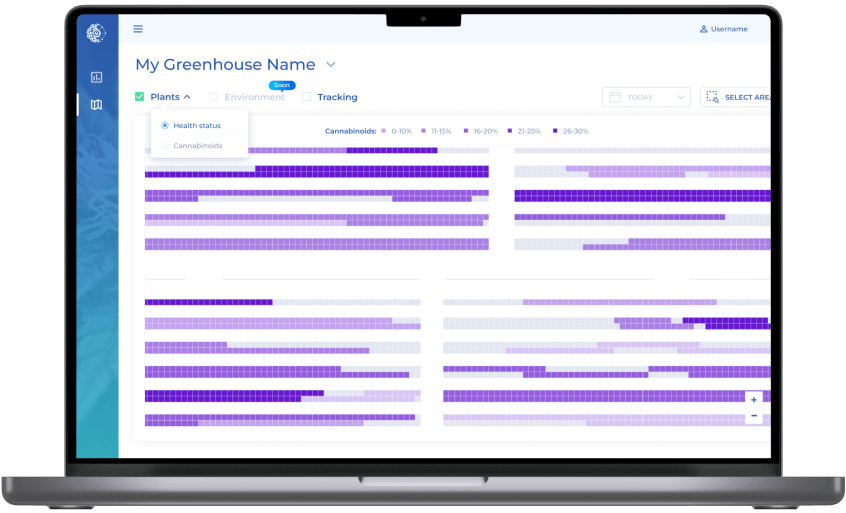
Whereas in the prototype users could only see cannabinoid levels for a single plant, now this parameter is visible at the scale of an entire farm.

Broader amount of data collected about plants

We’ve added tracking of mildew, botrytis, and pests that affect plants’ health status and updated the logic for determining healthy/diseased plants. Now, if a plant has at least one of the problematic parameters, it will be marked by the system as unhealthy.

In a nutshell, when a user moves the cursor over the plant, they now see a hover with the following data:

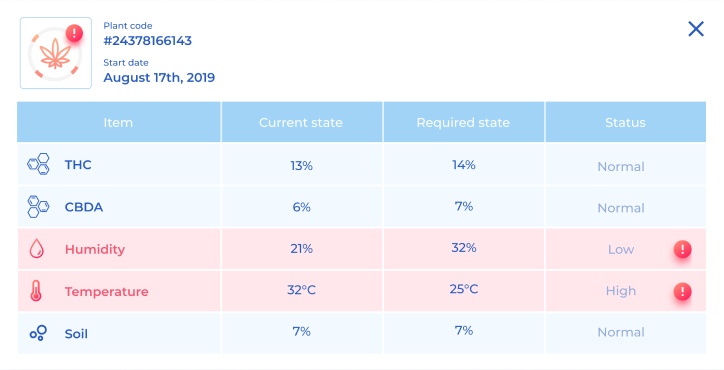
  • Last numbers of the Plant ID
  • TCH index
  • CBD index
  • Botrytis presence
  • Mildew presence
  • Pest presence

Select mode on the map with the ability to see statistics for the chosen area

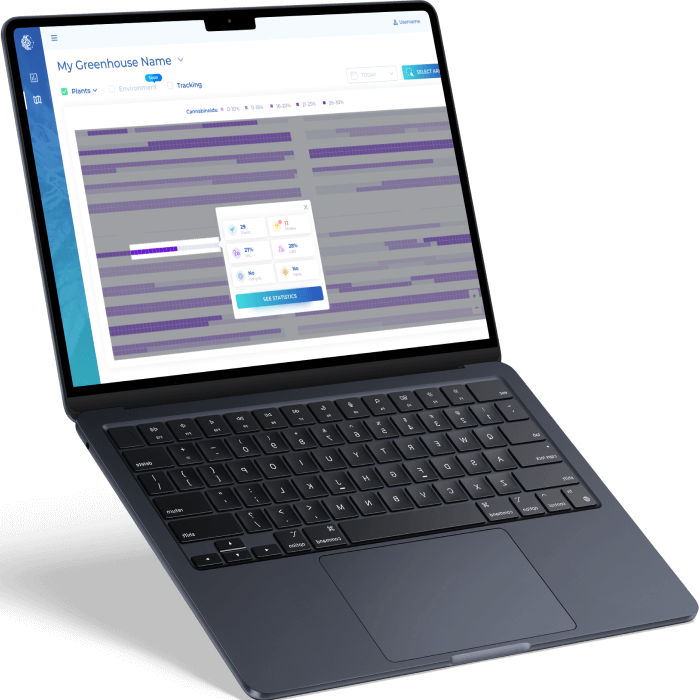
While in the prototype, it was possible to view statistics only for individual plants by clicking on them, in MVP, users can select any area on the map and check up-to-the-minute data about it. This functionality works in the same way for all map layers.

More detailed filtering with the option to set check-boxes on several tracking layers simultaneously

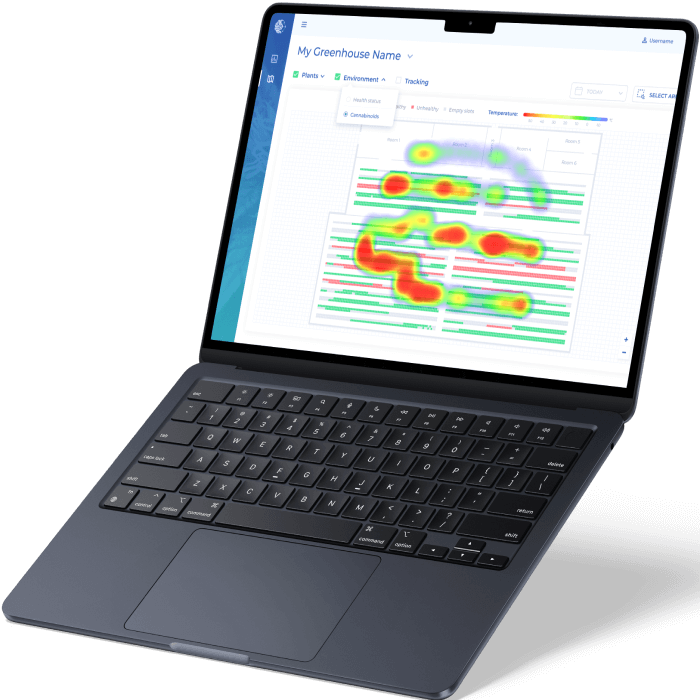
With multiple filters required, setting the filtering was one of the project’s tough calls. Partially, this was solved simply by colors. But the client wanted to add another layer – ‘Environment’ – to check how humidity and temperature influence plants’ health status and cannabinoids level. 

They also wanted to allow end users to visualize a combination of parameters from the different map layers. This was tricky both in terms of graphics and technical implementation. We solved the issue using heat maps overlaid on the farm’s map.

Now the map has two layers:

Plants
Environment

Real-time data updates

As the temperature and humidity in the greenhouse can change more than once during a day and influence the plant’s condition, updating data once a day carries a probability of inaccuracy in analytics. Therefore, we ensured that Hugin (the smart sensor) was constantly collecting data and Odin (AI) analyzing it so employees could access up-to-date data any time.

  1. MVP evolution

The MVP version of the app was successfully tested on the Canadian investor’s farm. Yet, we went the extra mile and suggested several features to make the software even more beneficial for farmers and put SpexAI on track to high profit.

Ability to view the greenhouse history

Users can access retrospectives of an entire farm, its highlighted area, or an individual plant to check how its health status and cannabinoids level changed over time. With data from previous periods, farmers can better plan the following season.

Leaving notes on the map

Farm staff who tested the app’s prototype mentioned that leaving notes about plants on the map would be convenient. With such an approach, if an employee working during one shift discovers that certain plants require special attention, they can leave notes for employees working during other shifts to notice deviations straight away.

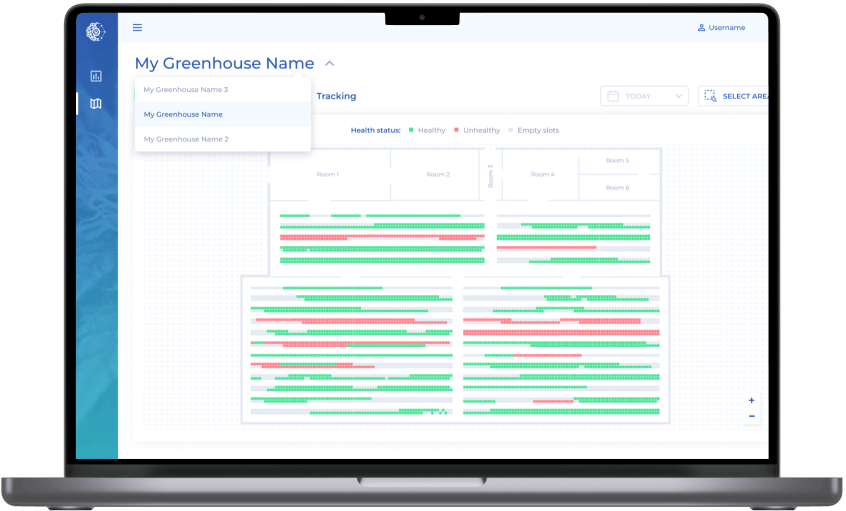
Multiple greenhouses within one account

Although the solution was tested on a farm with one large greenhouse, the client expected that in the future, the application would be used by farmers with multiple greenhouses, so we built in such functionality. 

This feature came in very handy as, thanks to the elaborated MVP, the client has found farmers with several greenhouses for 10,000 and 15,000 plants.

Different roles within the app

There were no different roles in the app’s prototype version. However, its architecture allowed implementing this logic down the road. Therefore, we designed two initial roles for MVP — greenhouse managers and farm owners with different levels of access to data and depth of the reports:

  • Greenhouse managers can only check the greenhouse they are responsible for, but they have highly granular reports.
  • Farm owners can view all greenhouses and all farms, but they have top-level data in their reports.

Before

  • Absence of a specialized tech solution for the safe monitoring and analysis of the plants’ state in greenhouses
  • Lack of top-level view of a whole farm and ability to drill down into greenhouses areas and separate plants
  • Inability to provide real-time monitoring of the farm
  • Decision-making based on personal insights and guesswork
  • Failure to spot plants with non-safe THC levels before they have to be disposed of
  • Incapability to track the history of plants’ condition to predict future changes 

After

  • Easy-to-grasp actionable insights based on leaf-level images from crop monitoring
  • The very first solution for harmless monitoring and analyzing the state of medical cannabis plants in greenhouses
  • Interactive multi-layered greenhouse map
  • Holistic data about plants’ condition in real-time
  • Decreased number of plants requiring eradication due to THC exceedances thanks to predicting the cannabinoid level during growth
  • Greenhouse history at the fingertips empowers farmers to make accurate hypotheses about possible changes ahead

Key features

Innovation

SpexAI is a trailblazer for intelligent and harmless solutions for medical cannabis monitoring and analysis.

Profitability

The software unleashes new profit prospects for farmers by fundamentally reducing the number of plants that had to be disposed of due to non-safe THC levels.

Scalability

The web application can be used both for relatively small greenhouses with 2,000 plants or huge farms with tens of thousands of plants.

Business value

  • The very first solution for harmless monitoring and analyzing the state of medical cannabis plants in greenhouses
  • 100% automated plant monitoring and analysis
  • Interactive health trends at the scale of one or multiple greenhouses
  • Detailed data about each plant available at the click of a button
  • Minimized cases of plant eradication because of the exceeded THC level
  • Decision-making backed up with up-to-the-minute information and historical data

Client’s testimonial

Odoo On-Premise Implementation For a European Streaming Platform

Odoo On-Premise Implementation For a European Streaming Platform

How replacing outdated software with Odoo ERP and custom BI tools allowed a streaming service provider to implement a monthly billing model, get a 360-degree view of their customer data, save 1000+ hours of manual operations on inventory management, and bring thousands of new customers to the platform all over the EU.

Industry:
Media and Telecommunications

Duration:
12 months

Team:
a project manager, two business analysts, a UX designer, a solution architect, four backend and four frontend developers, four quality assurance specialists, and a business intelligence consultant

Context

Any company’s growth brings opportunities for investment and new market outreach, and entails a transformation of business processes, operations, IT infrastructure, etc. Experiencing a significant rise in customers, our client decided to improve their subscription-based business model, allowing their end-users worldwide to be billed for IP television services on a monthly basis, not annually as it had been before.

The introduction of such a seemingly simple change in the subscription model required a significant transformation of current business processes, which also led to the implementation of a corporate ERP system. The company got in touch with *instinctools for IT consultancy to find a solution and for ERP system development to run their business more effectively and quickly adapt to ever-changing market needs.

The main goal for our team was to advise on and implement an ERP system that would match the company’s existing business processes, taking into account growth plans. Another essential requirement was choosing an ERP system that was easy to maintain and develop in terms of cost and availability of specialists.

During the Pre-Discovery workshop, our team analyzed a current client’s business model and suggested a best-fit solution. The customer’s key non-functional requirements for an ERP software were the following: an on-premise solution that can be managed on company servers, free licensing, fault tolerance, and customer support. Implementing the solution as soon as possible was vital, as they needed to handle an ever-increasing array of data.

*instinctools provided a detailed project estimate with a scope and vision of the future ERP solution as a primary output of the workshop. After a thorough analysis, our experts suggested implementing the Odoo ERP system. Here are a few reasons why we’ve chosen Odoo, alongside the fact that it ultimately met the client’s requirements mentioned above:

  • Multiple module integration. The Odoo system has a broad set of features and modules ready for customization according to any department’s needs.
  • Odoo is among the leading ERP solutions in the market with a huge community and app store.
  • Odoo fits small and medium businesses bringing them high flexibility and scalability.

Dedicated team

To successfully complete the project within the time frame set by the customer, *instinctools gathered a dedicated cross-functional self-managed team able to implement the project end-to-end. The project’s dedicated team consisted of: a project manager, two business analysts, a UX designer, a solution architect, four backend and four frontend developers, four quality assurance specialists, and a business intelligence consultant. The right composition and skill set made it possible to implement the project within the required timeframe.

Challenge

When implementing new IT solutions, companies usually face many challenges in operations and processes, not just purely tech issues. Our customer collaborated closely with the *instinctools dedicated team, allowing them to focus mainly on IT challenges and some organizational issues.

  • Data migration

    The data about users’ quantity was one of the unknowns in the first stages of the project estimate. It complicated the process of data migration to the new system, as the actual number of users (internal and external) was much bigger than the pre-estimated. As a result, we had hurdles with the performance of certain system operations and needed to react quickly to changing requirements and other issues.

  • Odoo modules integration and customization

    One of the benefits of the Odoo ERP system is the variety of modules for different units, operations, and management. The choice of the modules for particular business needs wasn’t as challenging as their integration into the current system. Most essential components needed customization and adjustments that our engineering team managed to implement.

  • Data visualization and reporting

    Companies not using an ERP system may lack data visualization and fast reporting available for different units. With the growing amount of data and the length of Excel spreadsheets, the implementation of Business Intelligence became a necessity for our client. The standard Odoo module didn’t meet the client’s data visualization and reporting requirements. We needed to build a BI tool and enable its connectivity and accessibility within different units.

  • Integration with third-party services

    The last but not the least important challenge for our dedicated team was integrating the Odoo ERP system with the services, enabling the sustainability and smooth operation of the whole business machine, from notifications and stock management to acquiring systems and legal resources.

Solution

Instinctools’ dedicated team, working closely with the customer’s IT and Operations departments, was able to implement a holistic ERP system, connect all the necessary integrations, and develop and set up the required Odoo modules. It fully met the demand for sustainable and scalable software solutions that are compatible with internal and external services, running on on-premise servers, having fast reporting and visualized analytics, and ensuring reduced costs on the maintenance and support side.

With this solution, we helped our client achieve its primary goal, the upgrade of a subscription model provided to their customers.

Key features

  • Customized Odoo modules for stock management, logistics, accounting, legal operations, and marketing analytics.
  • Internal integrations with Google Analytics, e-mail services, and notification systems.
  • Tableau business intelligence tool with distributed access for all units and fast reporting.
  • External integrations with DHL, Hermes, NevelNet, Stripe, and other services.
  • Sepa acquiring system.
  • DATEV-format reports compliant with the law for tax authorities.
  • Odoo Website SSO (Single Sign On) module.

Business Value

Thousands of new customers have tried the monthly subscription service offered by our client since the first project solution release. It allowed the company to understand their customer’s pains and needs better while interacting with the product and services. That, in turn, helped to deliver value and improve customer experience.

We revealed the hidden issues in our client’s company’s complex processes and operations during the project implementation. They noticed the flaws of the old system that had been holding the company back from innovations and opportunities to scale faster and increase clientele worldwide for a very long time.

The client’s digital transformation became the enabler of positive changes bringing their business more revenue, new market opportunities, and, most importantly – customer loyalty.

Technologies

React
Python
keycloak
Odoo Material UI
Tableau

Real-time Data Visualization For an HR Department

Real-time Data Visualization For an HR Department

How the development and implementation of 10+ custom Power BI dashboards empowered an enterprise software company to switch from a reactive hiring paradigm to a proactive one and decrease the time to fill a vacancy by 21%.

Team:

Data Engineer, BI Analyst, QA Specialist, Project Manager

Challenge

*instinctools constantly hires different types of developers, DevOps, QA specialists, business analysts and project managers. They can be recruited into the company’s staff or as contributors to a particular project.

For the past 3 years, *instinctools has grown by 30%, which, at some point, caused mixed feelings among the stakeholders. As undeniably great as rapid growth is, it also creates the necessity for better awareness of the recruiting efforts.

Real recruiting has nothing to do with copying-and-pasting the vacancies and waiting peacefully for tons of applications. Real recruiting is about channel efficiency and productivity of both individual recruiters and the whole team. The biggest mistake that a recruiter can make is flying blind.

Listening to your gut or following your instincts might have a point just to a certain extent. When a company’s future is on the line, instincts must be complemented with strategy. Hence, *instinctools hiring team required high-quality recruitment analytics to make truly informed, data-driven decisions.

Although at the start of the project the company had been using Huntflow – a professional CRM for recruiters, its built-in analytics wasn’t informative and detailed enough to meet the company’s needs.

What head-scratches did we have?

Quick and well-thought-out decision-making was impossible, so time to fill increased and candidates were oftentimes poached by competitors.

The head of recruiting couldn’t see the whole picture on the department performance and wasn’t able to plan the hiring process accurately.

The correlation between recruiters' efforts and results wasn’t vivid.

The lack of offer acceptance analytics got in the way of understanding what influenced candidates’ decisions and what could be improved.

Solutions

One of the greatest and simplest ways to gain easy access to real-time data is to implement business intelligence tools. Modern technologies allow for the data analyses in larger volumes and at a higher speed.

Because *instinctools uses Power BI for their internal analysis, we decided to integrate data from Huntflow with this system. Every 24 hours all the data from Huntflow is sent to the cloud storage, which Power BI connects to for further analysis and visualization.

The solution was gradually developed in close collaboration both with the head of recruiting and the CEO.

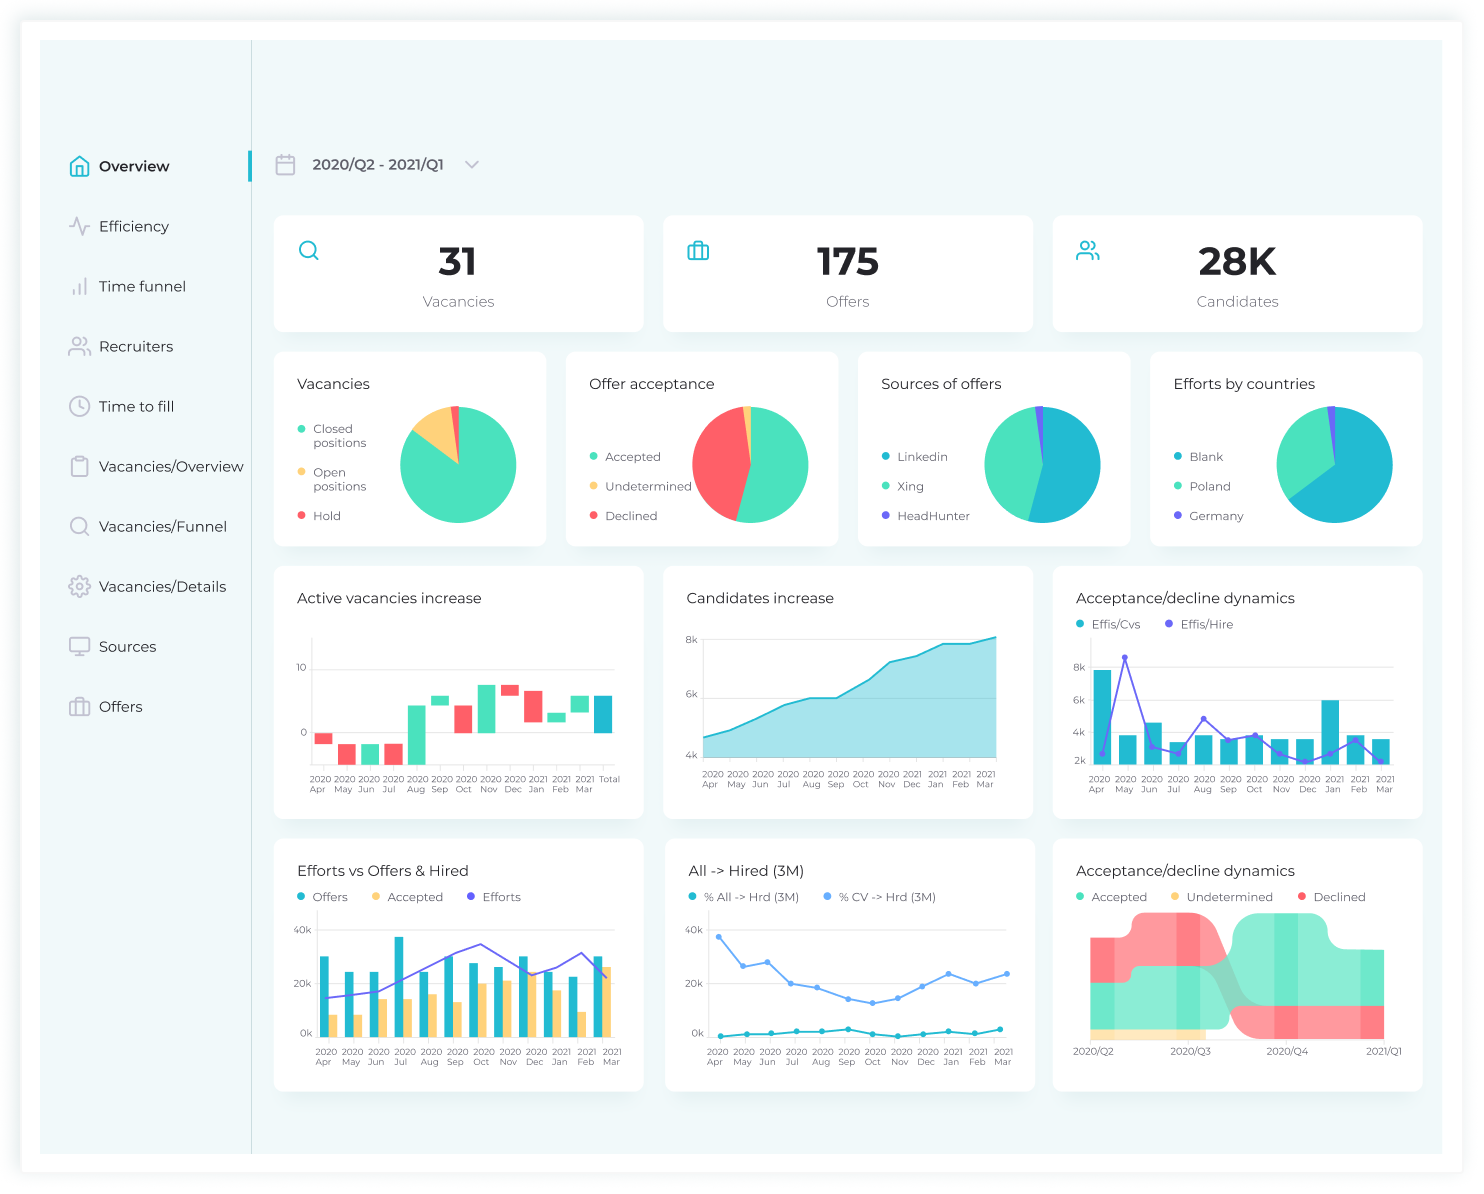
During the project, we managed to narrow a tremendous amount of data down to the important metrics. In total, 10+ dashboards were made to provide top-notch analytics for the company’s different roles.

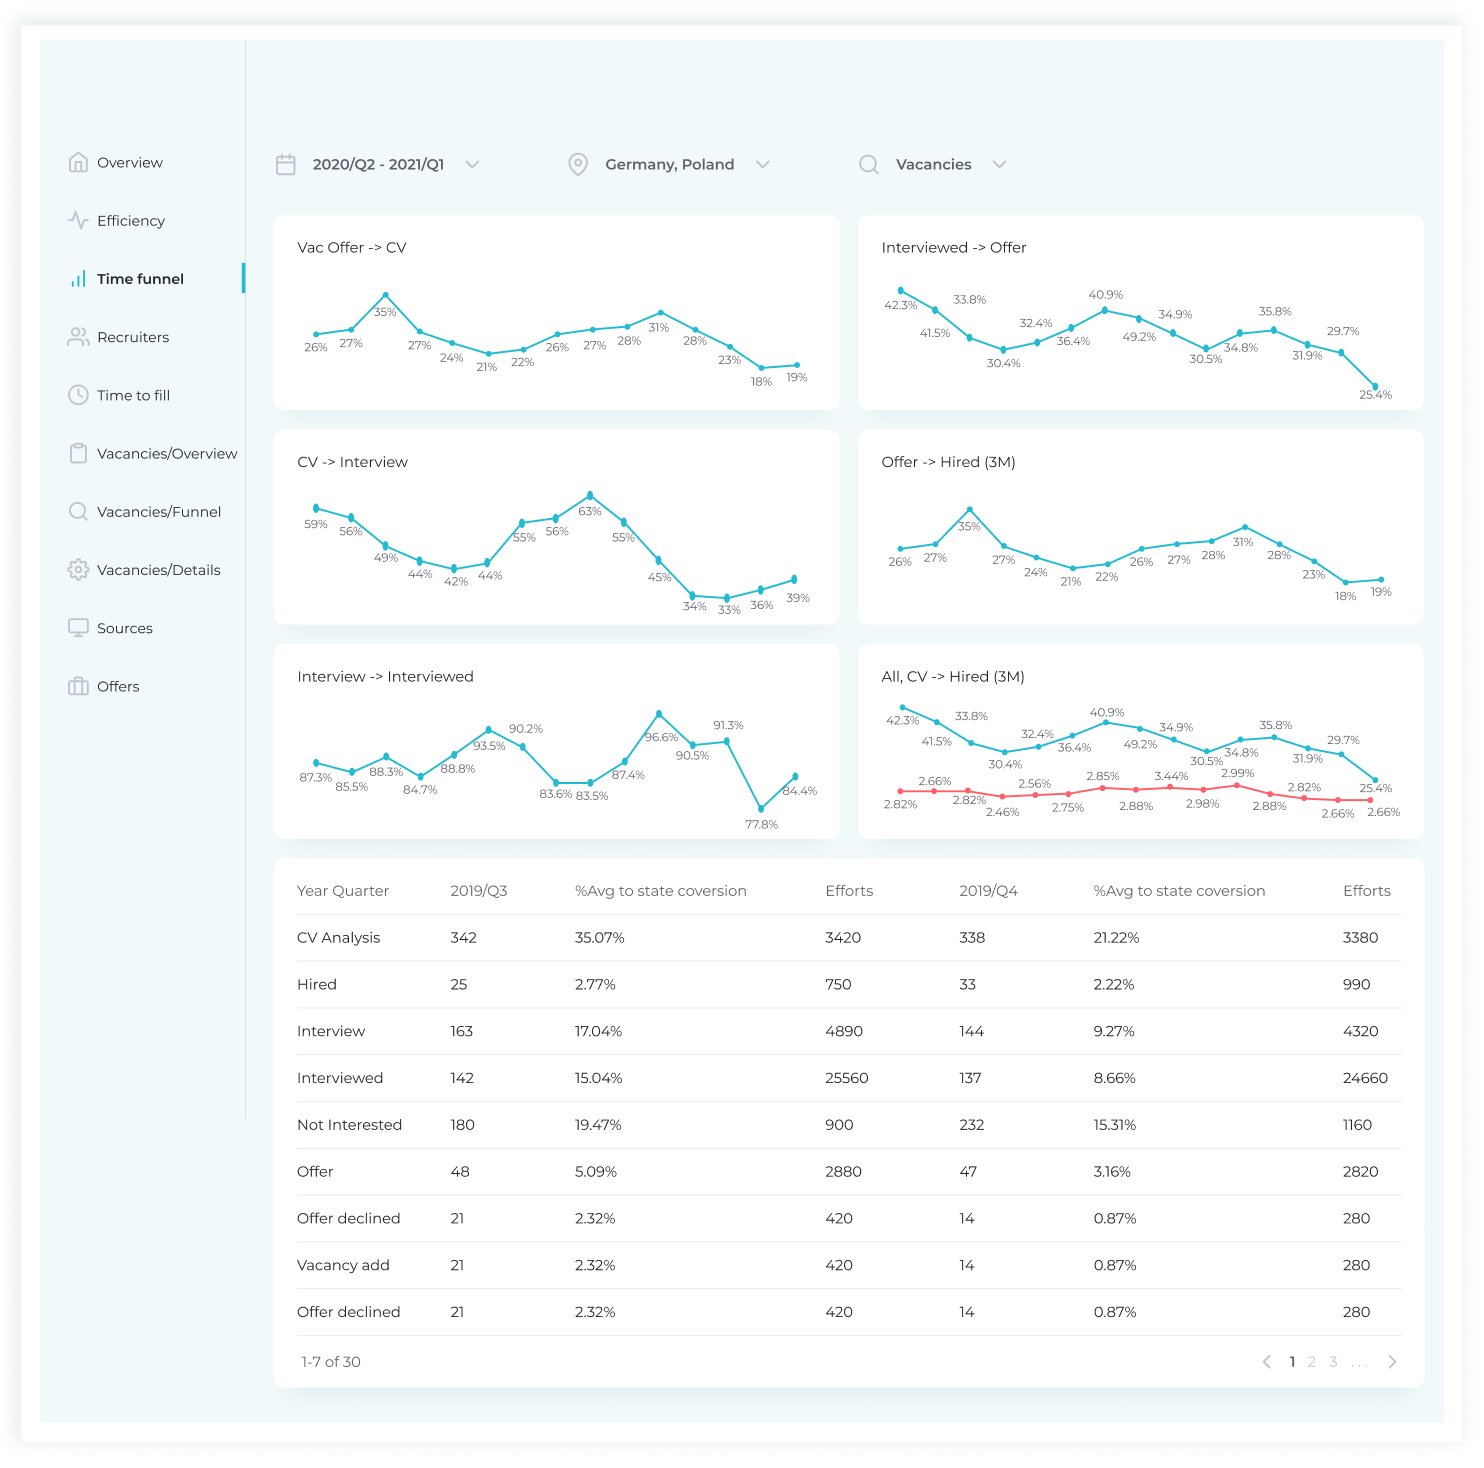
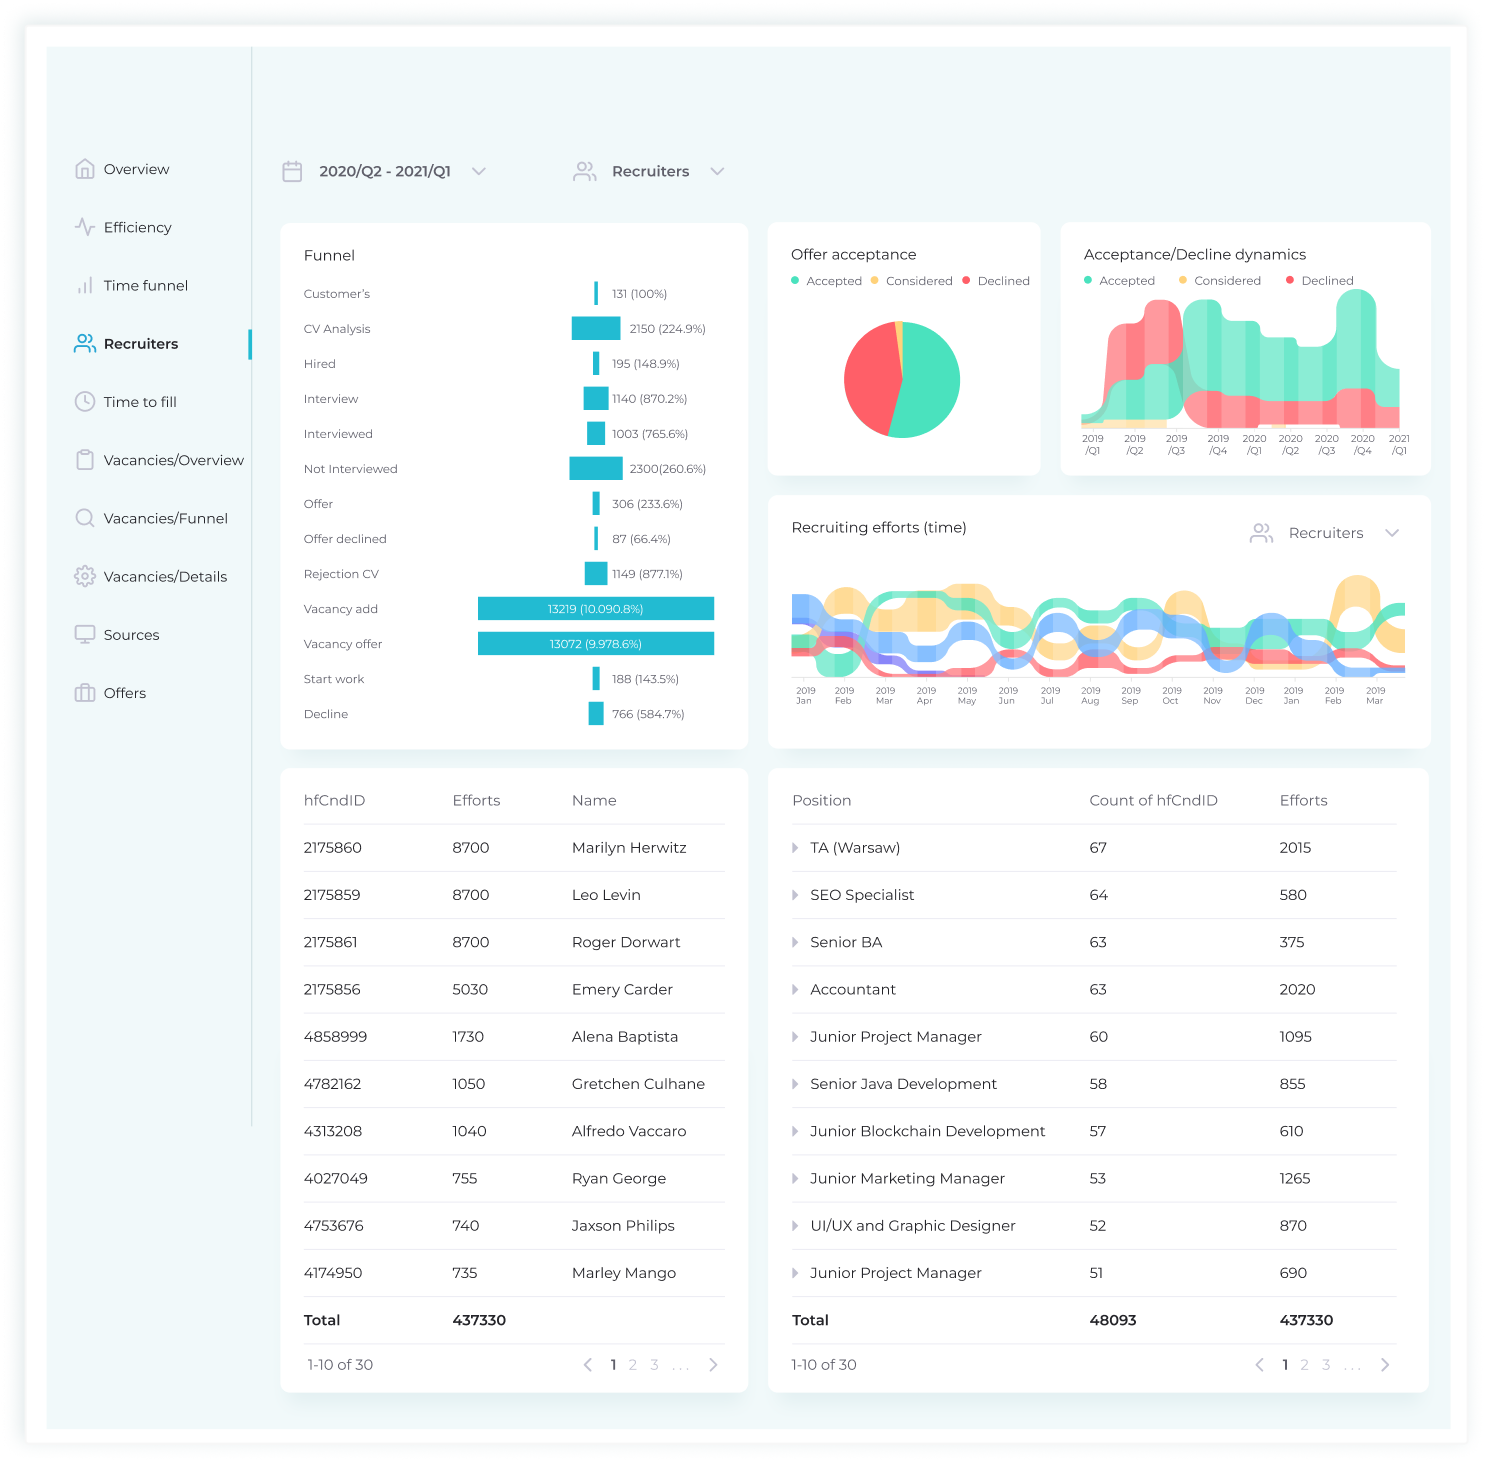
Here are some of the dashboards that *instinctools recruiting managers use:

Overview provides a bird’s eye view of the company’s recruiting processes.

Efficiency measures recruiting efforts against the number of candidates that have accepted the offers. The statistics clearly show whether these numbers align with the goals recruitment has right now and whether their targets will be met in future at this capacity.

Vacancy overview is an operational report on all the currently open positions. The data represented on this dashboard keeps recruiters and heads of units in sync regarding vacancy states and hiring priorities.

Vacancies/Details visualizes the speed at which the candidates move down the funnel. Apart from that, it’s possible to look through the information on each candidate.

Offers contains dynamic reports on sources and channels of hire, interviews, offer acceptance rate (OAR), and, last but not least, declines, which are the other side of the OAR coin. Understanding what keeps talent from saying “yes” to the offer has given an opportunity to improve the hiring process and other aspects within the company that influenced candidates’ decision.

Recruiting conversion rate provides insights into the value and effectiveness of *instinctools’ recruiting process. This dashboard describes hiring efficiency in terms of efforts of a particular recruiter on each vacancy: offer acceptances/declines and acceptance/declines dynamics in the timeframe. Such an approach is essential to determine the room for improvement for each recruiter individually and hone their performance.

Sources reveals which sourcing platforms (job boards, the company’s career page, employee referrals, etc.) are the most effective. With this operational KPI, recruitment managers can better understand their recruiting expenditures, stop using futile channels and switch to the ones that bring in really interested and qualified candidates.

Time to fill measures the amount of time it would take to locate and hire a potential new employee. The process begins with a requisition being approved by a company and extends to the point when the offer is accepted by the candidate. Essentially, it gives managers the opportunity to understand how long it takes to fill a job position and, thus, helps them plan hiring better. These metrics also serve as a warning when the hiring process takes too long. Within the dashboard, there’s a possibility to filter out the data by areas of expertise, location and timeframe. Most importantly, reviewing time to fill analytics helps predict how long it will take a candidate to accept the offer and, as a result, increases the chances of them starting to work on a project on time.

Traditionally, talent acquisition teams focus on tactical or efficiency metrics such as time to hire or number of hires made over a given period. These recruiting metrics are useful insofar as they help to observe inefficiencies and opportunities to improve the hiring process; but they’re reactive rather than proactive or predictive—and they certainly don’t matter to executives as much as they matter to recruiters. The key figures for C-levels are strategic – the ones that are directly linked to business outcomes. The dashboards that the CEO usually looks through are Overview, Vacancy funnel, Offers, and Time to fill.

Value

Now that the recruiting department has the power of data at hand, they understand better how the organization is attracting talent and can improve on it. With flexible, expandable analytics sliced and diced according to their specific needs, recruiters got a clear picture of the talent pipeline, which shows the path of every candidate from every source through every stage of the hiring process.

The numbers speak for themselves – thanks to considerable insights into the recruitment, Instinctools started to fill the positions 21% faster than it used to. Moreover, the diligent analysis of salary expectations allowed the C-levels to make the necessary adjustments to the wage scale.

In general, the created metrics cover a lot of important KPIs, which bring greater transparency in hiring and, ergo, make it possible to plan the company’s capacity. Currently, not only can the executives adjust salaries to match the market, they can also track the trends in expertise, react to them in no time, and plan the start of customer projects more reliably since they know how much time it takes to fill a particular position.

Technologies

MS SQL
Azure
Power BI
Huntflow API
Google Docs
MySQL
PostgreSQL
Python
1C
SMART

Tableau Implementation For a EU Streaming Service

Tableau Implementation For a EU Streaming Service

How replacing Excel spreadsheets with interactive BI dashboards empowered a media-services provider to reimagine their data processing, reduce the cost of data management-related IT tasks by 27%, save 280 hours a month on report generation, and boost Customer Satisfaction Index by 7.2%.

Domain:
Media and Entertainment

Duration:
4 months

Budget:
$50.000

Challenge

The growing amount of business data not only made data processing and reporting within our customer’s company slow but also diminished trust in data quality.

In order to stand apart from the competition, reduce costs, and increase profits, a company must make intelligent decisions – decisions based on trustworthy and relevant data. This is exactly where BI comes in useful.

However, with traditional BI tools and processes, the IT department controls access to analytics data and does the data analysis work for business users. And as much as our customer craved for BI analytics instead of wasting an embarrassing amount of time copying and pasting things into excel, they were not really happy with the idea to operate in a highly controlled environment, where analysts or the IT team maintain access to data. It seems fairly rational since high dependency of business users on an IT department is time-consuming – waiting for the required reports may take up to several days – and really costly – the maintenance of an IT team is high so it’s better to free them from routine data capture and reporting and let them concentrate on high-level priorities.

Anyway, our customer reasonably believed that – here comes their quote – “data reporting and analysis should not be this hard” and hoped to make the in-depth analysis more user-friendly, so that everyone in a company could generate their own actionable insights, modifying the reports and dashboards without a hitch.

Tasks

The key goal was to optimize the decision-making across the company within a business intelligence environment. To reach that, the following tasks were set:

  • to increase flexibility and speed in report generation
  • to ensure consistency and high quality of data in the context of its constant growth
  • to have access to reports anytime and anywhere
  • to give users a single source of truth
  • to decrease the dependency on the IT department

Solutions

To enable non-technical users to get insights into the data without relying on IT staff and, thus, speed up decision-making, self-service BI was decided to be deployed.

While working on the project, *instinctools team had to overcome a number of issues such as corrupted data, multiple data sources, terabytes of data to update, calculate and analyze, etc.

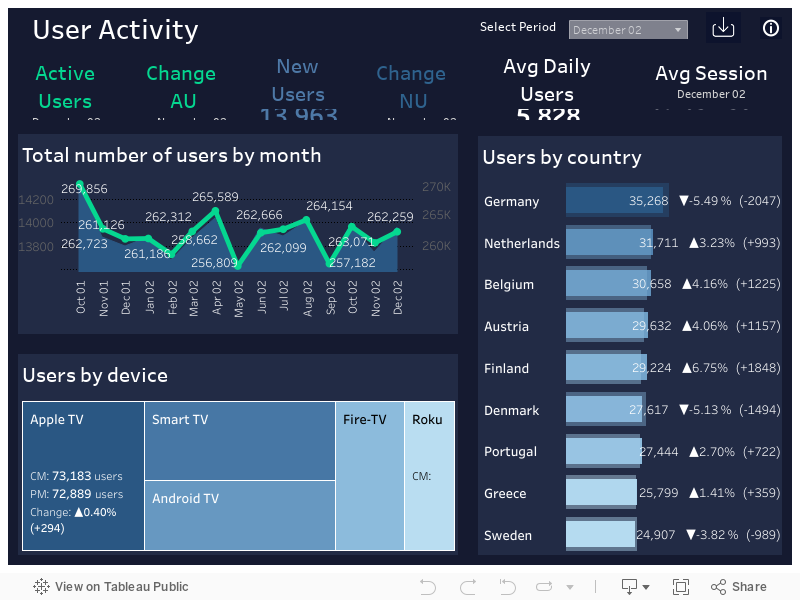
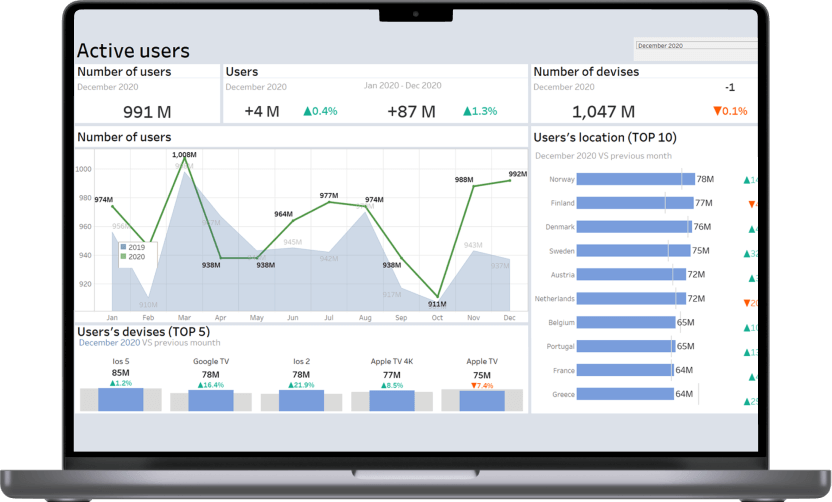
Nevertheless, we’ve managed to implement and integrate a self-service BI solution based on a visual analytics platform (Tableau), that fully meets the customer’s diverse requirements.

Thanks to self-service BI and Instinctools training program for business users, the employees can independently create ad hoc analyses specially addressing their particular needs. They are also able to modify the existing dashboards by themselves, easily adding metrics or KPIs that need to be tracked. On top of that, from now on all the data required for dashboards is prepared, integrated, and stored in a single data warehouse, which limits the pressure and workload on data management.

If there is still a need in adding new data sources and modifying the data models, adding new custom dashboards – instinctools team stays in touch to provide the required customer support.

Features

ETL (Extract, Transform, and Load) - an automated process of blending data from multiple sources

user-friendly and modern UX/UI

high quality of data

predictive analytics

access rules applied to different departments and users

time saving for Big Data processing

interactive dashboards

access to dashboards from various devices (phones, tablets, PC/Mac computers)

flexibility and high speed in modifying the dashboards

Benefits

The expanded data access and analytics capabilities provided by self-service BI benefit our customer’s company in a variety of ways:

  • Not having to assign IT resources to database ‘babysitting’ duty results in saving the team’s time and the company’s money
  • Business users have got the possibility to focus on business solutions and metrics rather than on the report generation process
  • Enriched and high quality data from many data sources ensures more qualitative insights about the client’s behavior and, as a result, allows to improve market strategy
  • Faster data analysis means faster path to insights. The generation of a report which used to take up to 4-5 hours is now available with just one click of a button. Such a quick data analysis brings greater speed to business processes and helps to avoid miscommunication among different departments. Time saving for the report generation specialists is about 280 hours a month
  • Customer Satisfaction Index has increased by 7.2% (is 85% now)

In a nutshell, the main accomplishment of the project is that it has brought our customer’s data to life and turned that data into insights for the people who need it the most, business users.

Technologies

Tableau
MySQL
PostgreSQL
Python
ERP Odoo

Business Intelligence Solution With 14 Real-Time Dashboards For a US Software Company

Business Intelligence Solution With 14 Real-Time Dashboards For a US Software Company

How adopting Power BI and crafting 14 custom company-wide and unit-specific dashboards empowered an IT company to fully automate data collection operations, save up to three days per month on report preparation, uncover and fix blind spots in their sales pipeline, increase post-clarification call conversions by 44%, and drive sales by 9,6% within just six months.

Domain:
Service Company (Software Engineering)

Team:
Power BI developers, DevOps engineers, QA engineers, Business Analyst, Software Architect, Project Manager

Challenge

An IT provider is expected to be digital by default. But it’s impossible to become digital once and for all. The best thing you can do is to keep up with a rapidly changing world by constantly developing new solutions and improving the existing ones.

Our customer’s company was growing very fast (+30% annually) and their methods of data management and analysis were getting outdated and were no longer meeting their needs. The heads of the company felt that they did not possess the entire information about the company’s state which made the management and coordination more difficult. Such a situation could slow down the company’s growth.

The management team was really fragmented in terms of understanding the current business state. Lack of up-to-date information entailed the inability to make qualitative decisions. The company’s managers needed valuable insights on how the business was functioning, what was perfectly working, and what had to be improved. It meant quick access to real-time metrics about various aspects of the company’s state and life. It included but was not limited to project metrics, engineering power (e.g. seniority levels, the number of the developers on projects, bench status if there was any), the company’s money flow, various kinds of sales order statistics, etc.

Our customer understood that Business Intelligence is not just about using technology to bring people and information together, it’s about flexible experimentation at a rapid pace and fast decisions.

Business Tasks

  • to get real-time information, which is 3 hours’ old at most
  • to speed up the decision-making process
  • to be able to analyze the work of the company’s departments
  • to change the approach to holding meetings by cutting out the part dedicated to gathering the information from the employees and sharing it among them

Technical Tasks

  • to transform and place into one storage all the business information gathered from a variety of data sources the company was used to work with. The sources were the following:
Jira Atlassian
Service Desk Atlassian
Confluence Atlassian
QuickBooks
Zoho Recruit
Zoho CRM
Closeweek
Google Sheets
  • to prepare the transformed information for the analysis: to convert it into the readable format for the system
  • to visualize data according to the rules defined by the requests of each particular dashboard and report
  • to create dashboards with a variety of visualized reports of the working processes of the following business units:

Sales & Marketing

Finance

Technical production

Human resources

Office Management

  • to implement the function of adding new metrics and reports and editing the existing ones
  • to realize the function of reports generation on schedule with notifications
  • to collaborate on and share customized dashboards and interactive reports
  • to keep data secure while giving user groups access to the insights they need

Solution

Using Power BI and cloud technologies, we’ve scaled them according to the customer’s needs. The relevant data is collected from sources, such as Jira Atlassian, Service Desk Atlassian, Confluence Atlassian, HQuickBooks, Zoho Recruit, ZOHO CRM, Closeweek, Google Sheets. Some part of this data goes straight to datasets, the other – to Azure Data Lake Storage, where all the actions described by a particular model are performed. After that, the information is presented in the dashboards. We’ve created 14 of them, which is not the final number, as, according to particular needs, the dashboards can be scaled up and down, grouped, and some derivatives can be added. Each dashboard represents an interactive analytical system and creates dozens of coherent reports with a variety of visualizations.

Our solution unifies real-time data from many sources and provides interactive, immersive dashboards for all the departments of the company: Finance, HR, Recruiting, Sales Management, Project Management, Development Units, BackOffice. Employees can easily integrate data, transform it into rich visualizations and reports, and then share those reports with stakeholders.

Key features

  • self-service for enterprise analytics
  • Azure cloud solution
  • AI integration for quick insights finding
  • Integration with in-house software

Value

With this BI solution, individual employees have self-service access to intelligence that they can slice and dice in whatever ways are most helpful to them. They’ve also got an easy way to view and share their insights through interactive visualizations. It’s become possible to automate a lot of the preparation and reporting.

We have provided the decision-makers with all the metrics they need – gathered in one place – to do their job more efficiently and not have to wrangle the data to get the answers. The company’s stakeholders, managers, and decision-makers have got an opportunity to evaluate the current state of their business in a quick and reliable way.

The company got several levels of just-in-time analytics:

  • Project reports enable Project managers to analyze different aspects of their projects and get real-time metrics. This saves days of work on preparing data.
  • Production Unit reports provide live info on metrics, KPIs, and plan/fact analysis to unit managers. This also saves 2-3 days of work per month and ensures data consistency and accuracy.
  • Top-level company reporting provides thorough analytics for main company processes. This saves months of manual work and enables data collection and analysis in a weekly cycle.

Benefits

Each Unit got their own benefits of BI introduction into business processes.

Sales department:

  • Due to continuous visualization of the sales pipeline it was defined that after the stage of “a clarification call”, a pretty big number of potential clients “go dark”.
    It took two months to prepare a fully new and unique methodology of “clarification calls” which brought the increase of conversion from this stage to the next sales step by 44%.
  • The real-time visualization of each sales manager’s KPIs allowed to identify weak points in the process of deal closing for every manager. The following actions were taken to strengthen the Sales Team:

1 /  young sales managers were mentored by the experienced ones in customly defined complicated spheres;

2 /  special sales courses were offered to some managers.

These measures allowed us to increase sales by 9,6% in the next 6 months.

Human Resources department:

  • Alignment of financial statement reporting, statutory reporting, and managerial reporting allowed to find out that the specialist of a certain proficiency level brings almost 11% less profit then specialists of other proficiency levels. It was decided to increase the amount of hiring of those specialists who bring 11% more profit to the company, rather than those who do not.

PMO:

  • Detailed project analytics enabled a lot of optimizations of the project management practices resulting in ~4% project profitability increase.

Finance department:

  • Systematic keeping control on KPIs and the ability to deliver quick financial reports to stakeholders, managers, and decision-makers allowed to identify undesirable financial expenses. The improvements made to avoid the expenses helped the company to save 84K within the next 6 months.

Office Management:

  • The continuous visibility of the department processes allowed to redistribute the forces of the existing staff and avoid hiring more people, which helped to save about 17K of potential expenses within the following half a year.

Technologies

Recommendation System For A Streaming Service Provider

Recommendation System For a Streaming Service Provider

How taking personalization to the next level by introducing an ML-powered recommendation engine allowed a European streaming provider to upsurge the number of their premium subscribers by a third in just six months.

Domain:
Media and Telecommunications

Duration:
6 months

Team:
BE Team, FE Team, QA Team, Data Scientist, SA, BA, UX/UI Designer, PM

Challenge

Navigating through an endless stream of options is insanely difficult and time-consuming. Being far too jaded, people are unlikely to pay attention to anything that doesn’t captivate them instantly. This gives entertainment businesses a hard time when ‘living up to expectations’ and ‘anticipating the desires’ are not just advertising overstatements but a real must.

Our customer understood that the only way to make their subscribers keep using the service is to whip up their interest by offering the content which appeals specifically to them.

As quality and taste are barely the same things, one-size-fits-all recommendation services seemed useless and even harmful – a couple of mistakes are enough to lose a subscriber. That’s why it was decided to create a system that would provide users with recommendations tailored to each individual.

Task

  • to identify user’s activity patterns and preferences based on their viewing experience;
  • to create algorithms that would guide the users through a vast selection of movies and TV-shows the provider offers to something that meets their individual needs.

Solution

How to deal with giving worthwhile recommendations to millions of subscribers? The answer is machine learning (ML) and algorithms.

*instinctools team has developed a system that learns from its users. It processes users’ data, for instance, the genre of a program a user is watching and adapts recommendations to his or her contemporary viewing habits.

An ML model identifies viewers’ preferences, using the statistics of their content consumption. It is based on particular algorithms – sets of databased instructions – that tell the service which content to offer.

We’ve also applied a collaborative filtering mechanism to our solution. It means that each viewer fits into certain taste groups, which are identified by plenty of factors coming together (the number of views, genre peculiarities, etc.), and this influences what recommendations are displayed. If a user’s viewing patterns are similar to another user, the system will give recommendations based on the behavior of that other user as well.

Value

The problem of choosing what to watch is no longer relevant. The system that we’ve made can sustain not only users’ current interests but also the evolution of their tastes.

The trick is that now the viewers can find captivating shows that they might not have initially thought of watching. As long as there’s no chance for the users to get bored they’ll hardly stop binging and cancel the subscription.

Furthermore, the number of subscribers is constantly increasing as people want to pay for TV-shows and movies that ‘fit in’ their vision of great content and not waste money – not to say time – on something that doesn’t.

Technologies

Python
Flask
MySQL
ML libraries

Custom BI Dashboards For The Sales Department Of a EU Corporation

Custom BI Dashboards For The Sales Department Of a EU Corporation

How the adoption of Tableau with six custom dashboards for sales analytics, planning, and forecasting empowered a manufacturing corporation to back up sales strategies with real-time data and increase the number of won deals by 54% and upselling deals by 16%.

Challenge

Our customer’s business has been expanding rapidly for the past decade: new brands have been launched, new chains have been opened, new offices have popped up. In these circumstances, without proper up-to-date instruments, following the company’s processes turned out to be a real problem. It was all the more obvious when came to the sales department. The existing methods of navigating through sales performance – with reports prepared on a monthly or quarterly basis – appeared to be ineffective and time-consuming.

Our customer wanted to improve the overall visibility of analysis and reporting activities across different business units and get a centralized view of the massive volumes of data.

Tasks

  • to bring all the business units together to have a single source of information in an integrated set of tools
  • the ability to “slice and dice” the information according to the user’s needs
  • to provide data security
  • the possibility to scale up the solution as the business grows

Solution

We’ve developed a sales performance management solution, which not only contains all the necessary data but also combines analytics, planning, and forecasting capabilities.

The complexity of the whole sales optimization process has been wrapped into 6 dashboards, integrated with different sources of information. Each dashboard fulfills its own functions.

  • A customer overview
    Contributes to building up a complete, explicit view of the customer by collecting data from contract billing, the CRM and ERP systems, so that the sales representatives can easily identify the information, which is useful for their daily sales processes and customer relationship management.
  • Sales Pipeline
    Brings visibility to all the stages of a sales process within different channels or lines of business and makes overseeing and directing future sales much more data-based than they used to be.
  • Sales process optimization
    Takes the data out of the CRM system, measures these data against the targets, showing what activities need to be done to achieve the assigned goals.
  • Salesperson focus
    Clusters the information on customer sales activity and converts it into a user-friendly format. It shows sales representatives their month-to-date and year-to-date results and how these results correlate with their objectives.
  • Account coverage
    Helps to stick to customer retention strategy through the analysis of certain KPIs.
  • Sales forecasting
    Estimates the accuracy of sales forecasts, comparing them against actual results for both individual sales representatives and the whole teams.

Key features

an integrated set of tools

self-service analysis and reporting

scalability

data security

cloud solution

Value

The BI solution allows our customer to explore the data without a hitch. Fragmented and disintegrated reports are replaced by one set of tools where all the necessary information is gathered. Thus, user groups get quick and easy access to real-time data and the analysis tailored to their needs, which increases the chances of the right decision making. The visibility that has been brought to each stage of the sales cycle along with end-to-end analytics helps managers identify blind spots and, therefore, improve the performance.

“With *instinctools solution, it’s become possible to get a complete and honest answer to the question: “How are things?” either on a unit level or on the level of the whole company. We’re happy to have accurate, up-to-date information on our sales processes and keep all our units in sync”.

Judging by enthusiastic reviews of our customer, data harmonization within the sales department was a giant step (but just the first one) on the way to digital transformation. Apparently, there’s more to come.

Technologies

React
NodeJS
Python
Tableau
AWS

Business Intelligence Solution For a US Construction Company

Business Intelligence Solution For a US Construction Company

How switching from spreadsheets to Power BI with automated reports generation and easy-to-grasp custom dashboards allowed a US-based construction company to save up to 40 hours of work per report and get a real-time 360-degree overview of project management workflows.

Challenge


Our customer’s approach to managing projects was no longer keeping up with an accelerating pace of work. The data used to be captured in various spreadsheets, which were barely efficient enough to make use of. Struggling through a bazillion of rows stuffed with data is not so great of a plan to get a powerful insight. The more difficult deciphering the data was becoming the stronger our customer was striving for a new, unconventional strategy that would help to automate generating multiple reports and transmit them to user-friendly, intuitive dashboards.

Getting on track of innovations was decided to start with a Project Management Unit as it more than any other company’s units experienced problems due to obsolete solutions. Project managers had difficulties predicting how many new contracts they could expect and, as a result, their workforce levels were not always optimized. Answering simple questions on workforce numbers or seasonal trends turned into a big deal since it required handling a number of dense, indistinct spreadsheets.

“We can’t let our progress be limited by out-of-date solutions. Especially, when BI is almost on everybody’s A-list”

Tasks

  • to provide architecture design for software modernization roadmap
  • to set up cloud data storage
  • to configure data pipelines for the first stage of modernization and make it possible for managers to get high-level data reports
  • to create custom dashboards showing the most profitable projects by regions / seasons / contracts, which earn below-average revenue, etc.
  • to demonstrate project management workflows and cash flows way, trendlines, and predictions

Solution

*instinctools has developed a business intelligence system, allowing project managers within our customer’s company to painlessly analyze automatically generated and categorized information, and switch from a project’s quick overview to tracking all the necessary details.

To make data visualizations and custom metrics as helpful as they could possibly be, it was crucial to start data integration from different systems to single online storage. Power BI technology seemed to be a perfect fit in this case since it can integrate data from a variety of sources and deliver it straight to users in the form of reports and dashboards.

Our team has designed dashboards that, among other things, help:

see trends by area, timeframe, and job types;

clarify the reasons for contract breakdowns;

define average monthly workforce levels.

Key features

  • Single cloud storage
  • Automatic data aggregation and transformation
  • Dashboards
  • Data storytelling
  • Data exception report

Value

The implemented BI system enables project managers to make data-driven decisions about contracting and workforce levels and helps to keep projects on time and on budget.

Without the necessity to manually enter data into spreadsheets, the company saves up to 40 hours of work per report. The time gained thanks to the newly acquired system can now be spent on more challenging tasks. Having a clear view of the data in their projects at hand, project managers can easily spot new opportunities for optimization and increase the number of winning bids.

Well, that’s just a start. This project is the first step on the way to a deep modernization process in the company.

Technologies

Python
Power BI+DAX+Power BI Dataflows
Azure SQL Database

EdTech Mobile App

EdTech Mobile App

How developing a mobile learning app with an ML-powered recommendation engine to provide each student with a relevant mentor empowered a US startup to set a foundation for a future educational ecosystem and increase students’ engagement by 43%.

Challenge

The customer was looking for an IT partner – a technological and methodological expert who could help not only to create the product but also would assist in its market entry strategy. The idea was to develop an ecosystem which would fulfil the following functions:

  • giving everyone an opportunity to get a full-fledged academic education;
  • giving a possibility to get competencies that are in demand through the concept of bite-sized learning;
  • providing recruiters with access to the app so that they could estimate students’ competencies and soft skills at an early stage and make a decision about interviewing the candidates.

Tasks

Having a good idea, the customer, however, didn’t have any preliminary developments or a mere vision of how this idea can be embodied. The project was vague in terms of the interim goals, requirements, and technologies. Therefore, our team got a vast area of responsibility: we had to work out the vision and the business case of the product, deliver the design and, all in all, take part in the development as product owners.

As a part of a 3-day Pre-Discovery Workshop, our team dealt with the customer’s questions that had been piling up, plunged into their business context and aims, and, thus, together with the customer we prioritized the queries, built the plan and defined the scope of work for the next stages.

The app was supposed to be the first fragment of the future ecosystem and was expected to:

  • help the students get the necessary information in a particular domain;
  • help the students choose people who might become their mentors;
  • have a motivational constituent for the users who can be mentors.

Team

A line-up always matters but it becomes of vital importance on projects characterized by a high level of ambiguity. In order to ensure the optimal communication from the very beginning, we provided the customer with a wide range of team roles who are highly qualified experts specialized in solving particular classes of tasks: Business Analyst, UX/UI designers, Backend Tech Lead, Data Scientist, Solution Architect and Project Manager.

Solution

During the Discovery Phase we developed the solution which implied:

  • the possibility to publish the materials on the app and share them with other students;
  • chat functions, enabling students to interact with each other;
  • a machine-learning model which takes into account the views of learning materials, other users, “likes”, etc. and, based on this information, recommends the most relevant mentors;
  • the content management functionality;
  • the system of rewards with gamification elements and a gradual immersion of the user into the platform.

Key features

machine-learning module

chat functionality

Value

In the result of close collaboration with the customer, *instinctools team has created a mobile application which provides access to all sorts of educational materials and allows to get consultations from people, whose career is a matter of interest for the users. Moreover, our company has gained excellent experience in developing recommendation systems that seek to predict the “rating” or “preference” a user would give to an item. Being welcomed in a variety of areas by giants such as Netflix, YouTube, Amazon etc., the benefits of these systems are now available for *instinctools clients.

Technologies

Mobile Staff Management Platform For a Danish Company

Mobile Staff Management Platform For a Danish Company

How launching a mobile platform for briefing and training the non-desk employees empowered a Danish company to bridge the gap between the head office and the shop floor, speed up onboarding by 11%, and boost staff engagement by 13%.

Remote briefing and training service

Lack of two-way conversation between head office and the shop floor is bad for business. Stuff should be always engaged with personalised, relevant information. Such engagement motivates staff by defining their role in product launches.

To cover enterprise needs on all levels, solution should:

  • Broadcast targets to end point employee
  • Be reachable everywhere
  • Track their reaction and feedback in real-time
  • Have support for pep talks
  • Broadcast work/decision results to all team/company members

Challenge

  • Solution should be cross platform and work on enormous device models in the same manner
  • Solution should be available 24/7
  • No downtimes is allowed
  • High load expected

Solution

C0F90649-DCBA-4040-9CC5-B72EFCE1CB45Created with sketchtool.

Node.js as main platform

78FC13DA-BB97-468C-85FB-F70C775A0981Created with sketchtool.

Advanced caching with Redis

F200465C-D304-4CFC-935C-206BB87ABEEDCreated with sketchtool.

Clustering

Technologies

PHP
NodeJs
Angular
Python
MySQL
Anna Vasilevskaya
AI modified real photo
Anna Vasilevskaya
Account Executive

Get in touch

Drop us a line about your project at
[email protected] or via the contact
form below, and we will contact you soon.