Legal Cryptocurrency Exchange Service in LATAM

Trailblazing Legal Cryptocurrency Exchange Service

How the development of a custom-built, legally compliant cryptocurrency exchange enabled a fintech company to launch regulated crypto trading in LATAM, secure partnerships with regional banks, and successfully pass an independent Ernst & Young audit, ensuring robust security, privacy, and compliance controls.

Industry:
Fintech, Cryptocurrencies

Custom Software Development

Blockchain

Business challenge

Digital assets have become an important part of the global economy. Yet, they still oftentimes function in the gray zone due to the lack of convenient tools within the legal field. Indeed, authorities around the world have been grappling with the question of how to respond to cryptocurrencies.

In LATAM, regulatory approaches varied by country:

  • Brazil and Chile advanced licensing/perimeter rules
  • Mexico imposed strict limits on regulated financial institutions’ virtual-asset activity
  • Colombia relied more on pilots/sandbox initiatives and proposed legislation

This encouraged our client, a fintech company, to leverage the situation in the region. The idea was to develop an efficient and secure solution, which would allow the users to make cryptocurrency transactions legally and transparently.

Tasks

  • Build a solution independent of third-party exchange engines
  • Design user and admin interfaces for daily operations
  • Develop a full-featured backend with banking and payment integrations
  • Ensure compliance with LATAM crypto regulations, including local VASP rules
  • Align KYC and AML flows with FATF recommendations and regional laws
  • Meet card network and banking partner requirements

Solution

Thanks to a gripping business idea and meticulous, high-quality work on its embodiment, *instinctools team has managed to develop a completely legal and regulated cryptocurrency exchange service, which embraces the following key features:

A full-fledged backend solution with two frontend client modules for users and administrators

Automated interaction with the user, incorporating exchange rate offers, submission of applications, and deposits and withdrawals

Automatic processing of user data at the verification stage - from the moment the documents are uploaded to KYC procedure and AML check

Redundancy storage of user and transaction data, access control

Unique, ‘from scratch’ design

DevOps:

  • highly reliable and scalable solution based on Amazon Web Services (AWS)
  • optimized usage of in-house and rented nodes.

Control panel for the administrator with:

  • manual and automatic exchange rate management
  • possibility to choose the rate - the bigger the amount of money you’d like to exchange the lower commission you pay
  • differentiated work with VISA cards, depending on countries, status, issuing banks
  • direct work with system crypto wallets
  • interaction with users in terms of tech support
  • exporting reports according to the regulator’s and business requests
  • notification system for the administrator about the work of the service and emergencies

Integrations:

  • direct integration with blockchains
  • direct integration with the payment system
  • refinement of the tech solution on the part of the bank and Bank Processing Center
  • customized CRM, specifically adapted to meet the regulator’s requirements: integration into the service of the compliance department and integration into customer support
  • integration with the identification service, including automated document recognition, authentication, export to CRM
  • integration with services on cryptocurrency financial control
  • integration with liquidity providers, which allows getting optimal rates, hedge deals, and balance liquidity

Focus on compliance with the regulatory context in LATAM

Our dedicated team treated compliance as a core design principle from day one. The cryptocurrency exchange is aligned with:

  1. Local VASP registration and reporting requirements in key LATAM markets
  2. FATF Travel Rule-ready data exchange flows where required by local regulation and counterparties
  1. Country-specific AML/CTF requirements and supervisory guidance (Brazil’s AML/CTF obligations for VASPs under the post–Virtual Assets Act framework; Mexico’s constraints and authorization model for regulated entities’ virtual-asset operations)
  2. Data protection controls adjusted to national privacy laws in each operating country (data minimization, retention, access control, audit trails, breach handling)

This approach enabled the client’s solution to scale across multiple LATAM countries with minimal legal friction.

Ernst & Young Audit

An independent audit by Ernst & Young confirmed that the exchange’s control environment, covering security, privacy, and compliance, met the agreed criteria. This included a thorough assessment of AML/CTF controls, which were found to align with FATF standards where applicable.

Business value

  • Fast market entry in multi-regulated LATAM jurisdictions
  • Strong trust from banks, regulators, and end users
  • Reduced compliance risk through automated controls
  • Scalable foundation for further regional expansion

Intelligent Vending Software

BI SOFTWARE FOR A LARGE EUROPEAN VENDING MACHINE PROVIDER

How a company increased turnover by 9% by implementing BI and reducing the lost-sales rate.

Industry:
Retail, Manufacturing

Business Challenge

Our client is a famous European retail company providing vending machines under various cooperation models, including selling, leasing, and more. As their business grew, they needed to increase their technological capabilities to make decisions faster, based on qualified data, and work even more effectively.

Our client’s existing solution didn’t meet these scalability and business efficiency requirements. Having more than 1000 vending machines operating across 50+ cities, they didn’t have a single point of truth and qualitative data for analysis, forecasting, and decision-making.

They needed their core units to be “on the same page” and wanted:

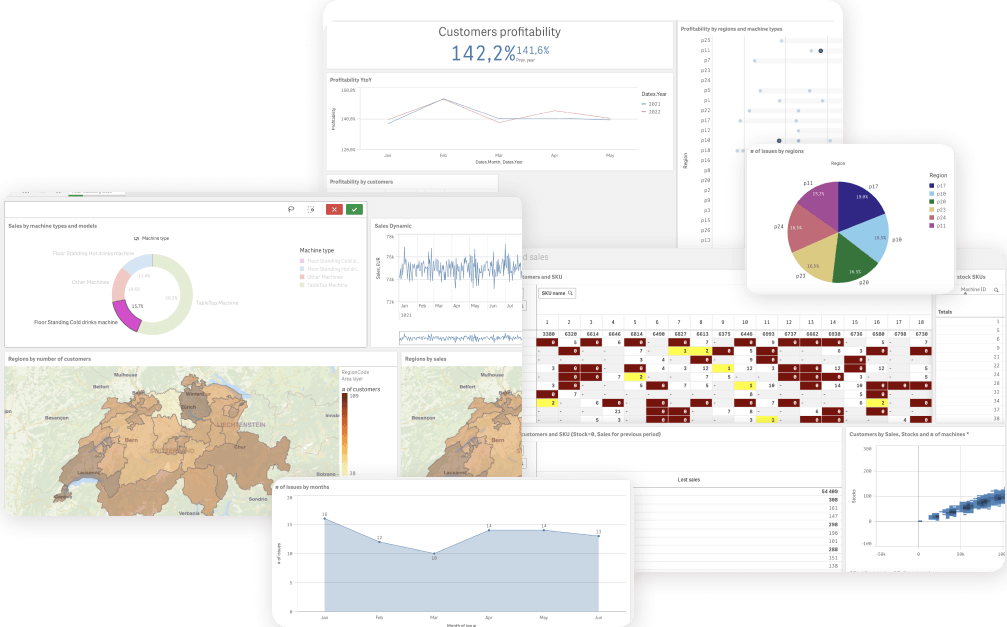
  1. Decision-makers in Top management and Sales to have all company data at hand anytime with visualized information about vending machines operation, maintenance, and sales by region/country, including margin rates and issues reports.
  2. Supply management and Machine Service employees to be aware of and timely respond to any technical issues, see relevant data to replenish stocks, and make purchases in a timely manner.

The current corporate solution needed significant functional improvements and technical gain as the client was committed to growing and scaling to new markets in Europe and United States. That’s why they addressed *instinctools for augmented technical expertise in business analysis, consulting, and business intelligence software development.

Solution

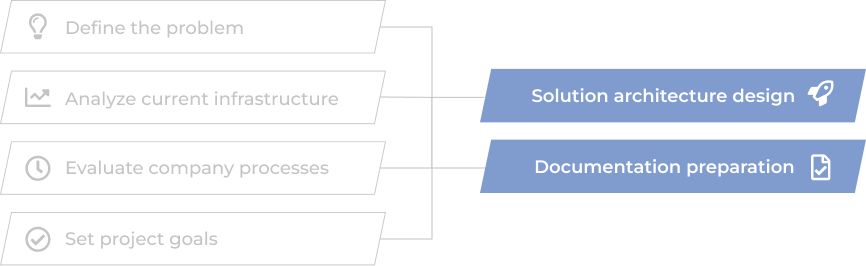
Step 1
Consulting and Discovery phase

No project starts without clearly defined terms of reference. To define them, we began by asking the right questions and answering the client’s questions.

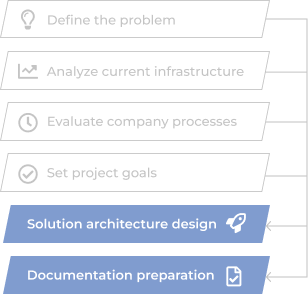
After reaching a mutual understanding of problem definition, current system infrastructure analysis, processes evaluation, and project goals, we started to design and build solution architecture and prepare necessary documents for successful project implementation within the discussed timeline.

Step 2
Data warehouse creation and first dashboards release

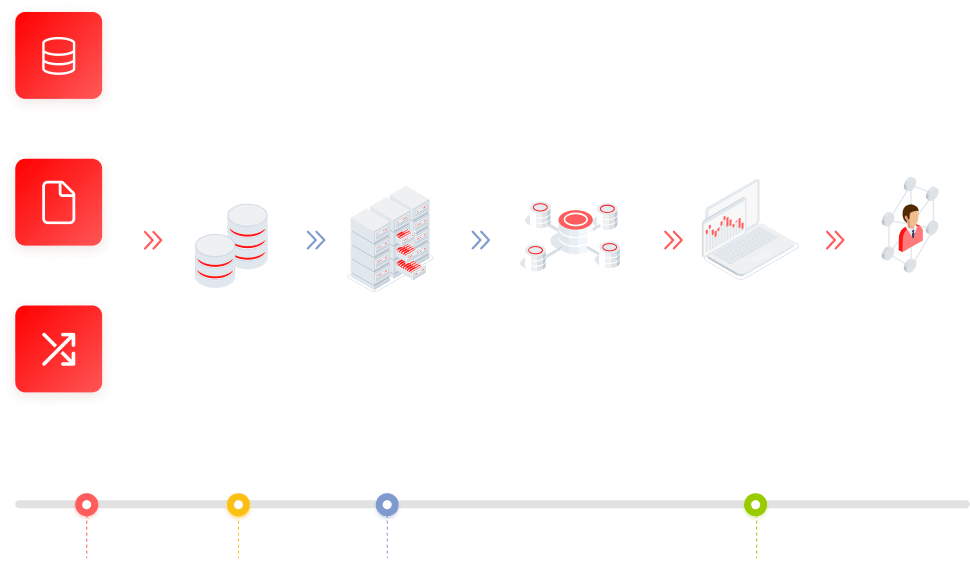
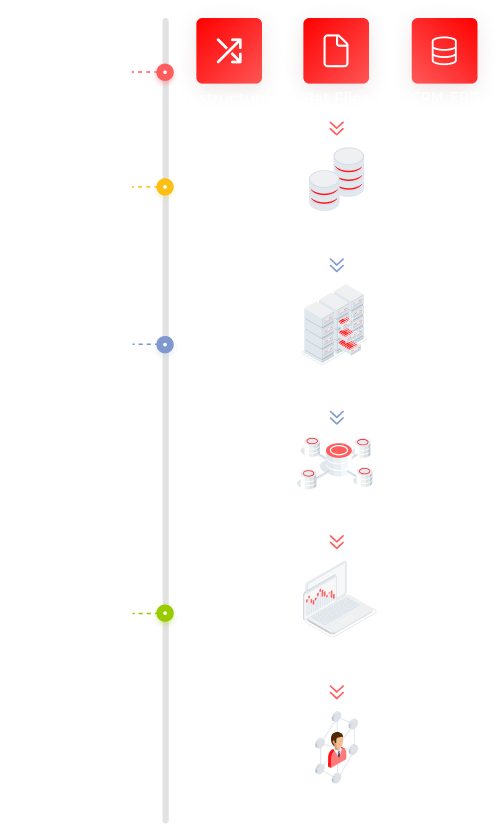
Our data engineers organized proper ETL processes to connect data from corporate data sources (CRM, ERP, Excel files, and others) to a newly built data warehouse.

Even before the warehouse storage was fully organized with all company data, we crafted the first reports and dashboards based on newly gained data. Our client got the opportunity to evaluate the benefits of data visualization two weeks after the project started.

Receiving the feedback from dashboards’ actual users, we made timely and high-quality changes at the development stage.

Faster delivery and better development

High-quality changes based on the usage feedback

Continuous improvement

Step 3
Project release and data analysis

The core of delivering a quality product is understanding its users and their needs. The final step of our project was the review and BI software access distribution across the company according to its designated users.

More importantly, the established relationships between our development team, product stakeholders, and decision-makers allowed us to promptly react to the feedback and upcoming issues, making high-end improvements to the system.

Before

  • Disparate analysis and no single data storage solution
  • Existing software doesn’t allow for tracking sales margin across regions
  • Sales reports creation takes up to four working hours
  • Hard to estimate data quality
  • Stock management needs to be organized to provide more structured data
  • Not enough technical capabilities to make forecasts and intelligent data analytics

After

  • Data stored in one place opens up opportunities for complex analysis
  • Visible sales margin
  • Reports are generated automatically or created per request
  • High-quality data and transparency in operations
  • Stock managers get full control over stock turnover and timely purchases
  • Top managers use smart analytics daily to make data-driven decisions and predict sales

Key features

Flexibility

A user-friendly BI system allows configuring the necessary filters for data groups, defining data ranges, and displaying them on dashboards.

Scalability

The dashboards and datasets analytics can be scaled to be used in other units, e.g., Marketing, Accounting, Administration, and Operations.

Accessibility

Business intelligence software is accessible via mobile, web, tablet, and desktop devices.

Business Value

  • The client renegotiated low-margin contracts with customers
  • The number of lost sales was reduced by 30%.
  • Total turnover increased by 9% in 6 months.
  • The downtime of broken vending machines was reduced to a very minimum.

Multiplier Effect​

The expertise employed in this project can be applied to similar projects in retail, hospitality, sharing economy fields, and others.

Odoo On-Premise Implementation For a European Streaming Platform

Odoo On-Premise Implementation For a European Streaming Platform

How replacing outdated software with Odoo ERP and custom BI tools allowed a streaming service provider to implement a monthly billing model, get a 360-degree view of their customer data, save 1000+ hours of manual operations on inventory management, and bring thousands of new customers to the platform all over the EU.

Industry:
Media and Telecommunications

Duration:
12 months

Team:
a project manager, two business analysts, a UX designer, a solution architect, four backend and four frontend developers, four quality assurance specialists, and a business intelligence consultant

Context

Any company’s growth brings opportunities for investment and new market outreach, and entails a transformation of business processes, operations, IT infrastructure, etc. Experiencing a significant rise in customers, our client decided to improve their subscription-based business model, allowing their end-users worldwide to be billed for IP television services on a monthly basis, not annually as it had been before.

The introduction of such a seemingly simple change in the subscription model required a significant transformation of current business processes, which also led to the implementation of a corporate ERP system. The company got in touch with *instinctools for IT consultancy to find a solution and for ERP system development to run their business more effectively and quickly adapt to ever-changing market needs.

The main goal for our team was to advise on and implement an ERP system that would match the company’s existing business processes, taking into account growth plans. Another essential requirement was choosing an ERP system that was easy to maintain and develop in terms of cost and availability of specialists.

During the Pre-Discovery workshop, our team analyzed a current client’s business model and suggested a best-fit solution. The customer’s key non-functional requirements for an ERP software were the following: an on-premise solution that can be managed on company servers, free licensing, fault tolerance, and customer support. Implementing the solution as soon as possible was vital, as they needed to handle an ever-increasing array of data.

*instinctools provided a detailed project estimate with a scope and vision of the future ERP solution as a primary output of the workshop. After a thorough analysis, our experts suggested implementing the Odoo ERP system. Here are a few reasons why we’ve chosen Odoo, alongside the fact that it ultimately met the client’s requirements mentioned above:

  • Multiple module integration. The Odoo system has a broad set of features and modules ready for customization according to any department’s needs.
  • Odoo is among the leading ERP solutions in the market with a huge community and app store.
  • Odoo fits small and medium businesses bringing them high flexibility and scalability.

Dedicated team

To successfully complete the project within the time frame set by the customer, *instinctools gathered a dedicated cross-functional self-managed team able to implement the project end-to-end. The project’s dedicated team consisted of: a project manager, two business analysts, a UX designer, a solution architect, four backend and four frontend developers, four quality assurance specialists, and a business intelligence consultant. The right composition and skill set made it possible to implement the project within the required timeframe.

Challenge

When implementing new IT solutions, companies usually face many challenges in operations and processes, not just purely tech issues. Our customer collaborated closely with the *instinctools dedicated team, allowing them to focus mainly on IT challenges and some organizational issues.

  • Data migration

    The data about users’ quantity was one of the unknowns in the first stages of the project estimate. It complicated the process of data migration to the new system, as the actual number of users (internal and external) was much bigger than the pre-estimated. As a result, we had hurdles with the performance of certain system operations and needed to react quickly to changing requirements and other issues.

  • Odoo modules integration and customization

    One of the benefits of the Odoo ERP system is the variety of modules for different units, operations, and management. The choice of the modules for particular business needs wasn’t as challenging as their integration into the current system. Most essential components needed customization and adjustments that our engineering team managed to implement.

  • Data visualization and reporting

    Companies not using an ERP system may lack data visualization and fast reporting available for different units. With the growing amount of data and the length of Excel spreadsheets, the implementation of Business Intelligence became a necessity for our client. The standard Odoo module didn’t meet the client’s data visualization and reporting requirements. We needed to build a BI tool and enable its connectivity and accessibility within different units.

  • Integration with third-party services

    The last but not the least important challenge for our dedicated team was integrating the Odoo ERP system with the services, enabling the sustainability and smooth operation of the whole business machine, from notifications and stock management to acquiring systems and legal resources.

Solution

Instinctools’ dedicated team, working closely with the customer’s IT and Operations departments, was able to implement a holistic ERP system, connect all the necessary integrations, and develop and set up the required Odoo modules. It fully met the demand for sustainable and scalable software solutions that are compatible with internal and external services, running on on-premise servers, having fast reporting and visualized analytics, and ensuring reduced costs on the maintenance and support side.

With this solution, we helped our client achieve its primary goal, the upgrade of a subscription model provided to their customers.

Key features

  • Customized Odoo modules for stock management, logistics, accounting, legal operations, and marketing analytics.
  • Internal integrations with Google Analytics, e-mail services, and notification systems.
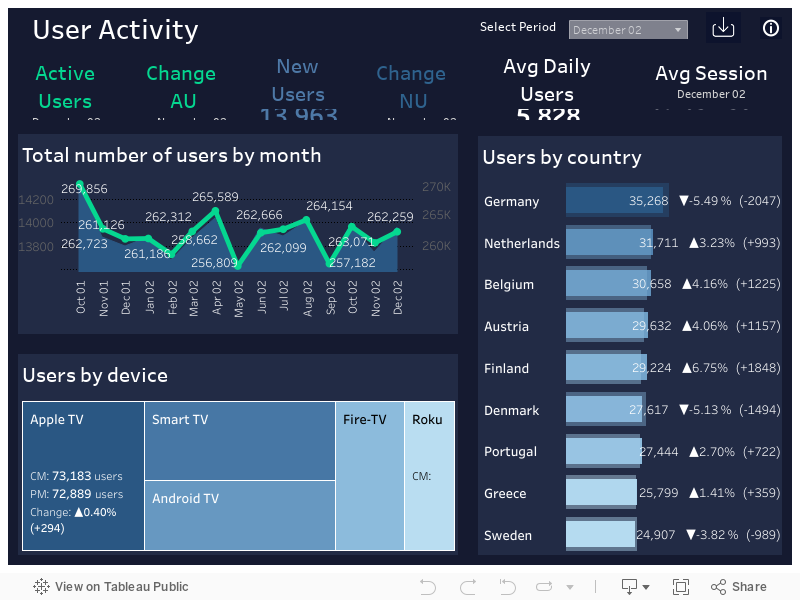
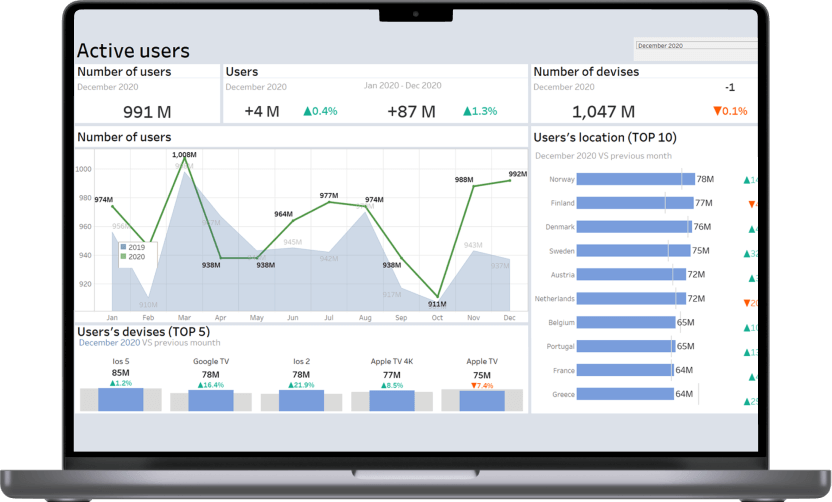
  • Tableau business intelligence tool with distributed access for all units and fast reporting.
  • External integrations with DHL, Hermes, NevelNet, Stripe, and other services.
  • Sepa acquiring system.
  • DATEV-format reports compliant with the law for tax authorities.
  • Odoo Website SSO (Single Sign On) module.

Business Value

Thousands of new customers have tried the monthly subscription service offered by our client since the first project solution release. It allowed the company to understand their customer’s pains and needs better while interacting with the product and services. That, in turn, helped to deliver value and improve customer experience.

We revealed the hidden issues in our client’s company’s complex processes and operations during the project implementation. They noticed the flaws of the old system that had been holding the company back from innovations and opportunities to scale faster and increase clientele worldwide for a very long time.

The client’s digital transformation became the enabler of positive changes bringing their business more revenue, new market opportunities, and, most importantly – customer loyalty.

Technologies

React
Python
keycloak
Odoo Material UI
Tableau

Tableau Implementation For a EU Streaming Service

Tableau Implementation For a EU Streaming Service

How replacing Excel spreadsheets with interactive BI dashboards empowered a media-services provider to reimagine their data processing, reduce the cost of data management-related IT tasks by 27%, save 280 hours a month on report generation, and boost Customer Satisfaction Index by 7.2%.

Domain:
Media and Entertainment

Duration:
4 months

Budget:
$50.000

Challenge

The growing amount of business data not only made data processing and reporting within our customer’s company slow but also diminished trust in data quality.

In order to stand apart from the competition, reduce costs, and increase profits, a company must make intelligent decisions – decisions based on trustworthy and relevant data. This is exactly where BI comes in useful.

However, with traditional BI tools and processes, the IT department controls access to analytics data and does the data analysis work for business users. And as much as our customer craved for BI analytics instead of wasting an embarrassing amount of time copying and pasting things into excel, they were not really happy with the idea to operate in a highly controlled environment, where analysts or the IT team maintain access to data. It seems fairly rational since high dependency of business users on an IT department is time-consuming – waiting for the required reports may take up to several days – and really costly – the maintenance of an IT team is high so it’s better to free them from routine data capture and reporting and let them concentrate on high-level priorities.

Anyway, our customer reasonably believed that – here comes their quote – “data reporting and analysis should not be this hard” and hoped to make the in-depth analysis more user-friendly, so that everyone in a company could generate their own actionable insights, modifying the reports and dashboards without a hitch.

Tasks

The key goal was to optimize the decision-making across the company within a business intelligence environment. To reach that, the following tasks were set:

  • to increase flexibility and speed in report generation
  • to ensure consistency and high quality of data in the context of its constant growth
  • to have access to reports anytime and anywhere
  • to give users a single source of truth
  • to decrease the dependency on the IT department

Solutions

To enable non-technical users to get insights into the data without relying on IT staff and, thus, speed up decision-making, self-service BI was decided to be deployed.

While working on the project, *instinctools team had to overcome a number of issues such as corrupted data, multiple data sources, terabytes of data to update, calculate and analyze, etc.

Nevertheless, we’ve managed to implement and integrate a self-service BI solution based on a visual analytics platform (Tableau), that fully meets the customer’s diverse requirements.

Thanks to self-service BI and Instinctools training program for business users, the employees can independently create ad hoc analyses specially addressing their particular needs. They are also able to modify the existing dashboards by themselves, easily adding metrics or KPIs that need to be tracked. On top of that, from now on all the data required for dashboards is prepared, integrated, and stored in a single data warehouse, which limits the pressure and workload on data management.

If there is still a need in adding new data sources and modifying the data models, adding new custom dashboards – instinctools team stays in touch to provide the required customer support.

Features

ETL (Extract, Transform, and Load) - an automated process of blending data from multiple sources

user-friendly and modern UX/UI

high quality of data

predictive analytics

access rules applied to different departments and users

time saving for Big Data processing

interactive dashboards

access to dashboards from various devices (phones, tablets, PC/Mac computers)

flexibility and high speed in modifying the dashboards

Benefits

The expanded data access and analytics capabilities provided by self-service BI benefit our customer’s company in a variety of ways:

  • Not having to assign IT resources to database ‘babysitting’ duty results in saving the team’s time and the company’s money
  • Business users have got the possibility to focus on business solutions and metrics rather than on the report generation process
  • Enriched and high quality data from many data sources ensures more qualitative insights about the client’s behavior and, as a result, allows to improve market strategy
  • Faster data analysis means faster path to insights. The generation of a report which used to take up to 4-5 hours is now available with just one click of a button. Such a quick data analysis brings greater speed to business processes and helps to avoid miscommunication among different departments. Time saving for the report generation specialists is about 280 hours a month
  • Customer Satisfaction Index has increased by 7.2% (is 85% now)

In a nutshell, the main accomplishment of the project is that it has brought our customer’s data to life and turned that data into insights for the people who need it the most, business users.

Technologies

Tableau
MySQL
PostgreSQL
Python
ERP Odoo

Business Intelligence Solution With 14 Real-Time Dashboards For a US Software Company

Business Intelligence Solution With 14 Real-Time Dashboards For a US Software Company

How adopting Power BI and crafting 14 custom company-wide and unit-specific dashboards empowered an IT company to fully automate data collection operations, save up to three days per month on report preparation, uncover and fix blind spots in their sales pipeline, increase post-clarification call conversions by 44%, and drive sales by 9,6% within just six months.

Domain:
Service Company (Software Engineering)

Team:
Power BI developers, DevOps engineers, QA engineers, Business Analyst, Software Architect, Project Manager

Challenge

An IT provider is expected to be digital by default. But it’s impossible to become digital once and for all. The best thing you can do is to keep up with a rapidly changing world by constantly developing new solutions and improving the existing ones.

Our customer’s company was growing very fast (+30% annually) and their methods of data management and analysis were getting outdated and were no longer meeting their needs. The heads of the company felt that they did not possess the entire information about the company’s state which made the management and coordination more difficult. Such a situation could slow down the company’s growth.

The management team was really fragmented in terms of understanding the current business state. Lack of up-to-date information entailed the inability to make qualitative decisions. The company’s managers needed valuable insights on how the business was functioning, what was perfectly working, and what had to be improved. It meant quick access to real-time metrics about various aspects of the company’s state and life. It included but was not limited to project metrics, engineering power (e.g. seniority levels, the number of the developers on projects, bench status if there was any), the company’s money flow, various kinds of sales order statistics, etc.

Our customer understood that Business Intelligence is not just about using technology to bring people and information together, it’s about flexible experimentation at a rapid pace and fast decisions.

Business Tasks

  • to get real-time information, which is 3 hours’ old at most
  • to speed up the decision-making process
  • to be able to analyze the work of the company’s departments
  • to change the approach to holding meetings by cutting out the part dedicated to gathering the information from the employees and sharing it among them

Technical Tasks

  • to transform and place into one storage all the business information gathered from a variety of data sources the company was used to work with. The sources were the following:
Jira Atlassian
Service Desk Atlassian
Confluence Atlassian
QuickBooks
Zoho Recruit
Zoho CRM
Closeweek
Google Sheets
  • to prepare the transformed information for the analysis: to convert it into the readable format for the system
  • to visualize data according to the rules defined by the requests of each particular dashboard and report
  • to create dashboards with a variety of visualized reports of the working processes of the following business units:

Sales & Marketing

Finance

Technical production

Human resources

Office Management

  • to implement the function of adding new metrics and reports and editing the existing ones
  • to realize the function of reports generation on schedule with notifications
  • to collaborate on and share customized dashboards and interactive reports
  • to keep data secure while giving user groups access to the insights they need

Solution

Using Power BI and cloud technologies, we’ve scaled them according to the customer’s needs. The relevant data is collected from sources, such as Jira Atlassian, Service Desk Atlassian, Confluence Atlassian, HQuickBooks, Zoho Recruit, ZOHO CRM, Closeweek, Google Sheets. Some part of this data goes straight to datasets, the other – to Azure Data Lake Storage, where all the actions described by a particular model are performed. After that, the information is presented in the dashboards. We’ve created 14 of them, which is not the final number, as, according to particular needs, the dashboards can be scaled up and down, grouped, and some derivatives can be added. Each dashboard represents an interactive analytical system and creates dozens of coherent reports with a variety of visualizations.

Our solution unifies real-time data from many sources and provides interactive, immersive dashboards for all the departments of the company: Finance, HR, Recruiting, Sales Management, Project Management, Development Units, BackOffice. Employees can easily integrate data, transform it into rich visualizations and reports, and then share those reports with stakeholders.

Key features

  • self-service for enterprise analytics
  • Azure cloud solution
  • AI integration for quick insights finding
  • Integration with in-house software

Value

With this BI solution, individual employees have self-service access to intelligence that they can slice and dice in whatever ways are most helpful to them. They’ve also got an easy way to view and share their insights through interactive visualizations. It’s become possible to automate a lot of the preparation and reporting.

We have provided the decision-makers with all the metrics they need – gathered in one place – to do their job more efficiently and not have to wrangle the data to get the answers. The company’s stakeholders, managers, and decision-makers have got an opportunity to evaluate the current state of their business in a quick and reliable way.

The company got several levels of just-in-time analytics:

  • Project reports enable Project managers to analyze different aspects of their projects and get real-time metrics. This saves days of work on preparing data.
  • Production Unit reports provide live info on metrics, KPIs, and plan/fact analysis to unit managers. This also saves 2-3 days of work per month and ensures data consistency and accuracy.
  • Top-level company reporting provides thorough analytics for main company processes. This saves months of manual work and enables data collection and analysis in a weekly cycle.

Benefits

Each Unit got their own benefits of BI introduction into business processes.

Sales department:

  • Due to continuous visualization of the sales pipeline it was defined that after the stage of “a clarification call”, a pretty big number of potential clients “go dark”.
    It took two months to prepare a fully new and unique methodology of “clarification calls” which brought the increase of conversion from this stage to the next sales step by 44%.
  • The real-time visualization of each sales manager’s KPIs allowed to identify weak points in the process of deal closing for every manager. The following actions were taken to strengthen the Sales Team:

1 /  young sales managers were mentored by the experienced ones in customly defined complicated spheres;

2 /  special sales courses were offered to some managers.

These measures allowed us to increase sales by 9,6% in the next 6 months.

Human Resources department:

  • Alignment of financial statement reporting, statutory reporting, and managerial reporting allowed to find out that the specialist of a certain proficiency level brings almost 11% less profit then specialists of other proficiency levels. It was decided to increase the amount of hiring of those specialists who bring 11% more profit to the company, rather than those who do not.

PMO:

  • Detailed project analytics enabled a lot of optimizations of the project management practices resulting in ~4% project profitability increase.

Finance department:

  • Systematic keeping control on KPIs and the ability to deliver quick financial reports to stakeholders, managers, and decision-makers allowed to identify undesirable financial expenses. The improvements made to avoid the expenses helped the company to save 84K within the next 6 months.

Office Management:

  • The continuous visibility of the department processes allowed to redistribute the forces of the existing staff and avoid hiring more people, which helped to save about 17K of potential expenses within the following half a year.

Technologies

Multi-Module School Transportation Solution

Multi-Module School Transportation Solution

How developing a multifunctional app for students’ safety with real-time location tracking, notification system, in-app messages and voice calls, and other top-tier capabilities improved security and efficiency of school transportation management.

Domain:
Education, Automotive

Expertise:
Web/Mobile development

Team:
30 specialists

Duration:
approx. 2 years

Project description

A multifunctional application (Web/iOS/Android) for school enabling communication between several stakeholders: staff members, students, parents and external transportation service providers (bus drivers and transportation managers).

Challenge

Understanding customer’s pains and goals we defined the following objectives that the final product should solve:

Optimize and simplify the process of students’ transportation

Provide information sharing and communication between stakeholders in a more fast and convenient way

Thus the main requirements to the multi-module application were set:

Mobile notifications of multiple school events via location

Possibility of planning and tracking the transportation of students

Communication between the staff members and other stakeholders like students, parents and contracted external service providers

Dedicated Apps for mobile phones (Android and iOS), the corresponding web interfaces and the needed backend service logic

Task

The main task set for the *instinctools team was to design and develop multipurpose management system with applications integrated with iSAMS, DAKS systems. 30 specialists in the software development, the architecture and the project management were employed in a turnkey project development.

Solution

The final result was delivered as cloud solution including a web part for staff members and mobile apps for students, parents and drivers with the set of features based on logged in user role. It also includes third-party systems integration and has a range of functional features:

Key features

iOS/Android applications for students, parents, school staff and drivers

In-app messages and voice calls with several parties involved

Transportation Web-dashboard (routes, drivers and buses management and communication)

Events/actions history accessible anytime

One-click check-in/out for users

Map localization of students

Data storage & synchronization (The app can be used in an offline mode and the data will be saved and synched after connection is back)

Alarm system sending fire/lockdown alarm signals to recipients

Assistance request option in case of emergency

Notification system (personal and mass-notifications of bus delays, accidents, student absence, and other events/actions)

Value

The final solution brings special value to every participant and system as a whole.

  • Drivers now can manage their routes and notify Transportation Managers about breakdowns or incidents through delay announcements, alarms and voice calls.
  • Any user in case of emergency situations can quickly communicate via voice calls to get some help.
  • Since the security of children is one of the most important points, the parents now have the ability to track their children location and receive notifications of any emergencies.
  • All school updates, changes in the schedule, delays in transportations, emergency signals and other options available in these apps facilitate communication and information exchange between parties.

Technologies

Front-End:

IOS:

Integrations with external systems:

Android:

Front-End:

Anna Vasilevskaya
AI modified real photo
Anna Vasilevskaya
Account Executive

Get in touch

Drop us a line about your project at
[email protected] or via the contact
form below, and we will contact you soon.