Rewiring Inventory For an Eyewear Manufacturer
And Retailer
How replacing an overpriced SaaS inventory system with a custom, feature-rich IMS enabled a French eyewear manufacturer and retailer to double the RFID scanning speed and accelerate tag verification x3.
Industry:
Ecommerce
Enterprise Automation
Software Product Development
Data Visualization
Business challenge
Retail companies know better than anyone that inventory is a part that can make or break your business’s success. Understocking at critical times and locations can lead to dissatisfied customers. Meanwhile, maintaining a large stockpile brings its own challenges, including storage and insurance costs, the hazards of spoilage, theft, and damage. The ability to strike the balance between having ‘too much’ and ‘not enough’ hinges on inventory management. That’s why it’s critical to take care of its accuracy, transparency, and sustainability.
However, despite the abundance and diversity of ready-made inventory products, finding the one that fits your budget and completely fits your needs is still tricky. For companies that strive for flexibility and full control over the inventory management system (IMS), custom software development is more likely to be the best bet.
Getting inventory in order was the ultimate goal of our client – a French eyewear manufacturer and retailer. It was their fourth project with *instinctools – our team had previously developed several applications for the client’s ecommerce ecosystem.
Their inventory processes were already automated and relied on barcode and RFID scanners, but the SaaS software the client used was costly and feature-limited, failing to cover the company’s operational needs.
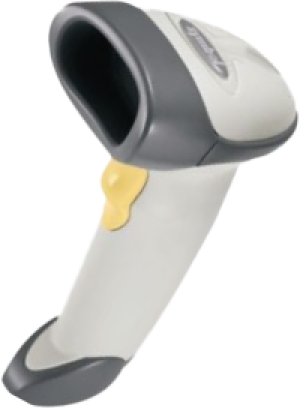
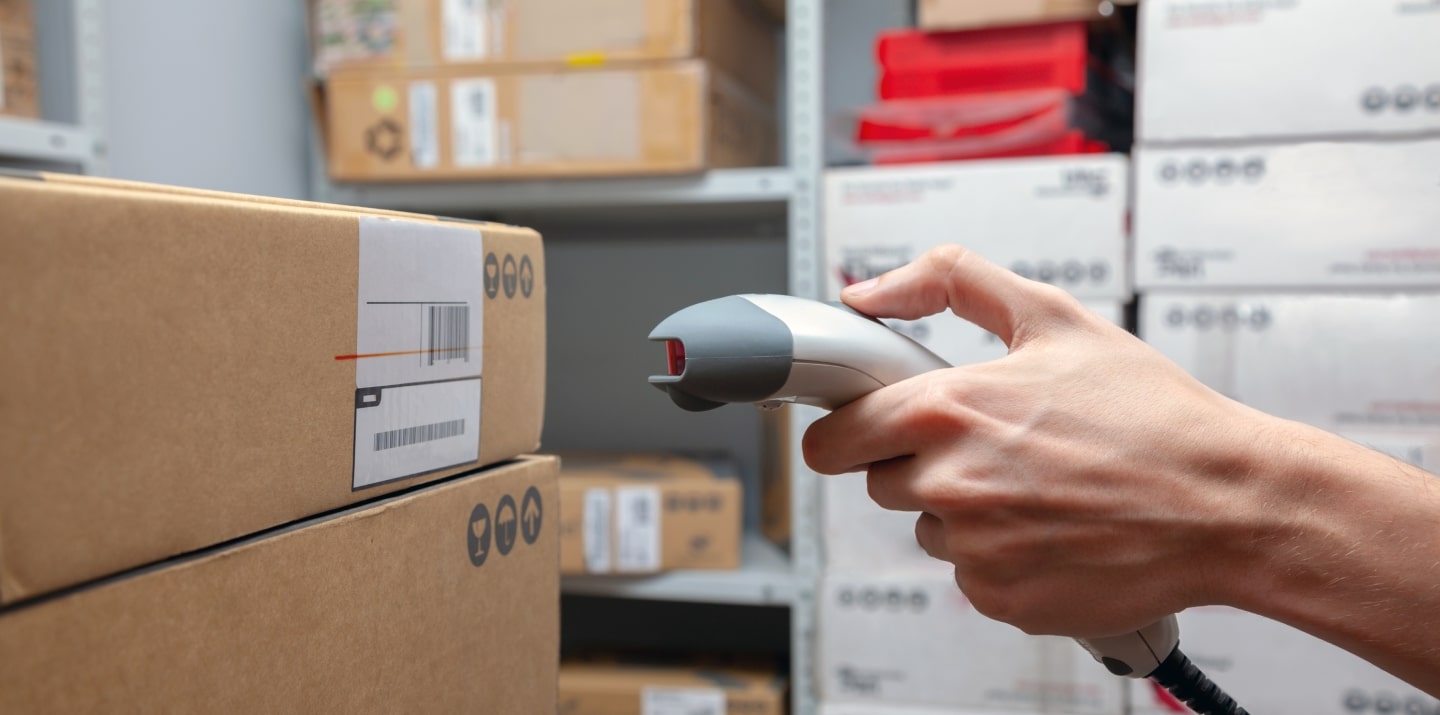
are designed for line-of-sight scanning within one to two feet; they’re a go-to option for individual product locating and tracking.
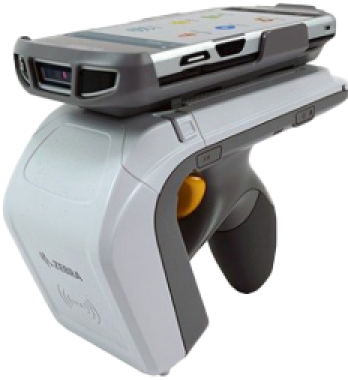
read data with in an up-to-20-feet range and can near-simultaneously scan multiple tags, but they lack accuracy compared to barcodes. They’re the perfect fit for large-scale tasks such as warehouse management.
As their unmet requirements for IMS functionality kept snowballing, the client faced a dilemma, whether to pour money into adding new features to their current system or invest in a custom solution.
To escape the vendor lock, they decided to opt for their own feature-rich software with unlimited scalability potential.
Solution
The client needed a device-agnostic solution that wouldn’t cost a fortune. Therefore, we went with the idea of a cross-platform app. As other client’s applications were already written in React Native, there were no doubts about the tech stack for the inventory software.
What challenges did our dedicated team face and overcome while crafting a powerful app that fully covered the client’s inventory-related workflows?
Stabilizing third-party libraries
and writing custom ones
Robust libraries are the backbone of smooth integration with barcode and RFID scanners. There are plenty of ready-made options.; However, you should have a seasoned development team able to spot the relevant ones, and write custom libraries to cover your specific inventory functionality.
To provide the client with a stable and easy-to-maintain solution, we followed four key principles when working with the libraries:
- Avoiding a cumbersome collection of libraries
The more libraries you have, the more challenging it is to keep them up to date, resolve conflicts between them, and manage a diverse set of dependencies.
- Preventing solution architecture complexity
Tight coupling of the software modules and dependency conflicts contribute to crafting a jerry-rigged solution with poor performance and excessive memory consumption.
- Stabilizing third-party libraries
Ready-made options can bring critical bugs to the production code, or they may join the ranks of neglected libraries that are no longer supported. In both cases, fine-tuning is a must.
- Striking the balance between third-party and custom libraries
Writing custom libraries takes way more time than calibrating the ready-made ones, so for the sake of development speed, it’s better to build them only for highly specific functionality not covered by the existing elements.
With the aforementioned points in mind, our team selected suitable open-source libraries for barcode scanners:
- Capture JS for Socket Mobile
- React Native BLE (react-native-ble-plx) for Netum
Capture JS is a stable library with detailed documentation, so it was ready to use right away, while React Native BLE was in beta and, therefore, required debugging and stabilization. Since open-source libraries provide full access to their code, *instinctools’ developers fixed it, honing performance and minimizing the overall risk of a third-party element adoption.
Meanwhile, integration with RFID scanners requires custom native libraries. For this purpose, our team utilized React Native Bridge, which works as a communication layer between native modules in Java and the client’s app in React Native with JavaScript code.
Incorporating tabletop RFID readers into the overall hardware ecosystem
Alongside handheld scanners, the client also has tabletop RFID readers. Those devices were much older than the rest of the client’s warehouse and in-store hardware.
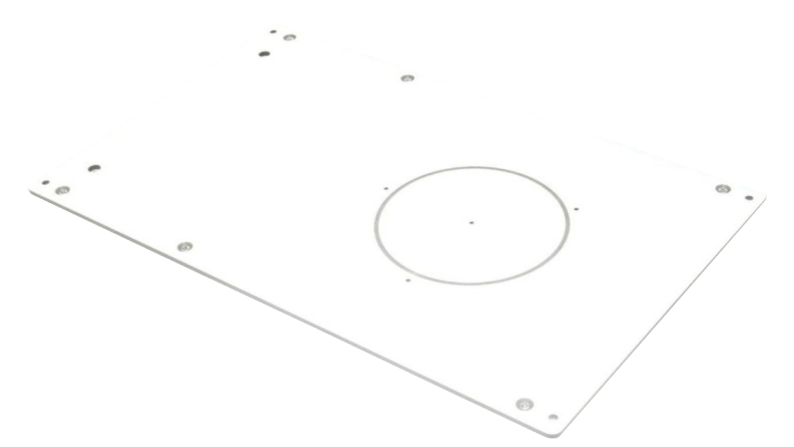
Given their age, the tabletop RFID readers:
- Lacked basic documentation
- Worked with byte messages
- Ran on a .NET library, while the rest of the client’s hardware used SDK libraries
The only artifact the client had for these readers was a configuration program. Due to this, *instinctools software engineers had to:
- Decompile the configuration program
- Investigate the code to understand the requests the program uses for communication with tabletop devices
- Configure the same requests in JavaScript
These actions helped standardize the tech stack for all the client’s scanners.
Fighting for the app’s speed
The client wanted to seize RFID scanners’ ability to read large amounts of data and accelerate tag processing. The previous software could handle 300 tags/sec, while their RFID scanners could read 600 tags/sec. Given 15,000+ tagged items in each of the 24 eyewear boutiques across France and Belgium, the client wanted to leverage the scanners’ full capacity.
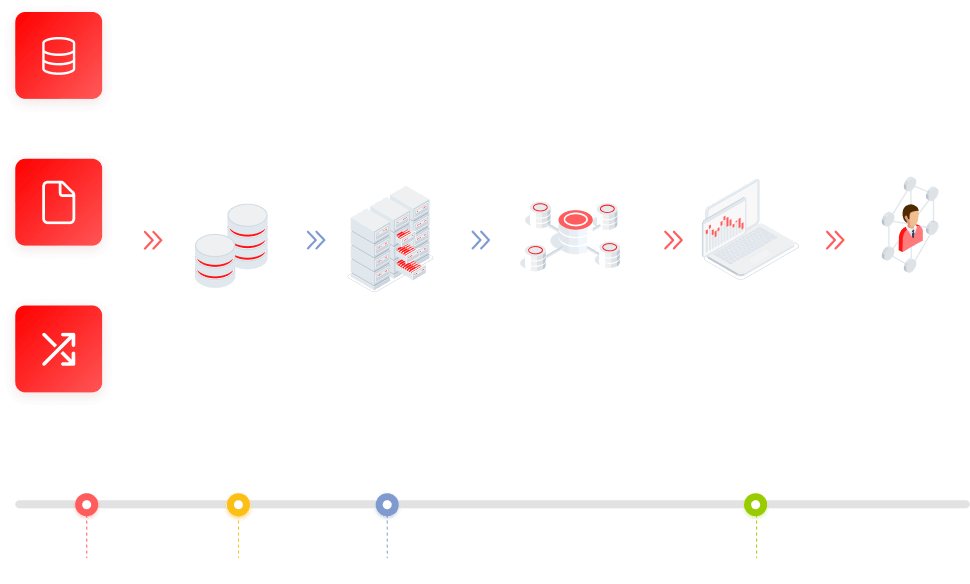
*Instinctools’ team selected asynchronous caching with scheduled cache refresh to scan the maximum number of tags per second without data streaming hiccups, rendering lags, and other performance glitches. Here’s how it works:
Thanks to using the native Java cache, the app can seamlessly handle 600 elements per second, which is twice the capacity of the client’s previous solution.
Besides doubling tag scanning speed, we’ve accelerated the tag validation process. Our team tripled the speed of data reconciliation between the back end and brick-and-mortar stores by taking advantage of native Java code.
Providing integration with RFID printers
The client decided to take the enhancement of their hardware ecosystem a step further and broaden it with RFID printers. This decision allowed the company to achieve independence from the suppliers of RFID tags and save on printing costs in the long run.
To ensure everything runs smoothly on the tech side, we designed the inventory app that could integrate seamlessly with various RFID printers, from Zebra and SATO to Toshiba, to name a few. That way, the client wasn’t limited in inventory equipment options and could print RFID tags entirely in-house.
Achieving inventory transparency with custom dashboards
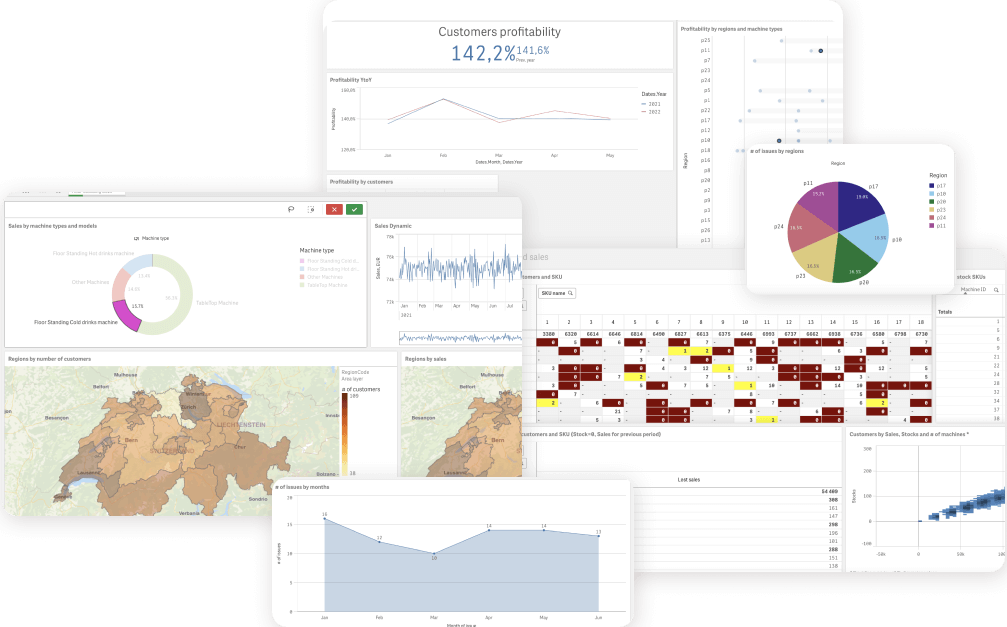
Before cooperating with *instinctools, the client didn’t have any dashboards to track inventory levels and, therefore, lacked transparency and traceability of the relevant processes.
Ensuring data tells a clear story is one of our areas of expertise, so the dedicated team bolstered the app’s functionality with a data visualization feature.
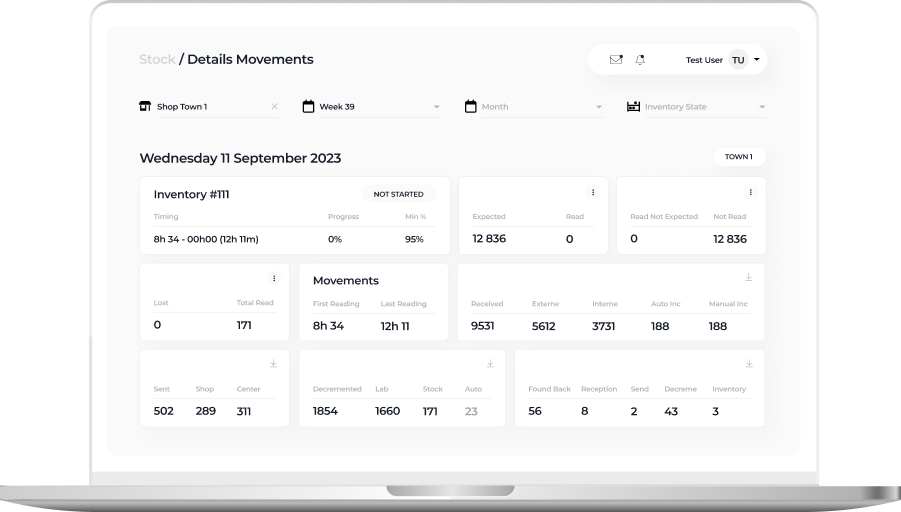
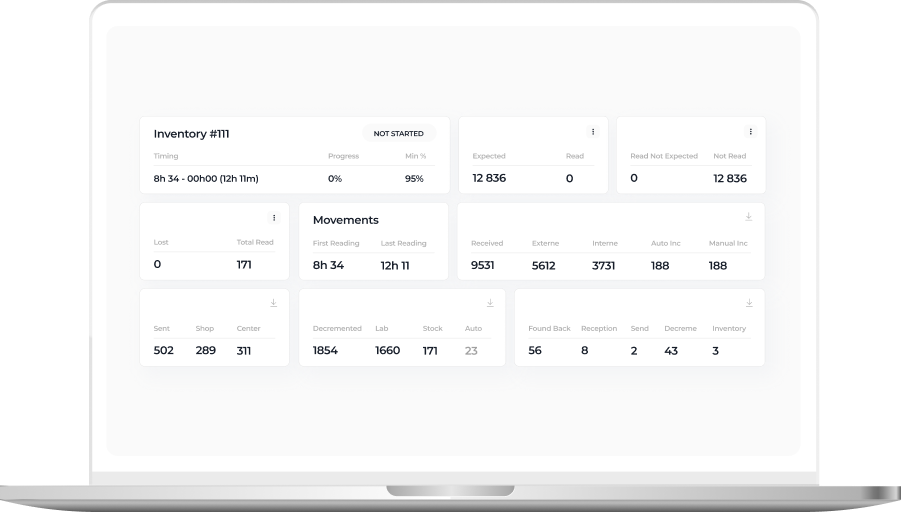
On this tab, in-store admins can check the status of inventories conducted in their store:
- In progress
- Closed
- Device issues
- Validated
- Missing
The staff can also see the number of expected, received, lost, and found back items, and inventory time.
This tab provides higher-level information about inventory status in weeks and months. Thanks to intuitive UI with color-coded table cells, it’s easy to spot inventories calling for detailed analysis:
- Successful inventories with more than 95% of items scanned and validated by the system are green
- Processes with device issues are orange
- Procedures with unidentified items are red
- Inventory-free days are gray
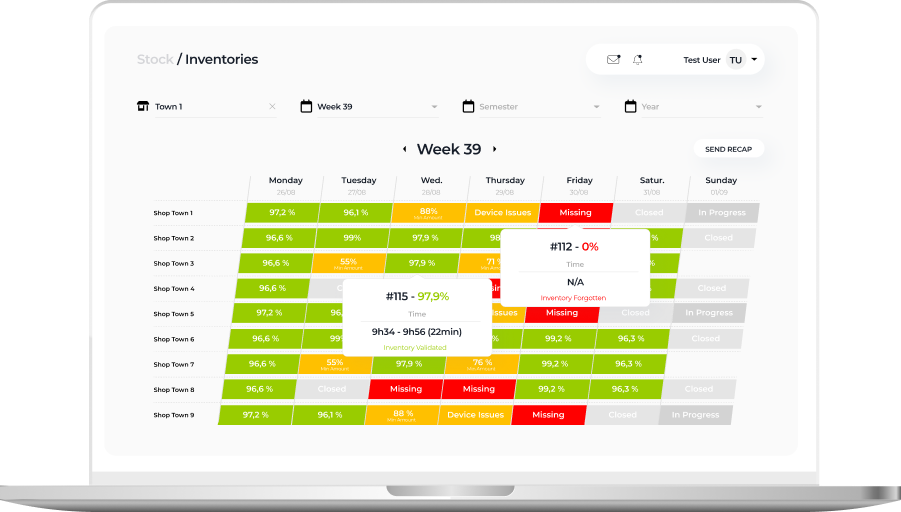
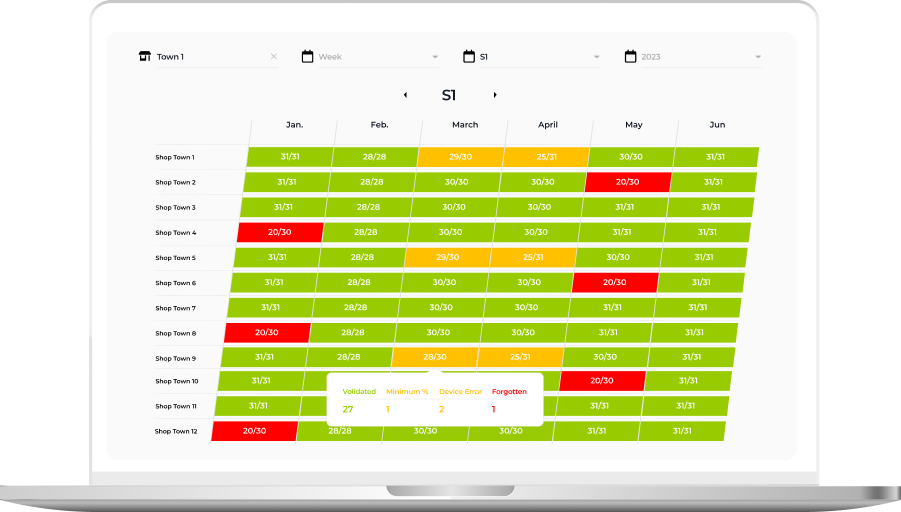
These custom dashboards provided the client with much-coveted traceability of inventory processes and empowered them to uncover and nip alarming issues in the bud.
Business value
Before
- Overpriced inventory software under the vendor lock-in
- Tabletop RFID readers run on legacy software
- Inability to use the full capacity of RFID readers
- Low tag validation speed
- Lack of visibility into the inventory flow
After
- The budget-friendly and flexible app is fully tailored to the client’s manufacturing and inventory workflows
- Standardized and easy-to-maintain tech stack
- Boosted RFID scanners’ reading capacity from 300 to 600 tags per second
- x3 tag validation speed
- Full transparency and traceability of inventory-related processes thanks to custom dashboards
Client’s testimonial
Here’s how the client’s product manager evaluates the outcomes of collaboration with *instinctools: