

How replacing Excel spreadsheets with interactive BI dashboards empowered a media-services provider to reimagine their data processing, reduce the cost of data management-related IT tasks by 27%, save 280 hours a month on report generation, and boost Customer Satisfaction Index by 7.2%.
Domain:
Media and Entertainment
Duration:
4 months
Budget:
$50.000
Home Success stories Tableau Implementation For a EU Streaming Service
The growing amount of business data not only made data processing and reporting within our customer’s company slow but also diminished trust in data quality.
In order to stand apart from the competition, reduce costs, and increase profits, a company must make intelligent decisions – decisions based on trustworthy and relevant data. This is exactly where BI comes in useful.
However, with traditional BI tools and processes, the IT department controls access to analytics data and does the data analysis work for business users. And as much as our customer craved for BI analytics instead of wasting an embarrassing amount of time copying and pasting things into excel, they were not really happy with the idea to operate in a highly controlled environment, where analysts or the IT team maintain access to data. It seems fairly rational since high dependency of business users on an IT department is time-consuming – waiting for the required reports may take up to several days – and really costly – the maintenance of an IT team is high so it’s better to free them from routine data capture and reporting and let them concentrate on high-level priorities.
Anyway, our customer reasonably believed that – here comes their quote – “data reporting and analysis should not be this hard” and hoped to make the in-depth analysis more user-friendly, so that everyone in a company could generate their own actionable insights, modifying the reports and dashboards without a hitch.
The key goal was to optimize the decision-making across the company within a business intelligence environment. To reach that, the following tasks were set:
To enable non-technical users to get insights into the data without relying on IT staff and, thus, speed up decision-making, self-service BI was decided to be deployed.
While working on the project, *instinctools team had to overcome a number of issues such as corrupted data, multiple data sources, terabytes of data to update, calculate and analyze, etc.
Nevertheless, we’ve managed to implement and integrate a self-service BI solution based on a visual analytics platform (Tableau), that fully meets the customer’s diverse requirements.
Thanks to self-service BI and Instinctools training program for business users, the employees can independently create ad hoc analyses specially addressing their particular needs. They are also able to modify the existing dashboards by themselves, easily adding metrics or KPIs that need to be tracked. On top of that, from now on all the data required for dashboards is prepared, integrated, and stored in a single data warehouse, which limits the pressure and workload on data management.
If there is still a need in adding new data sources and modifying the data models, adding new custom dashboards – instinctools team stays in touch to provide the required customer support.
ETL (Extract, Transform, and Load) - an automated process of blending data from multiple sources
user-friendly and modern UX/UI
high quality of data
predictive analytics
access rules applied to different departments and users
time saving for Big Data processing
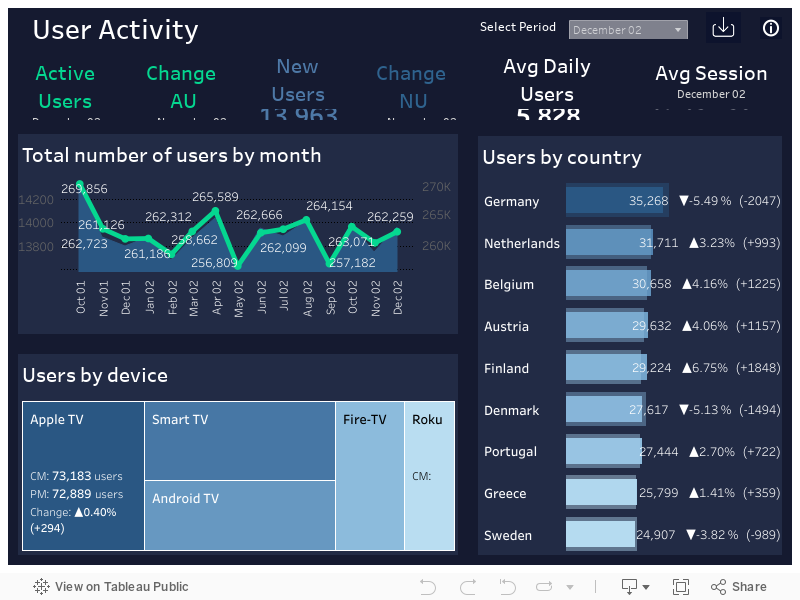
interactive dashboards
access to dashboards from various devices (phones, tablets, PC/Mac computers)
flexibility and high speed in modifying the dashboards
The expanded data access and analytics capabilities provided by self-service BI benefit our customer’s company in a variety of ways:

In a nutshell, the main accomplishment of the project is that it has brought our customer’s data to life and turned that data into insights for the people who need it the most, business users.


